

We got an early pop yesterday after the PCE data came out, which really wasn't important but the market was setup for a move up and it just used that data as a catalyst to rally. But it failed to hold and dropped back to negative midday after that 20 point pop, and then it went back up into the close to around the same zone.
The market is close to a bottom as that pop and retrace was back test of the falling channel the market has been in since the high. This tells me that today or Monday we should see another multi-day rally of 100+ points. Possibly it starts today, it's hard too know for sure? We got close to the 5050 zone yesterday with a hit of 5060, which might be "close enough", suggesting any pullback today might be just a higher low.
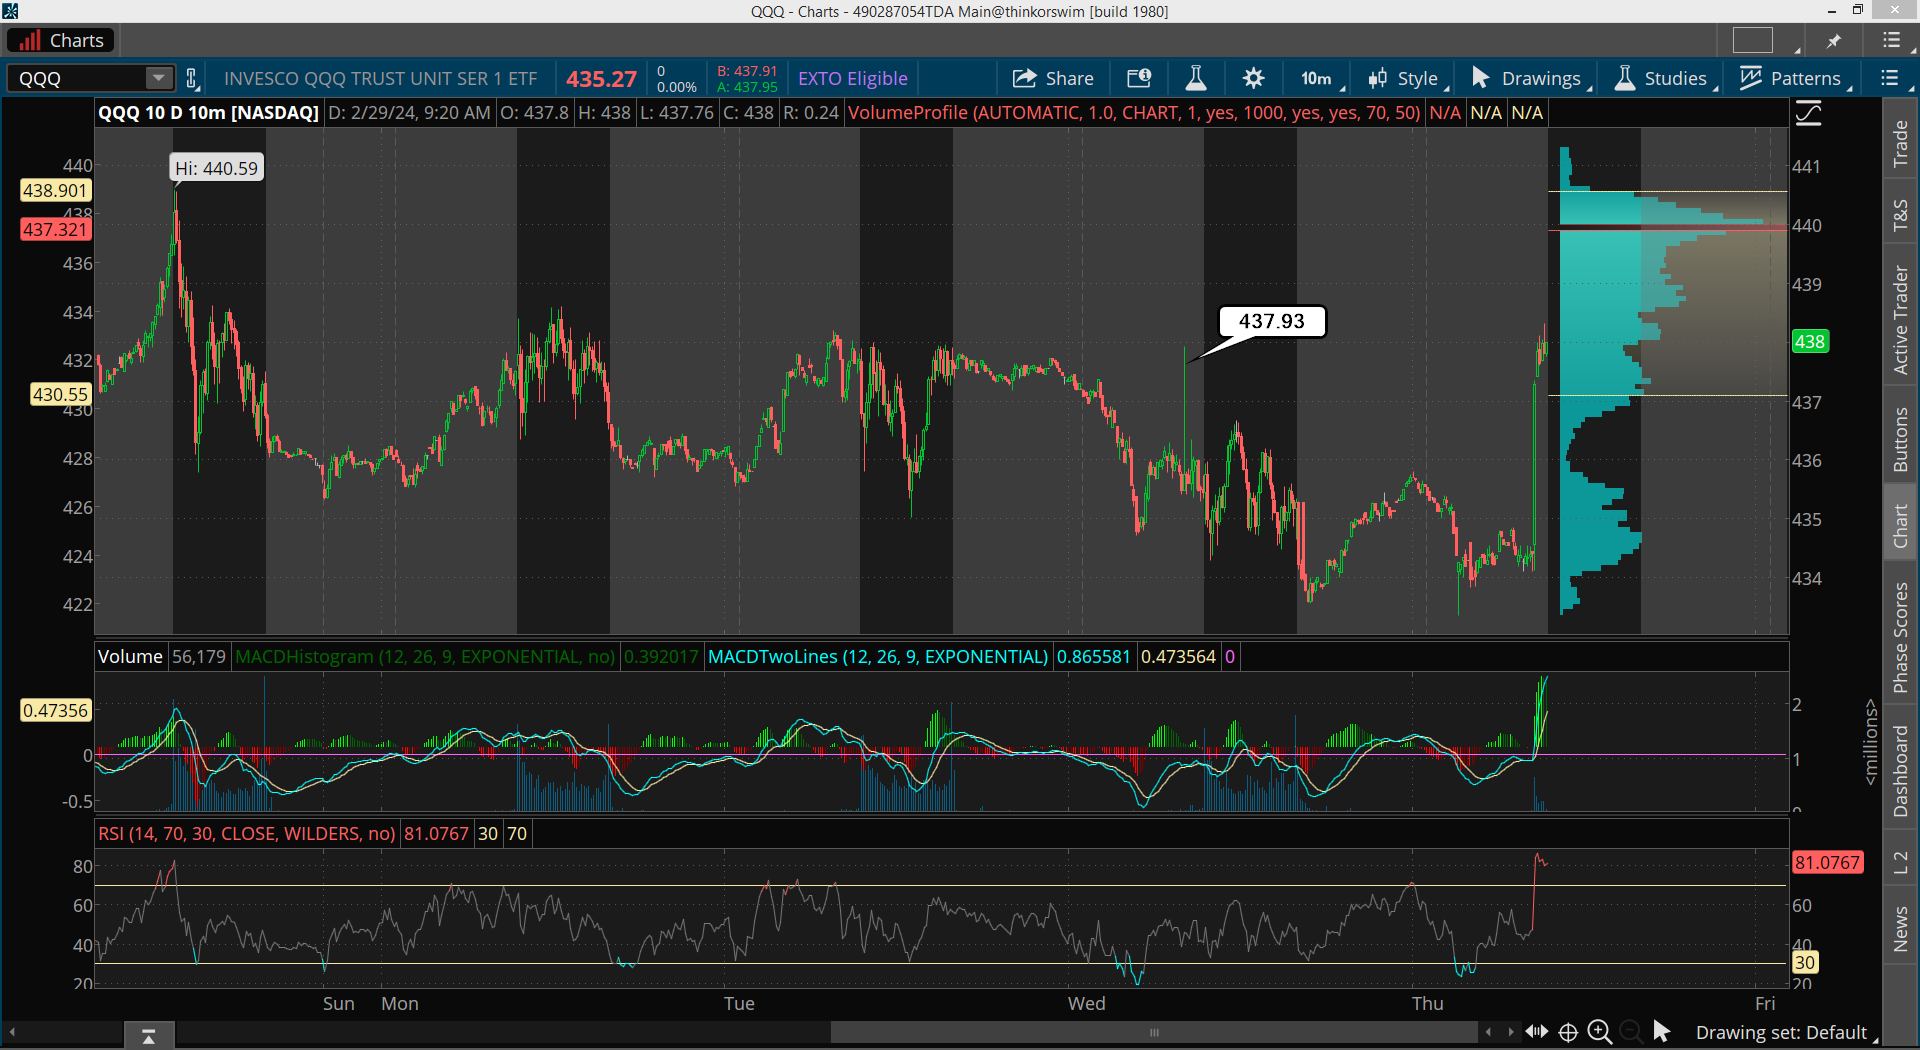
I posted the chart above in the chatroom yesterday, which is a fake print on the QQQ, and low and behold it was hit and pierce around the open before a reversal back down midday, so it was a "signal" that it would be a point of interest where the market would hit and turn from.
Over the many years of tracking FP's I've noticed that the intraday one's don't have any edge for them hitting and reversing back down for days or weeks. They can hit and pause, and the go further in the same direction, or hit and reverse for only an intraday move like yesterday... and then continue in the same direction. The only thing I use them for is to exit positions I'm in that are based on the technicals.
Moving on... another strong rally is close and should go into next week. We should hit my 5146 target, possibly pause there and pullback some. It will be a point to exit longs and wait for a better entry from another move down I think. But I'll have to wait to see how the technicals are when we get there, as it might reach the next target of 5190.
Now as far as wave count goes, if we bottomed yesterday, then that should completed Small Wave 4, which means we are in Small Wave 5 up now. Wave fives can go any amount. They can truncate short, extend to be longer then the wave three, match the wave one... pretty much any amount.
My feeling on it are that we have a target of 5146 with my Fibonacci Extension System, which is the shorter and closer one. Then there's another higher one at 5190, so one of those zone would be a likely top for the coming rally that I'm calling Small Wave 5 right now. If that count is correct then it will complete Medium Wave 3, and from there we should see a decent pullback of 3%+ I'd think.
We have Jay Powell speaking next Wednesday, so possibly we rally up into that date and he causes some small panic for that Medium Wave 4 pullback? But it shouldn't start the bigger pullback I think as it should be followed by Medium Wave 5 up into late March, like "possibly" the 22nd? If that happens we'll complete either a Large Wave C or 5, and with the C the market will have topped and we'll start the bear market.
But I lean toward the 5 because there's no negative divergence on the weekly chart yet, therefore a 5-10% pullback for Large Wave 4 would be more likely. Then a final rally for Large Wave 5 into late summer. Below is a chart I posted in the chatroom yesterday showing that divergences.
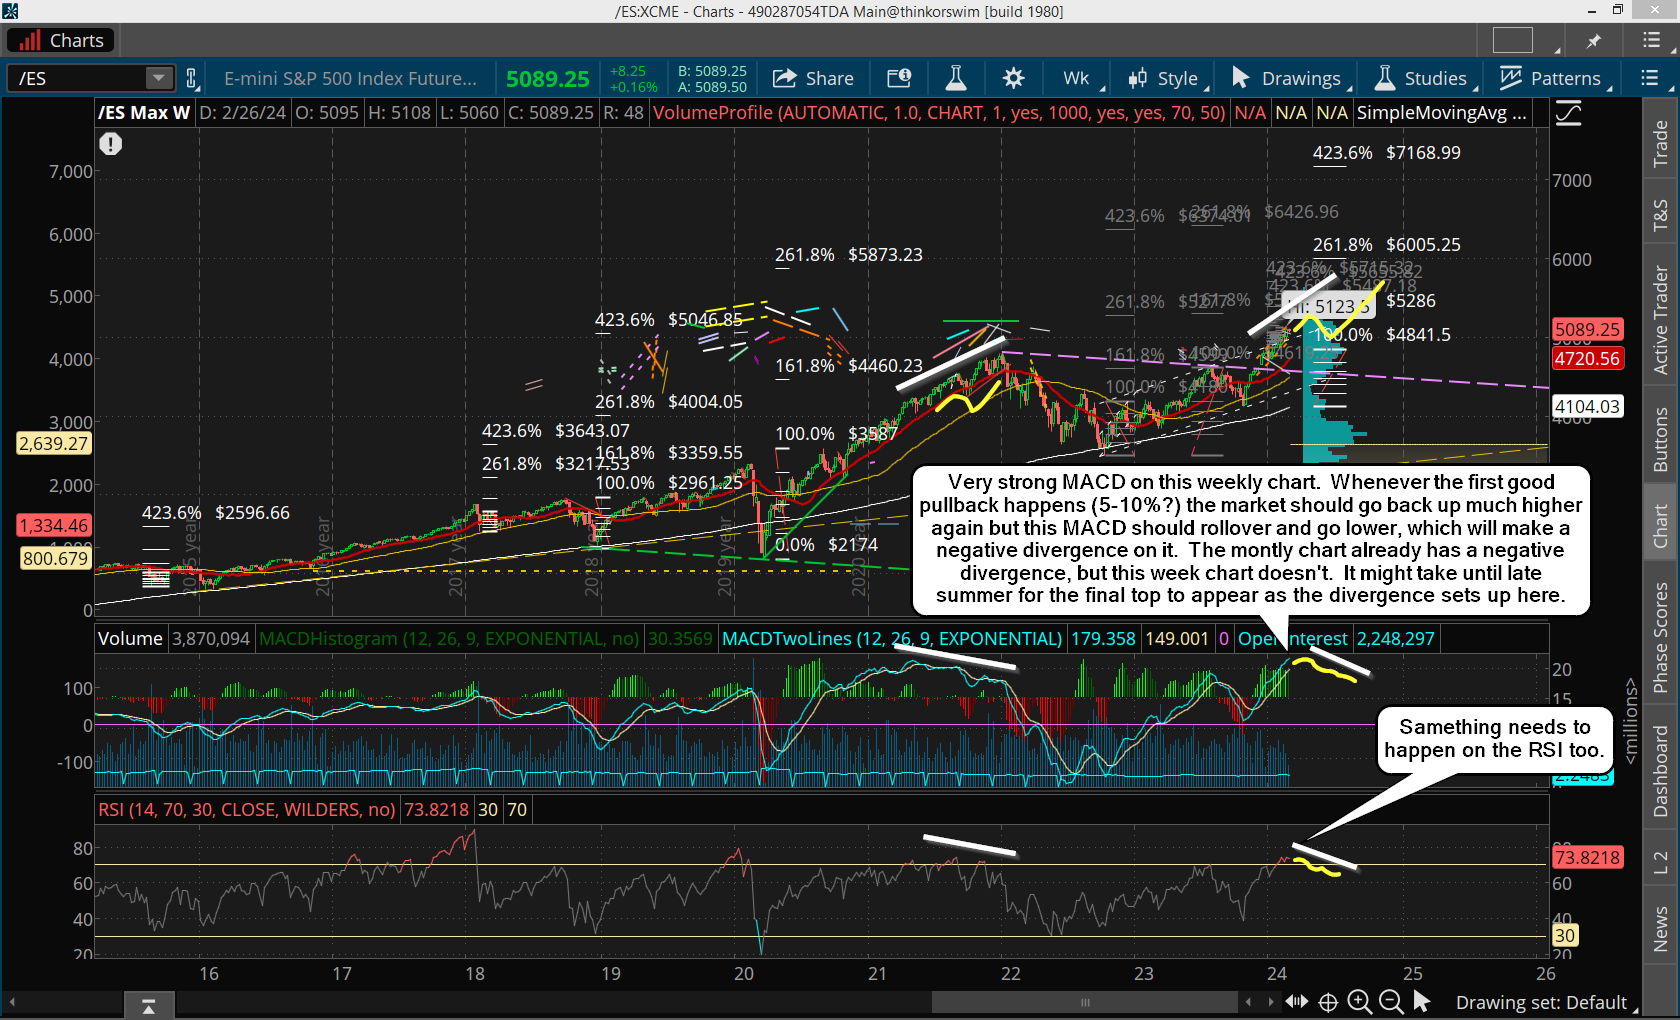
It's never a guarantee that we MUST have a negative divergence but usually we have one. Something that could cause that not to happen would be some kind of event (another false flag?), which then we'd get another drop like the COVID crash in 2020. I have no way of knowing if that's going to happen or not, so I will just place my short with the mindset that we will only get a 5-10% pullback, and if it turns out to be more then I'll adapt. We'll cross that road when we get there. For now let's just see if we get the rally up to 5146 or 5190 the next few days.
Have a great weekend.
Have a blessed day.

