

We got the rally last Friday to the 5146 level from my short term Fibonacci Extension Target, which I'm going to abbreviate to just FET going forward. Now looking back in time from my post I did on the 161.8% extension it's common to see exactly what we saw last week. What I mean is that there was a run up to "almost hit the FET", then a small pullback, and final a hit and pierce of the FET.
We saw that happen last week with the first high of 5123, which was the one that fell shy, then the pullback, and finally the rally up to pierce the FET of 5146 on Friday. Now that was a short term FET, and since that pattern has completed now we should pullback some early this week before the next rally up to the next FET of 5190, which is close to another FET at 5225, so somewhere in that zone would be the next high before another small pullback or pause happens.
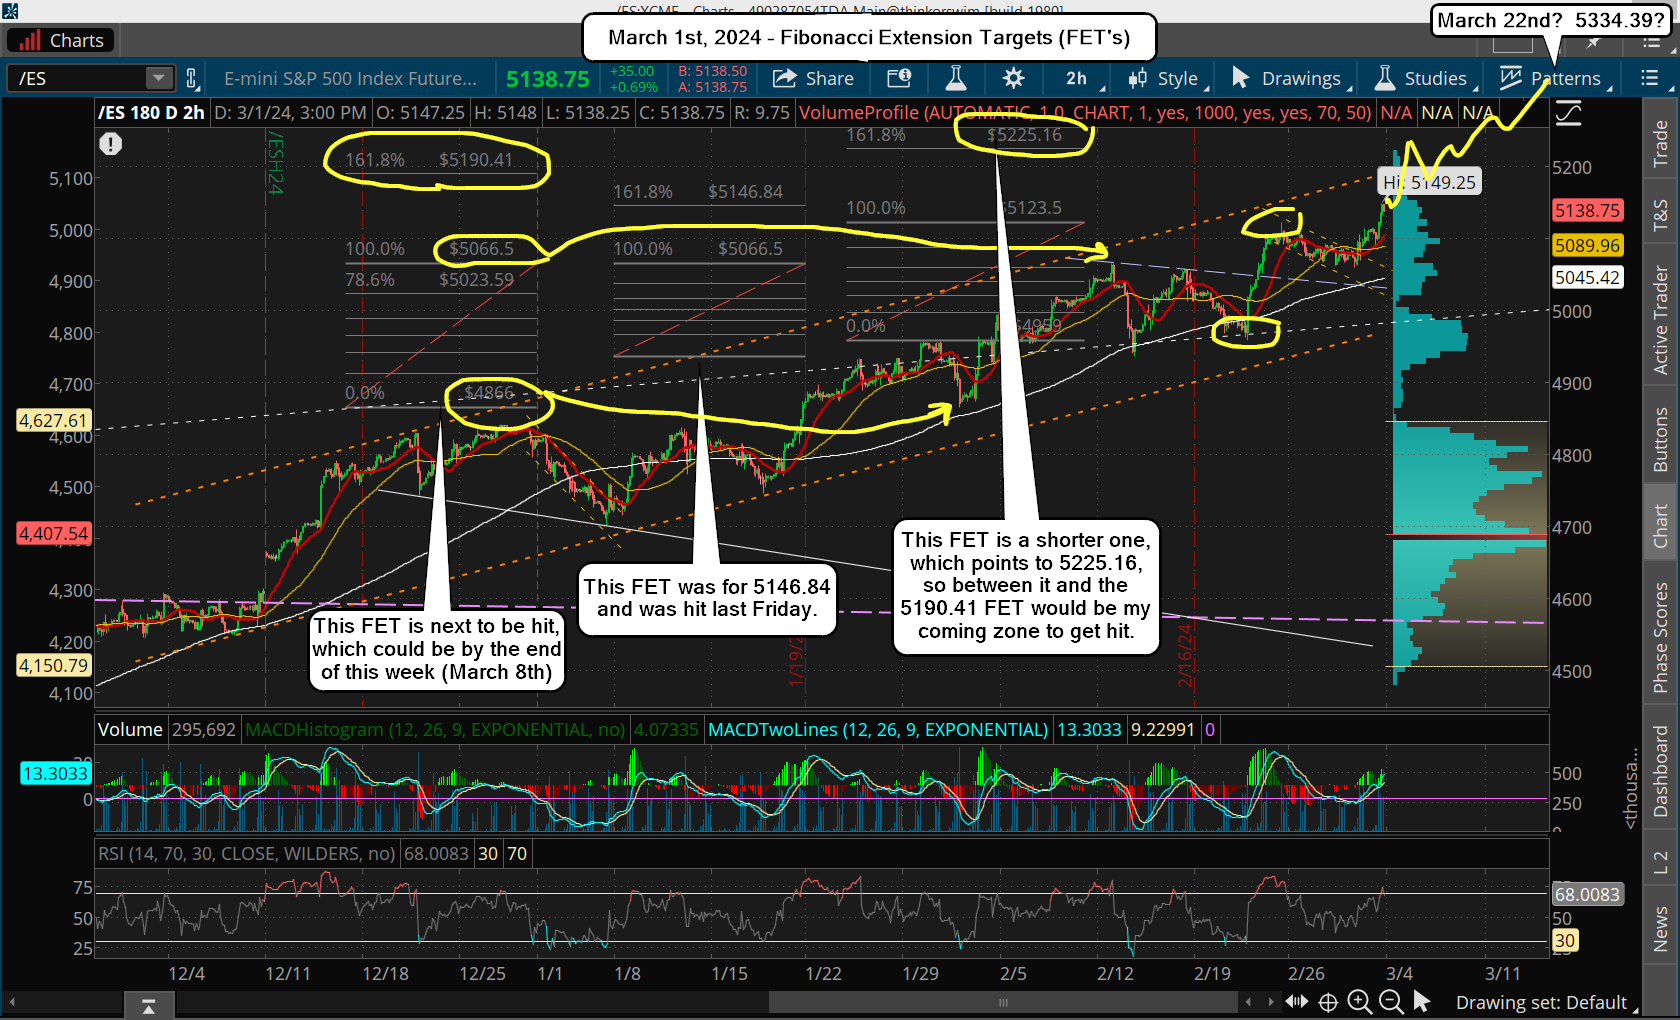
The levels that I calculated those price points from, (chart above), for the FET of 5190, was using the 4866 low on 1/31/24 to the 5066 high on 2/12/24, which projects a 161.8% extension high of 5190. The other FET of 5225 was calculated from the 2/21/24 low of 4959 to the recent high of 5123 on 2/23/24.
Those two are close to each other so somewhere in that range would be the next upside zone where the rally expected next week should end at and pullback or pause again. Meaning we should "pause" Monday and/or Tuesday of this week (possible pullback to 5110 or less?) and then start the next move up for the two FET's at 5190-5225 the rest of the week.
That should take us into the week of OPEX (next week), which is where the pullback for Small Wave 4 should happen. That would leave Small Wave 5 up into the following week, and interestingly we have an FOMC meeting on Wednesday, March 20th... right in front of the turn date on March 22nd. Very nice timing for sure.
My best guess would again be to see a "pause" on Monday and Tuesday that week (18th/19th), and then a last squeeze back up into Friday the 22nd to reach the biggest FET I have, which was calculated from the 3502 in October of 2022 and the 4634 high on 7/27/23, which projects a 161.8% level of 5334. That... in my opinion is "The Big ONE", and should be the point where we see a nice pullback of 300-500 points from.
I'm thinking it will complete a Large Wave C (or 3?), which should produce a 5-10% pullback (if L3) or "the top" if LC... which would mean a much, much larger drop. I don't think it will be that way because I don't see any negative divergence yet on the weekly chart, but there's really no way to know until it happens. Here's my new adjusted wave count...
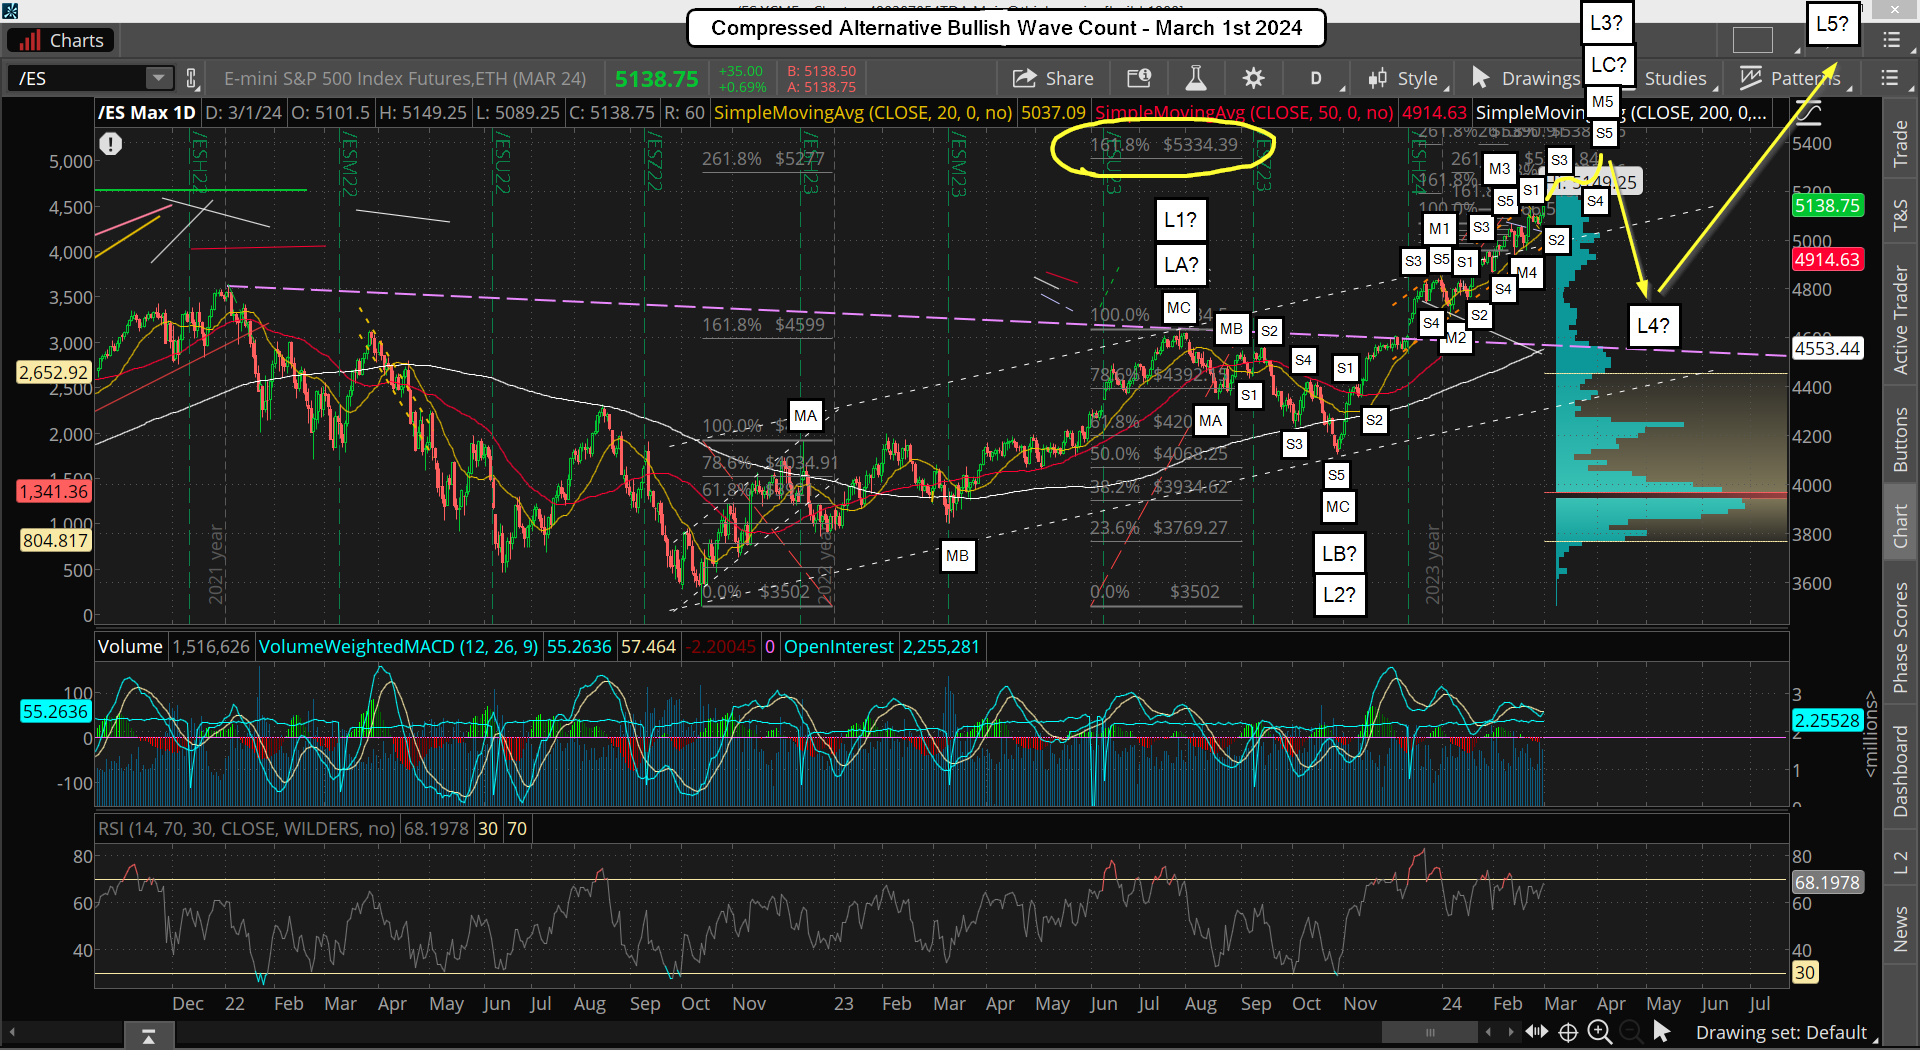
The big thing I've changed is that I removed the Tiny Waves 1-5 and just marked them as Small Waves. It suggests the 5066 high on 2/12/24 ended Small Wave 5 up, and Medium Wave 3 up. Then the pullback afterwards completed Medium Wave 4, and now we are in Medium Wave 5 up, which will have five small waves inside it.
My best guess is that we started Small Wave 3 up inside Medium Wave 5 last Friday, and that it will end in the 5190-5225 zone. Then a small pullback for Small Wave 4 the first couple of days next week, and the final Small Wave 5 up into Friday, March 22nd. That should complete Medium Wave 5, inside Large Wave C (or 3?) which is where the best sell should come from. Here's a close up of the waves...
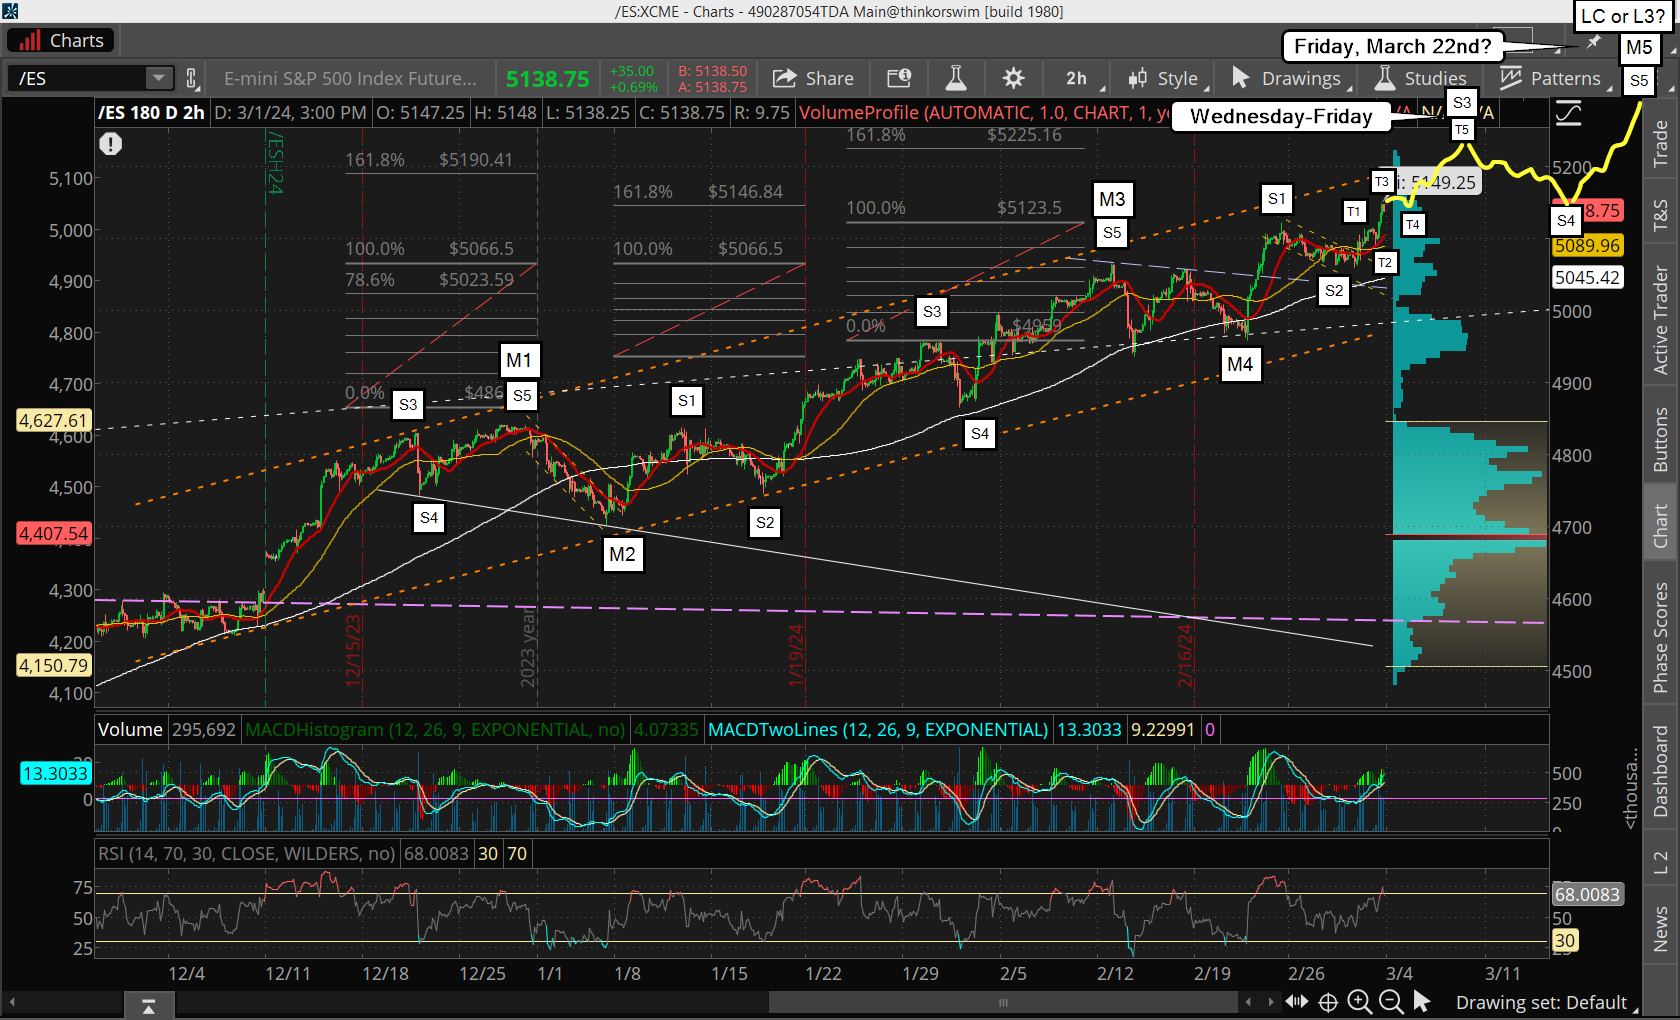
I think that on Friday we started Small Wave 3 up inside Medium Wave 5, which probably will end by this Friday. The small intraday pullback on Thursday was likely a Tiny Wave 2, with Tiny Wave 3 up afterwards. Any pullback today should be Tiny Wave 4, then Tiny Wave 5 should reach the 5190-5225 zone.
It's at that point where we could see a similar choppy sideways pullback the first 2-4 days of next week for Small Wave 4 that could look like Small Wave 2 did from it's 5123 start on 2/23 to the 5060 low on 2/29... only it will be shorter in time I think. It should be the move into the FOMC next Wednesday the 20th. Then something Powell says can be blamed for the final rally up into Friday toward FET of 5334.39 to complete all the waves.
The drop afterwards could be a large one. I don't know how much but could be something similar to the July top (LA or L1) down to the October low (LB or L2). That drop was from 4634.50 to 4122.25, which was a 11% pullback. If we reach 5334.39 then 11% would be 590 points down roughly. I doubt if it repeats like that but it's something to remember. I lean toward 300-500 points at most. We'll see.
Have a blessed day.

