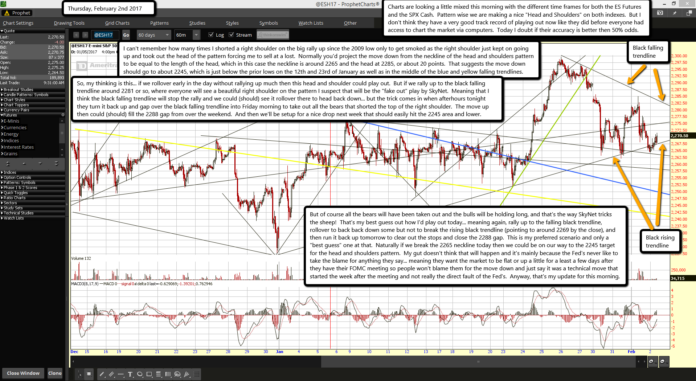
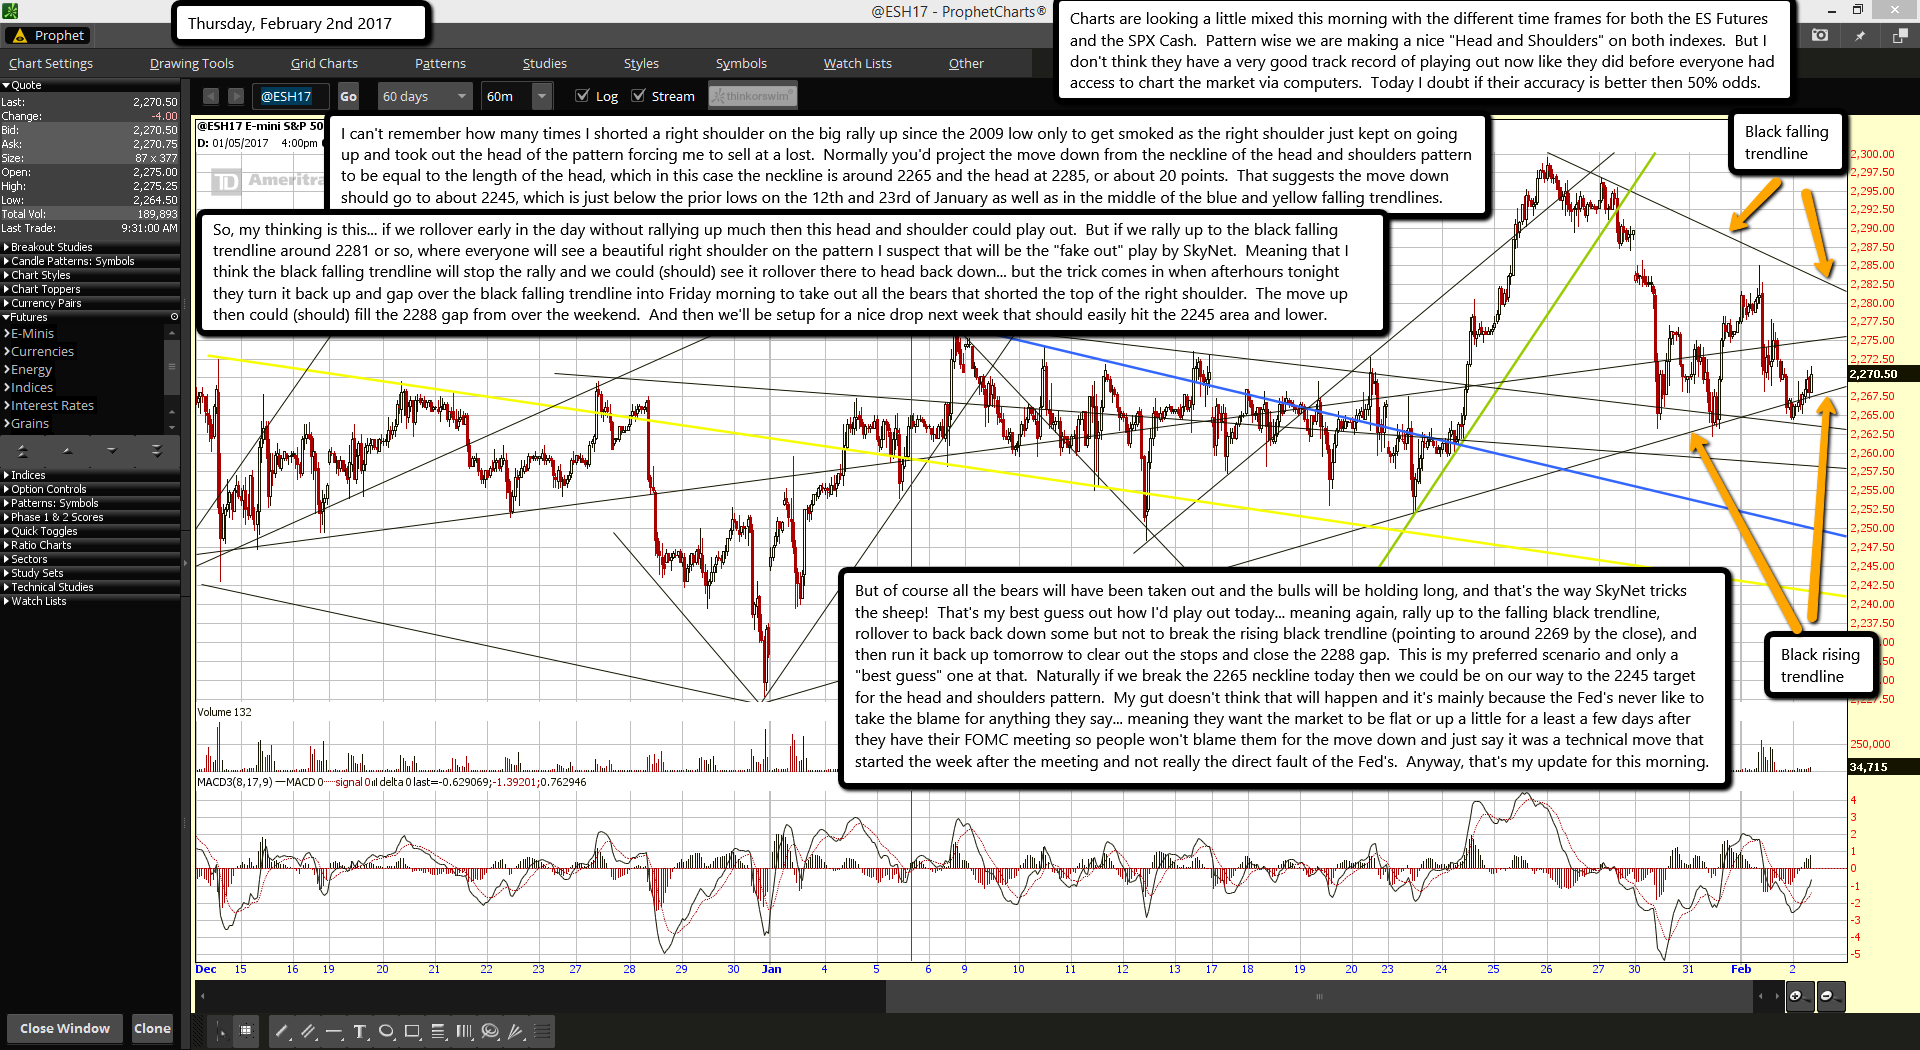
Charts are looking a little mixed this morning with the different time frames for both the ES Futures and the SPX Cash. Pattern wise we are making a nice "Head and Shoulders" on both indexes. But I don't think they have a very good track record of playing out now like they did before everyone had access to chart the market via computers. Today I doubt if their accuracy is better then 50% odds.
I can't remember how many times I shorted a right shoulder on the big rally up since the 2009 low only to get smoked as the right shoulder just kept on going up and took out the head of the pattern forcing me to sell at a lost. Normally you'd project the move down from the neckline of the head and shoulders pattern to be equal to the length of the head, which in this case the neckline is around 2265 and the head at 2285, or about 20 points. That suggests the move down should go to about 2245, which is just below the prior lows on the 12th and 23rd of January as well as in the middle of the blue and yellow falling trendlines.
So, my thinking is this... if we rollover early in the day without rallying up much then this head and shoulder could play out. But if we rally up to the black falling trendline around 2281 or so, where everyone will see a beautiful right shoulder on the pattern I suspect that will be the "fake out" play by SkyNet. Meaning that I think the black falling trendline will stop the rally and we could (should) see it rollover there to head back down... but the trick comes in when afterhours tonight they turn it back up and gap over the black falling trendline into Friday morning to take out all the bears that shorted the top of the right shoulder. The move up then could (should) fill the 2288 gap from over the weekend. And then we'll be setup for a nice drop next week that should easily hit the 2245 area and lower.
But of course all the bears will have been taken out and the bulls will be holding long, and that's the way SkyNet tricks the sheep! That's my best guess out how I'd play out today... meaning again, rally up to the falling black trendline, rollover to back back down some but not to break the rising black trendline (pointing to around 2269 by the close), and then run it back up tomorrow to clear out the stops and close the 2288 gap. This is my preferred scenario and only a "best guess" one at that. Naturally if we break the 2265 neckline today then we could be on our way to the 2245 target for the head and shoulders pattern. My gut doesn't think that will happen and it's mainly because the Fed's never like to take the blame for anything they say... meaning they want the market to be flat or up a little for a least a few days after they have their FOMC meeting so people won't blame them for the move down and just say it was a technical move that started the week after the meeting and not really the direct fault of the Fed's. Anyway, that's my update for this morning.


