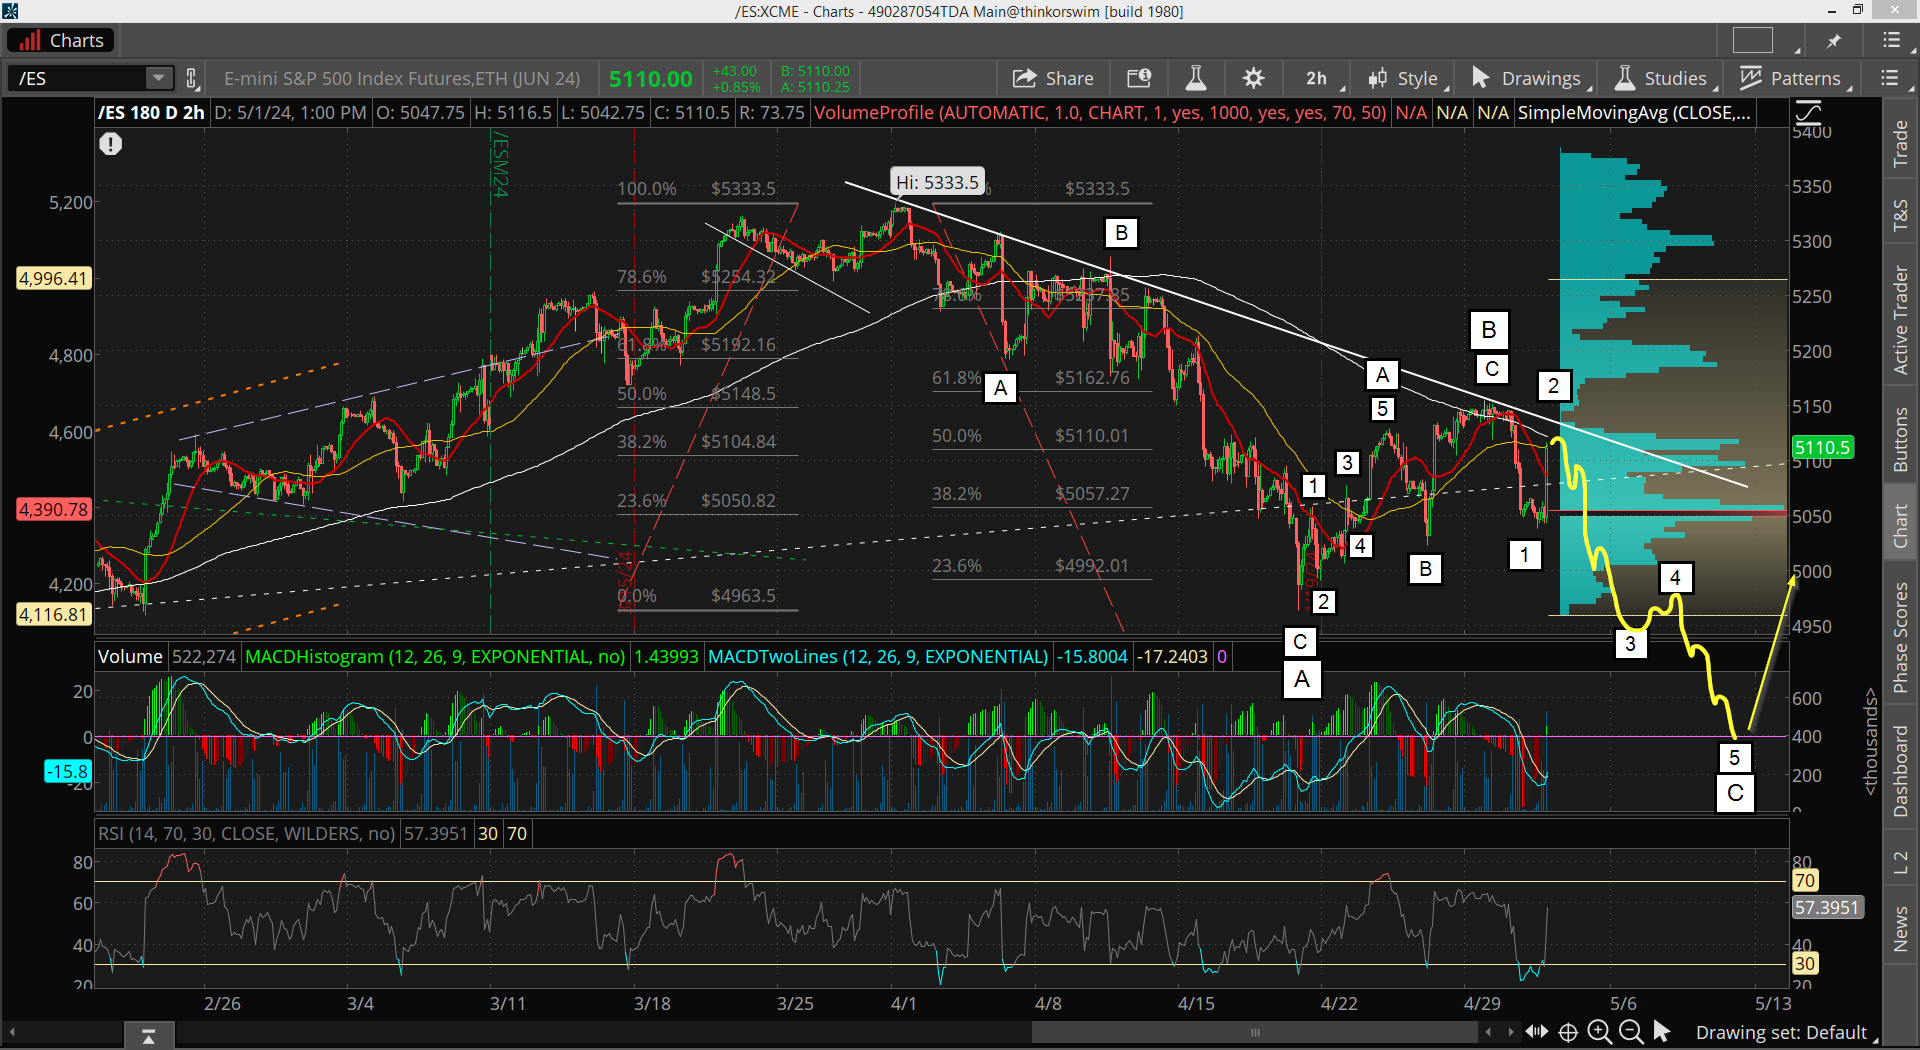
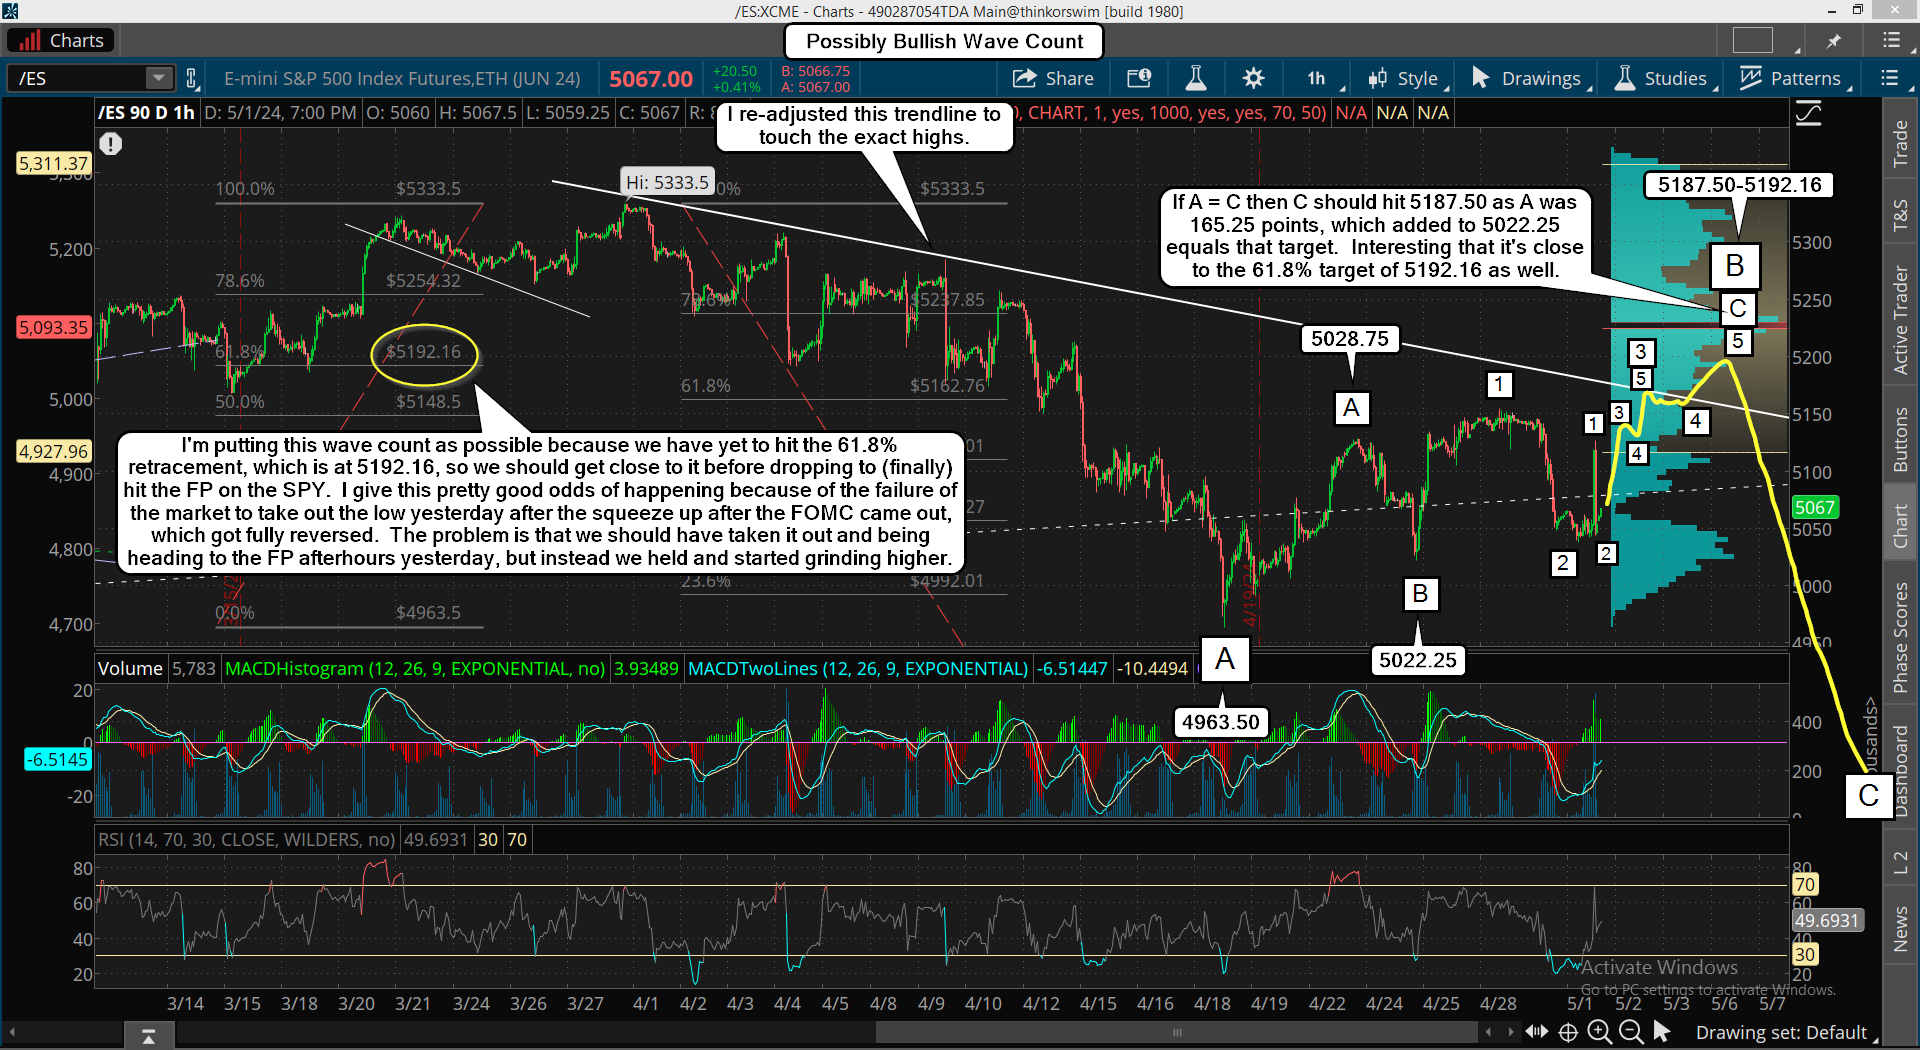
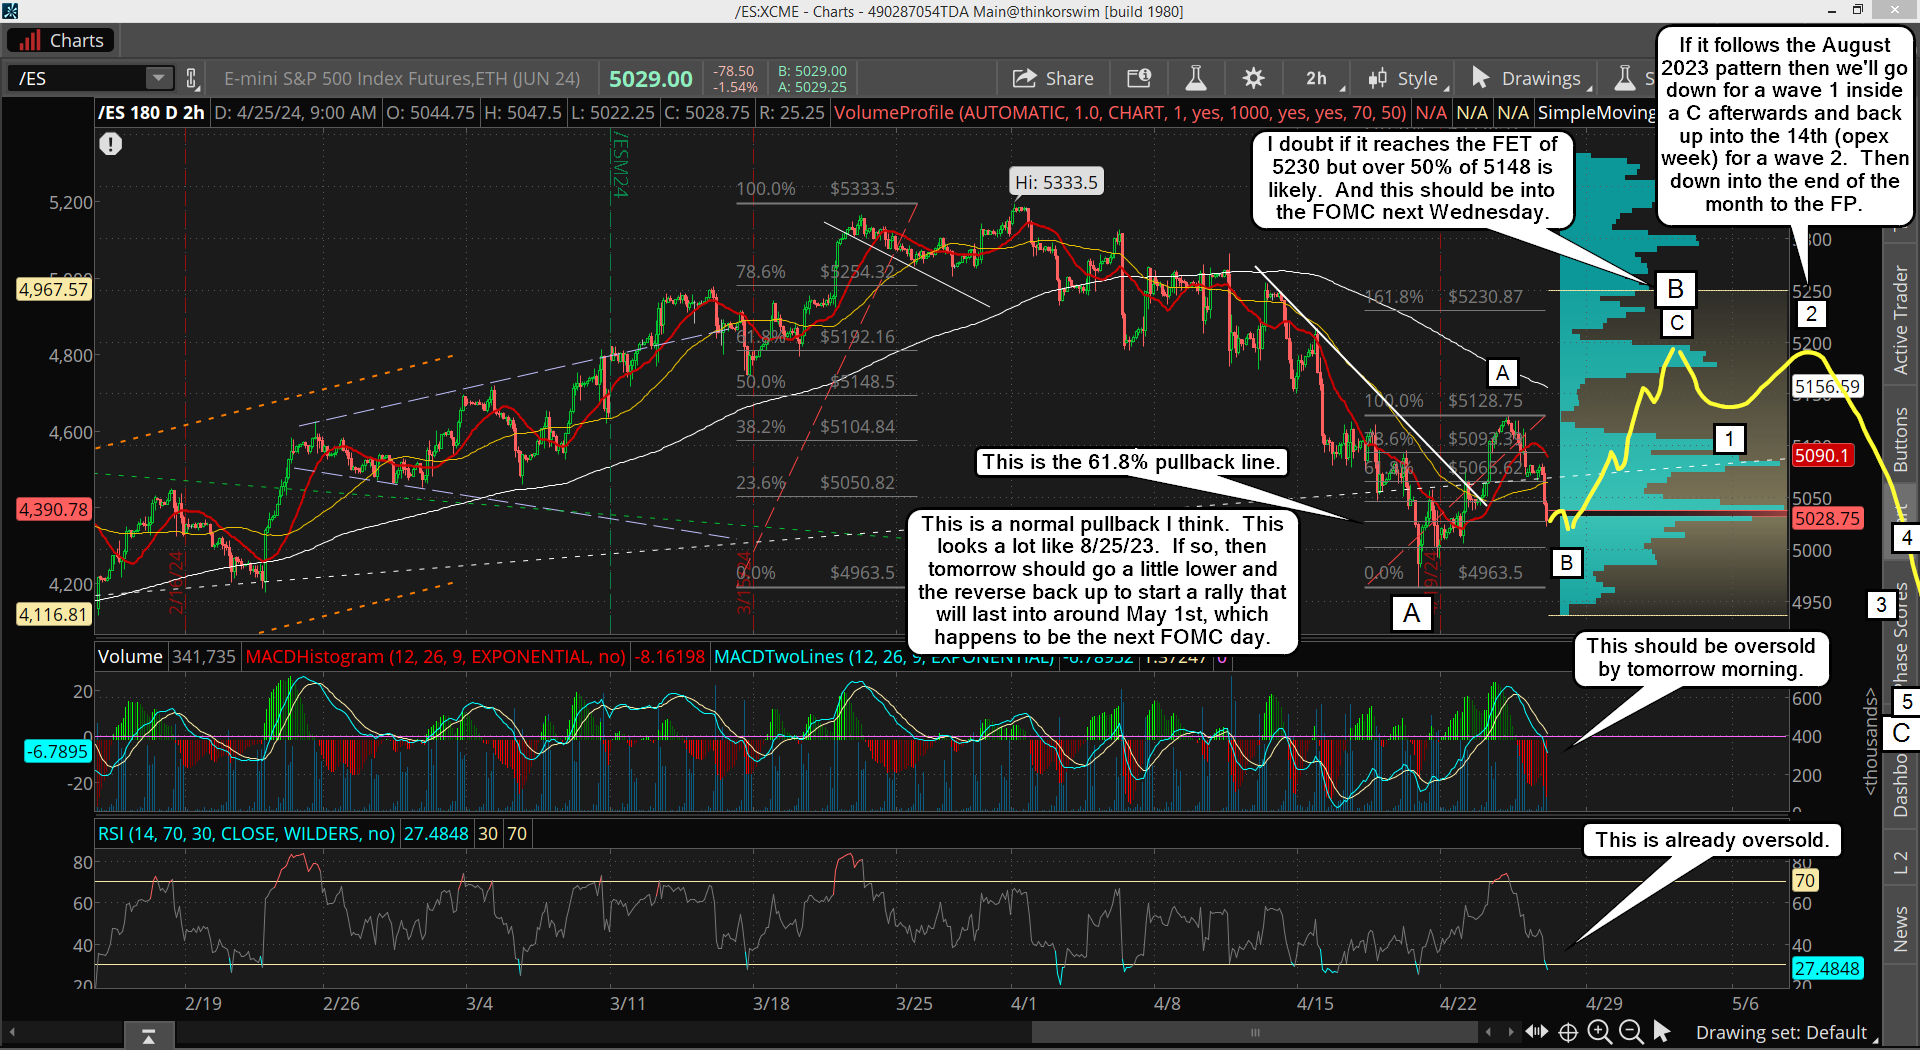
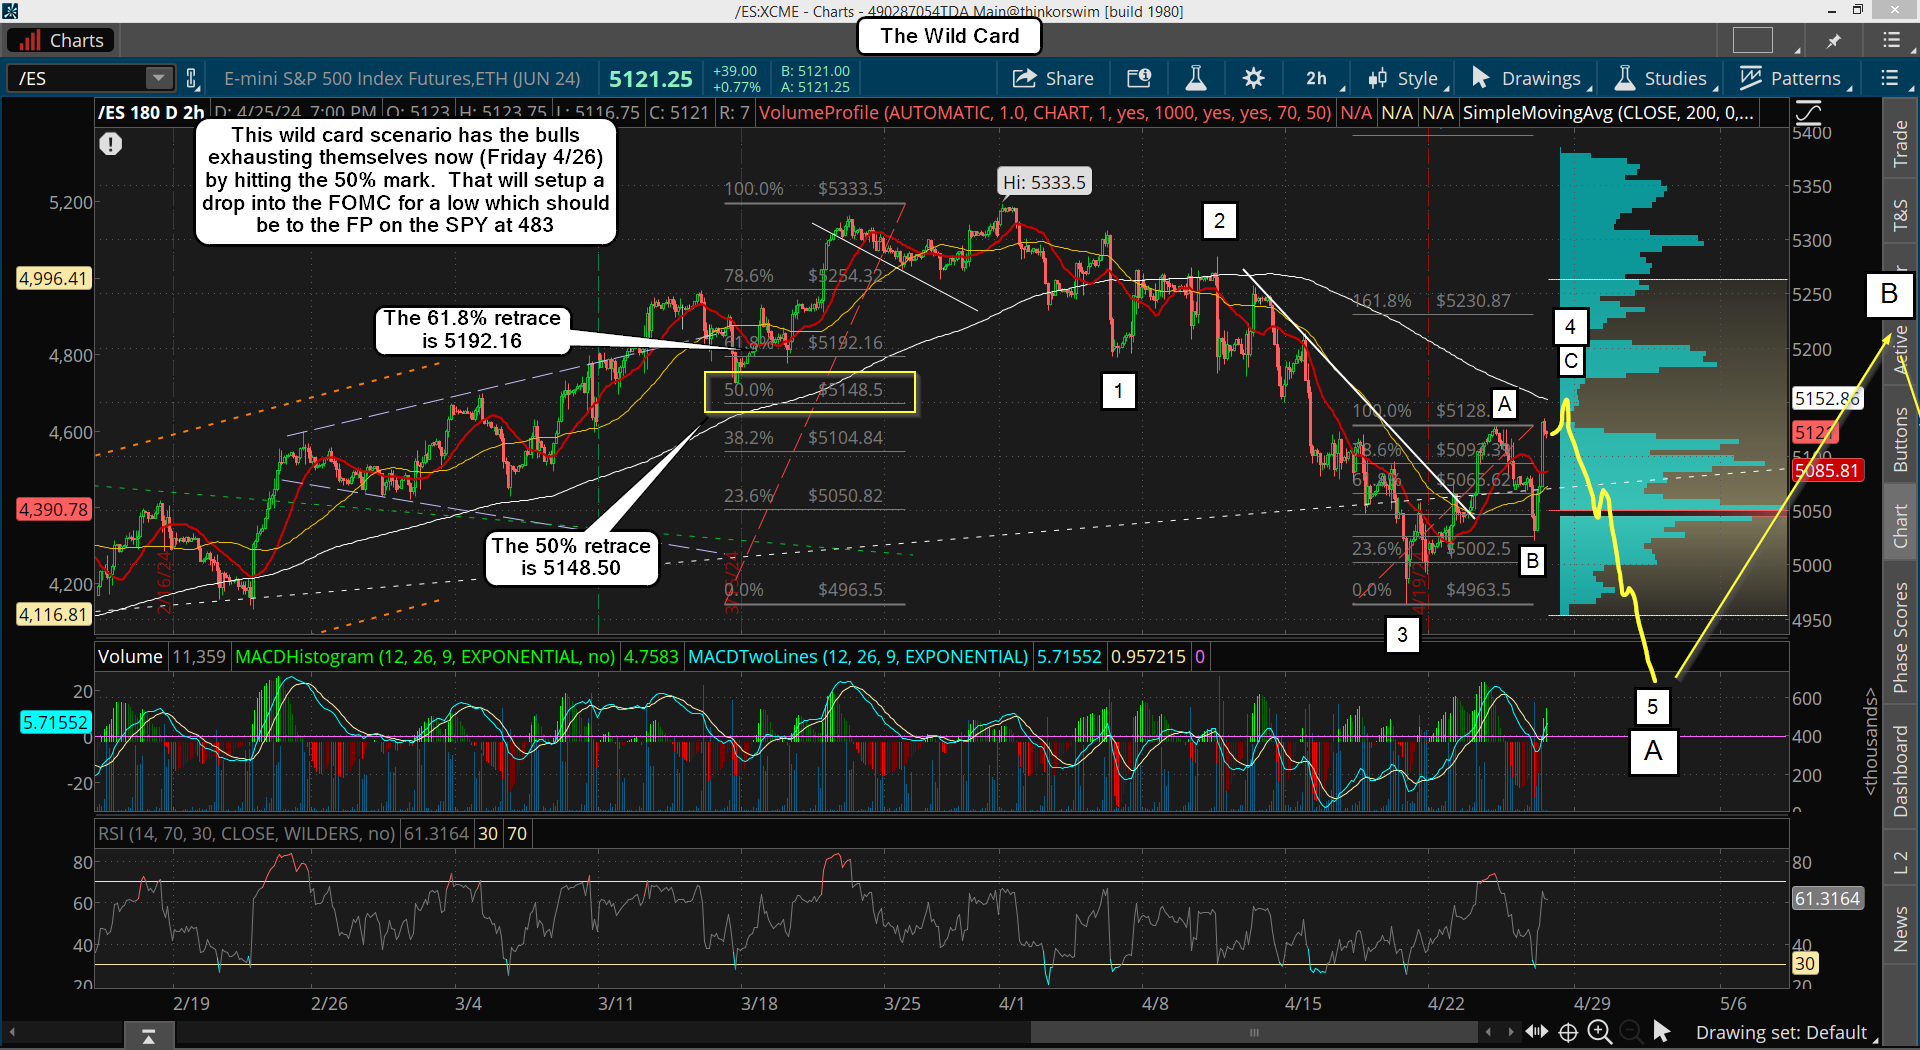
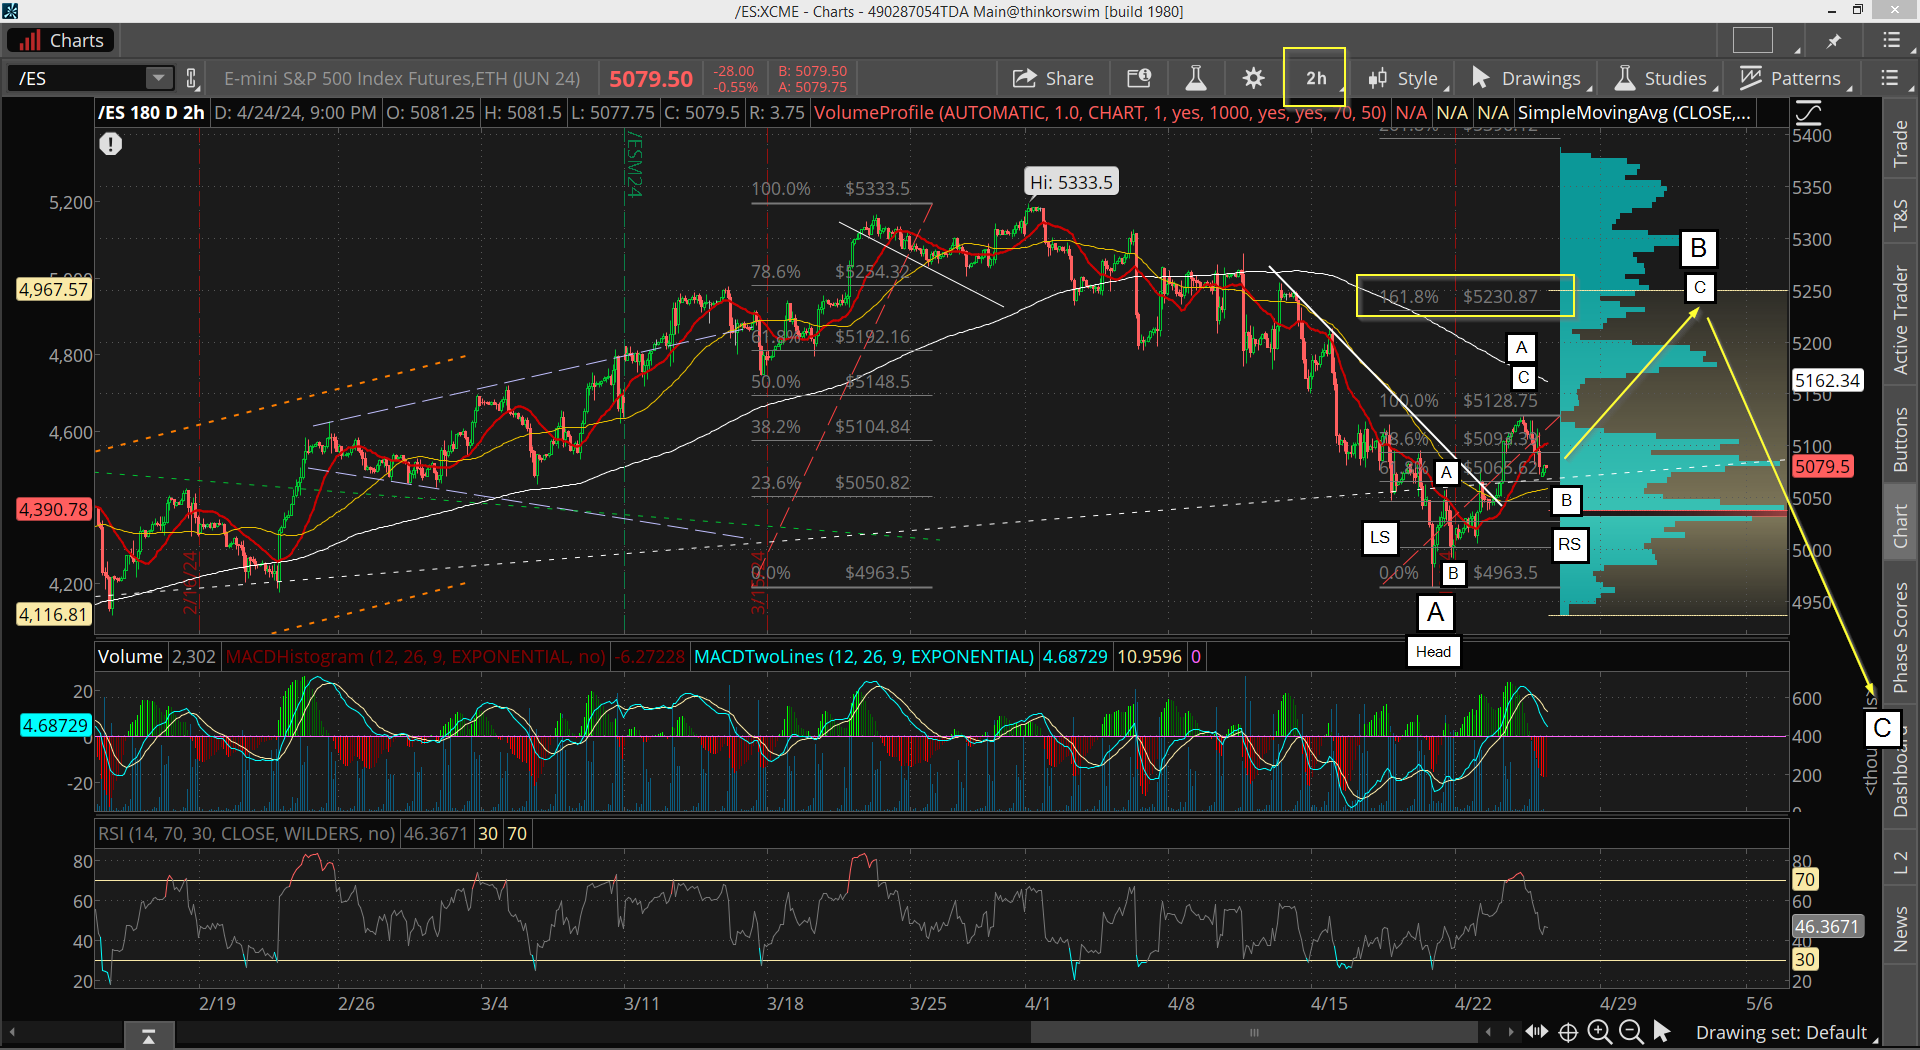
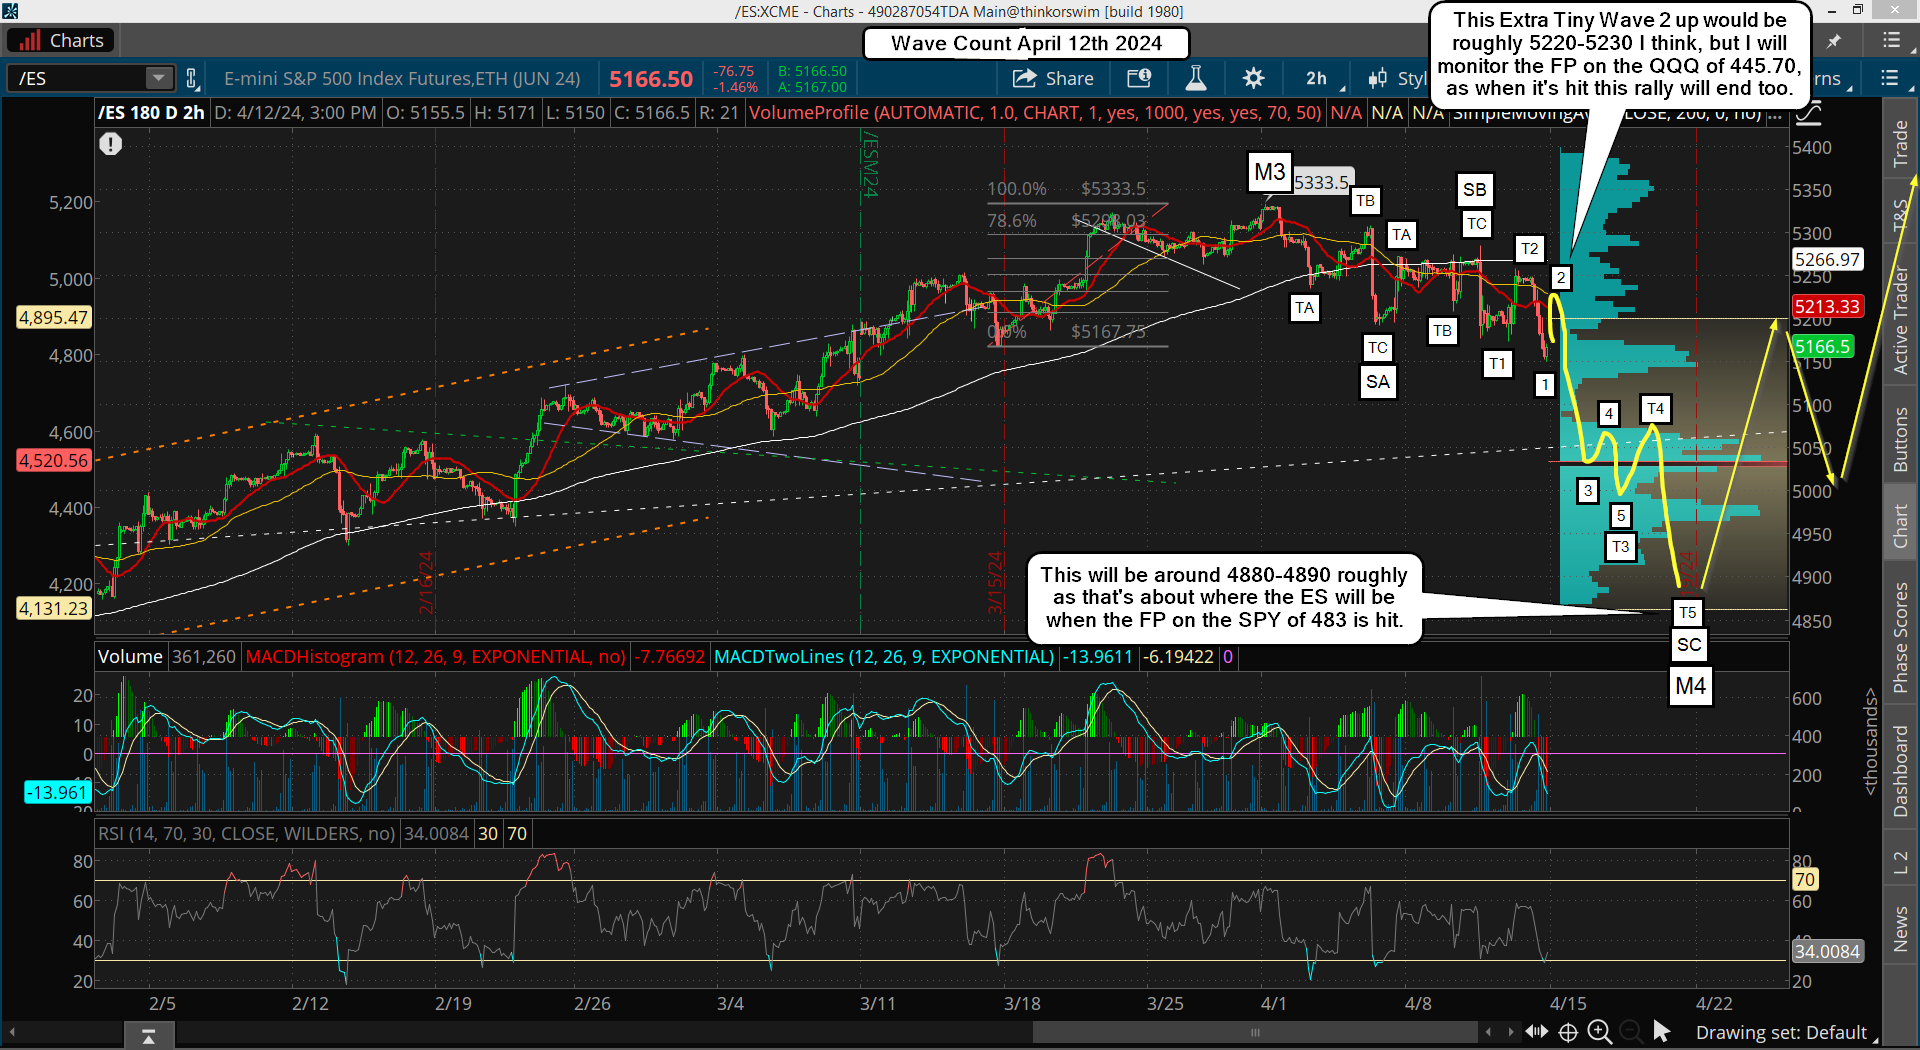
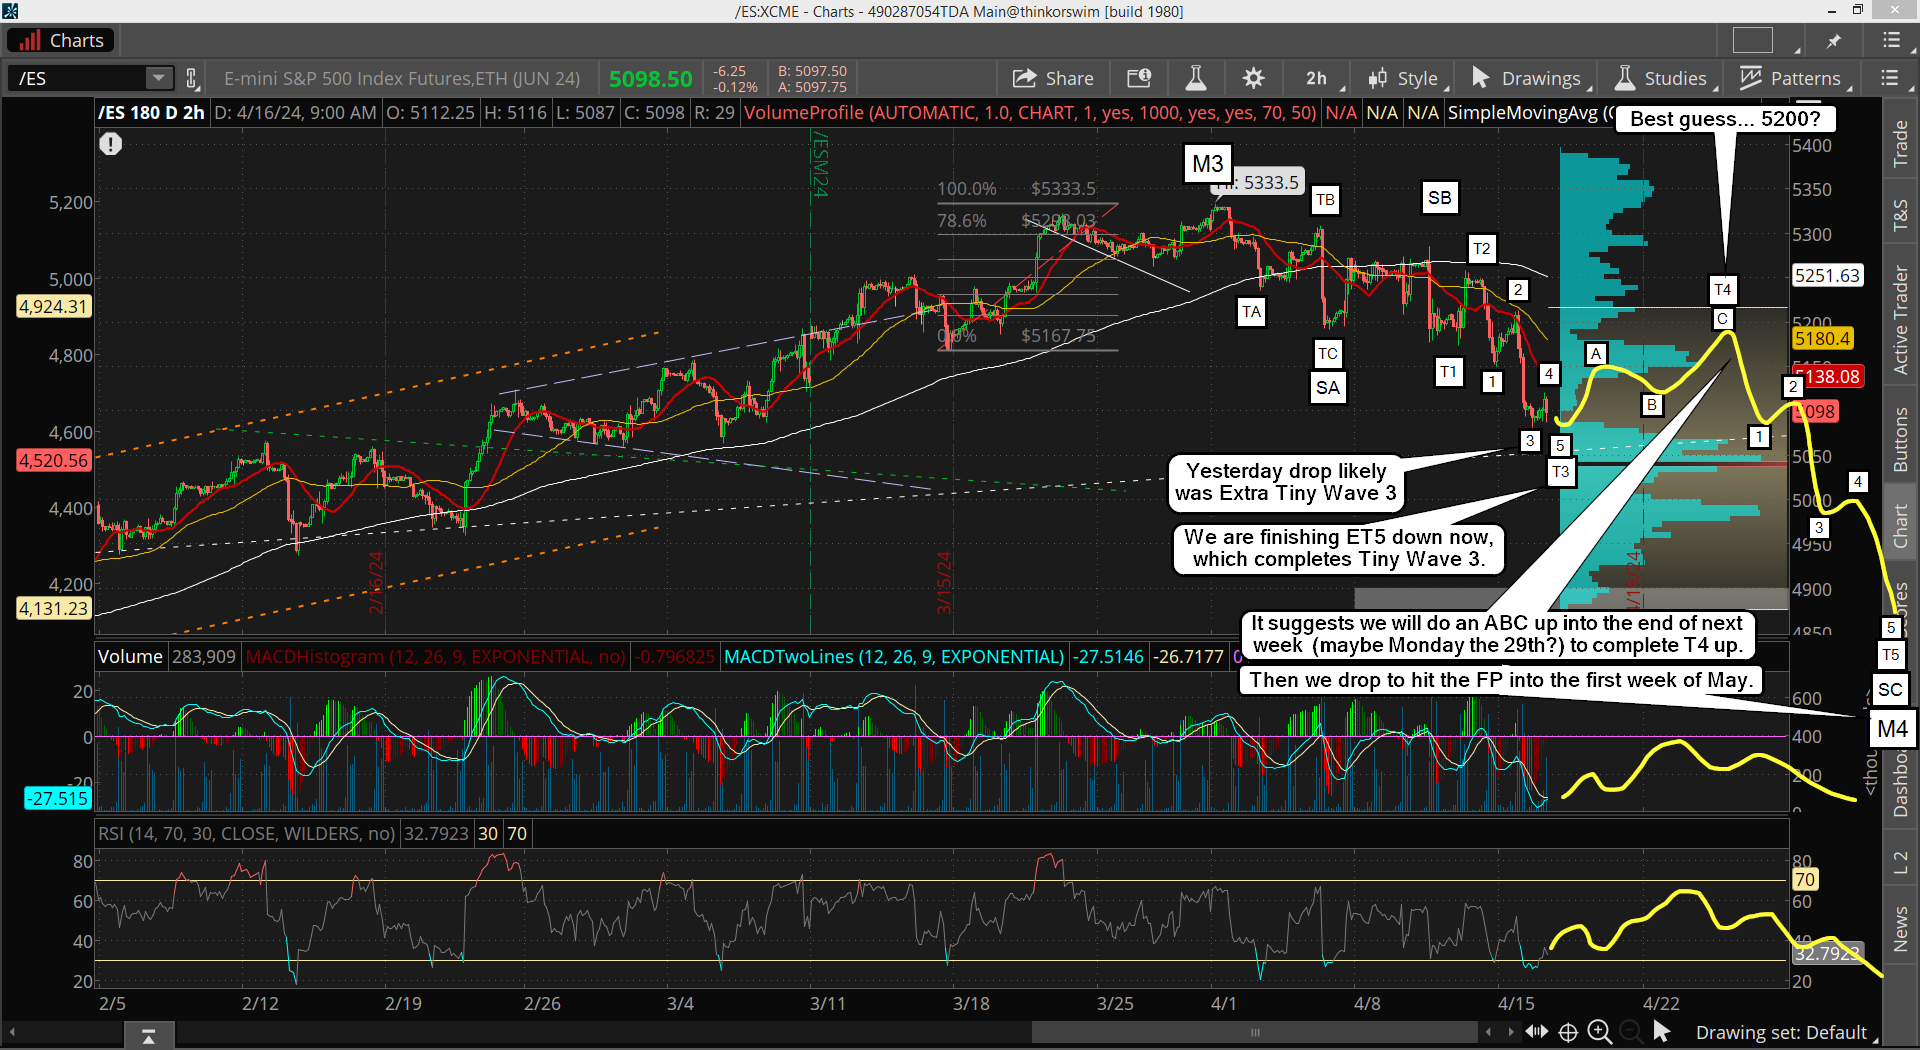
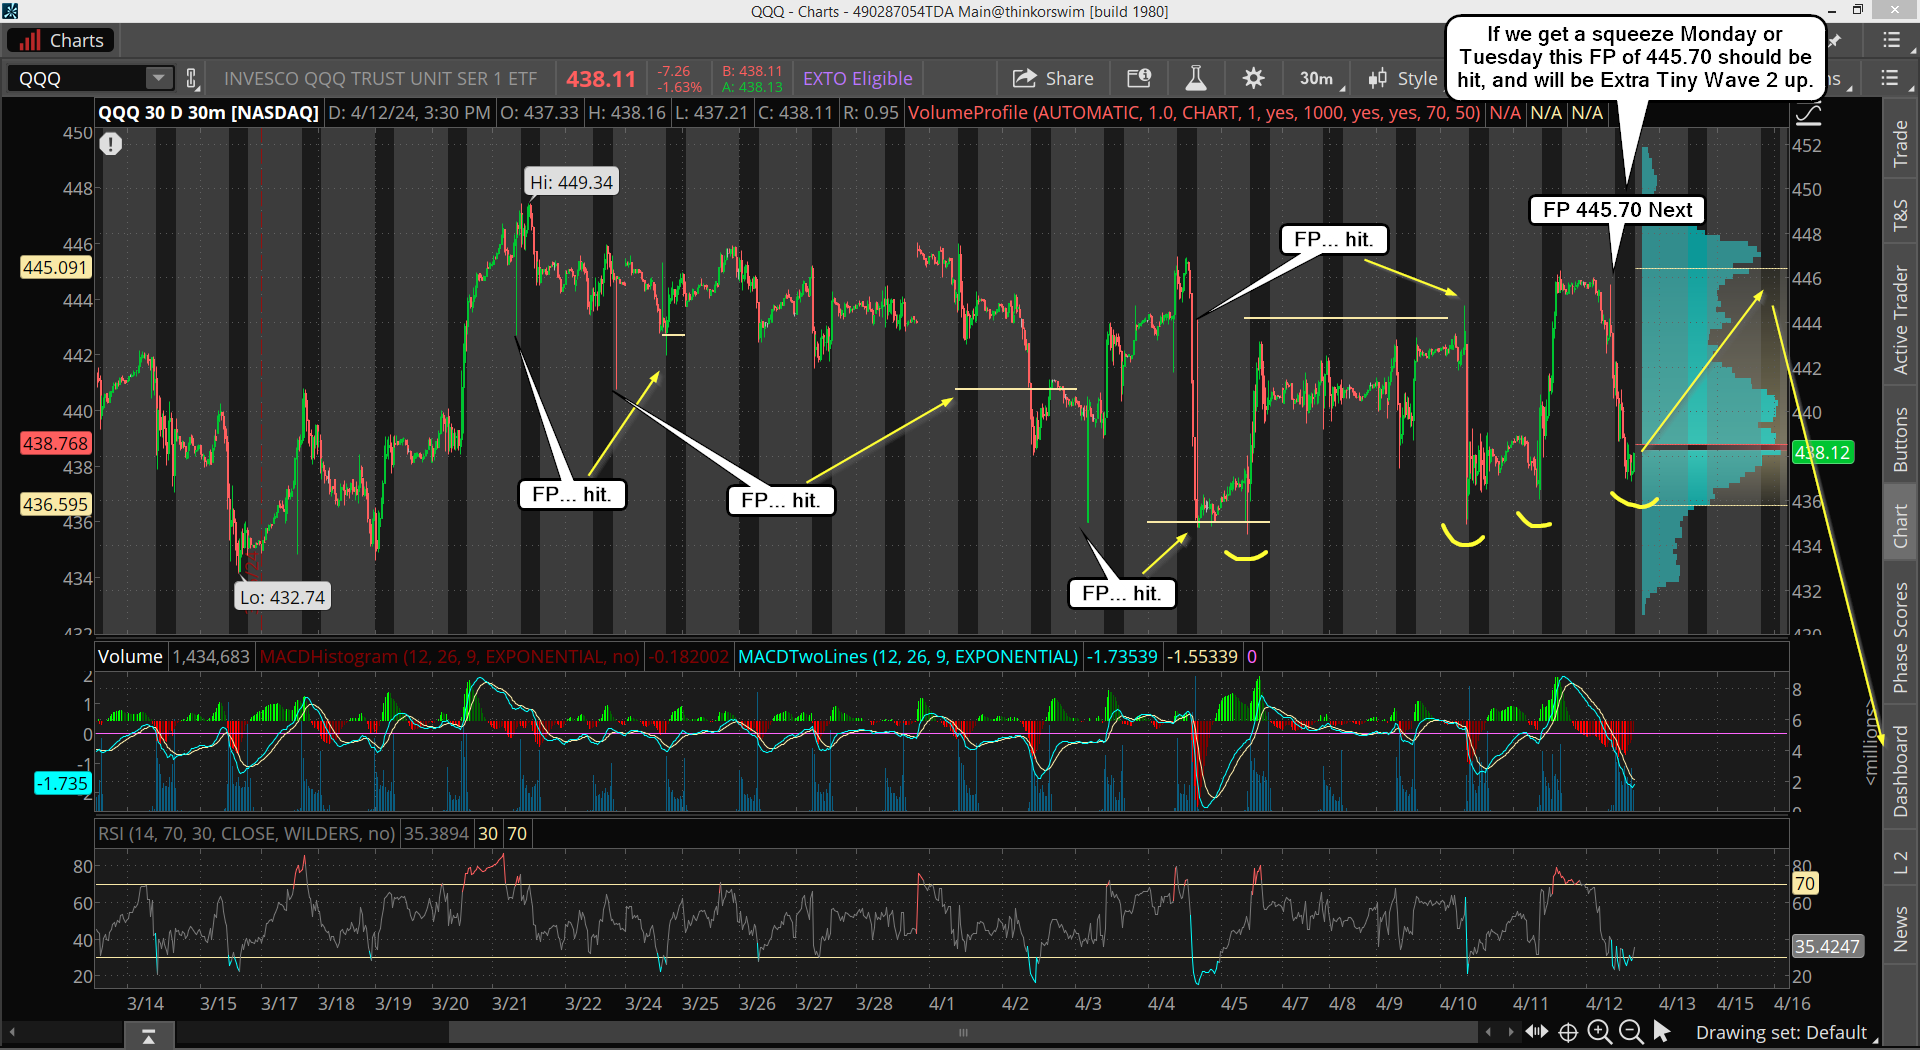
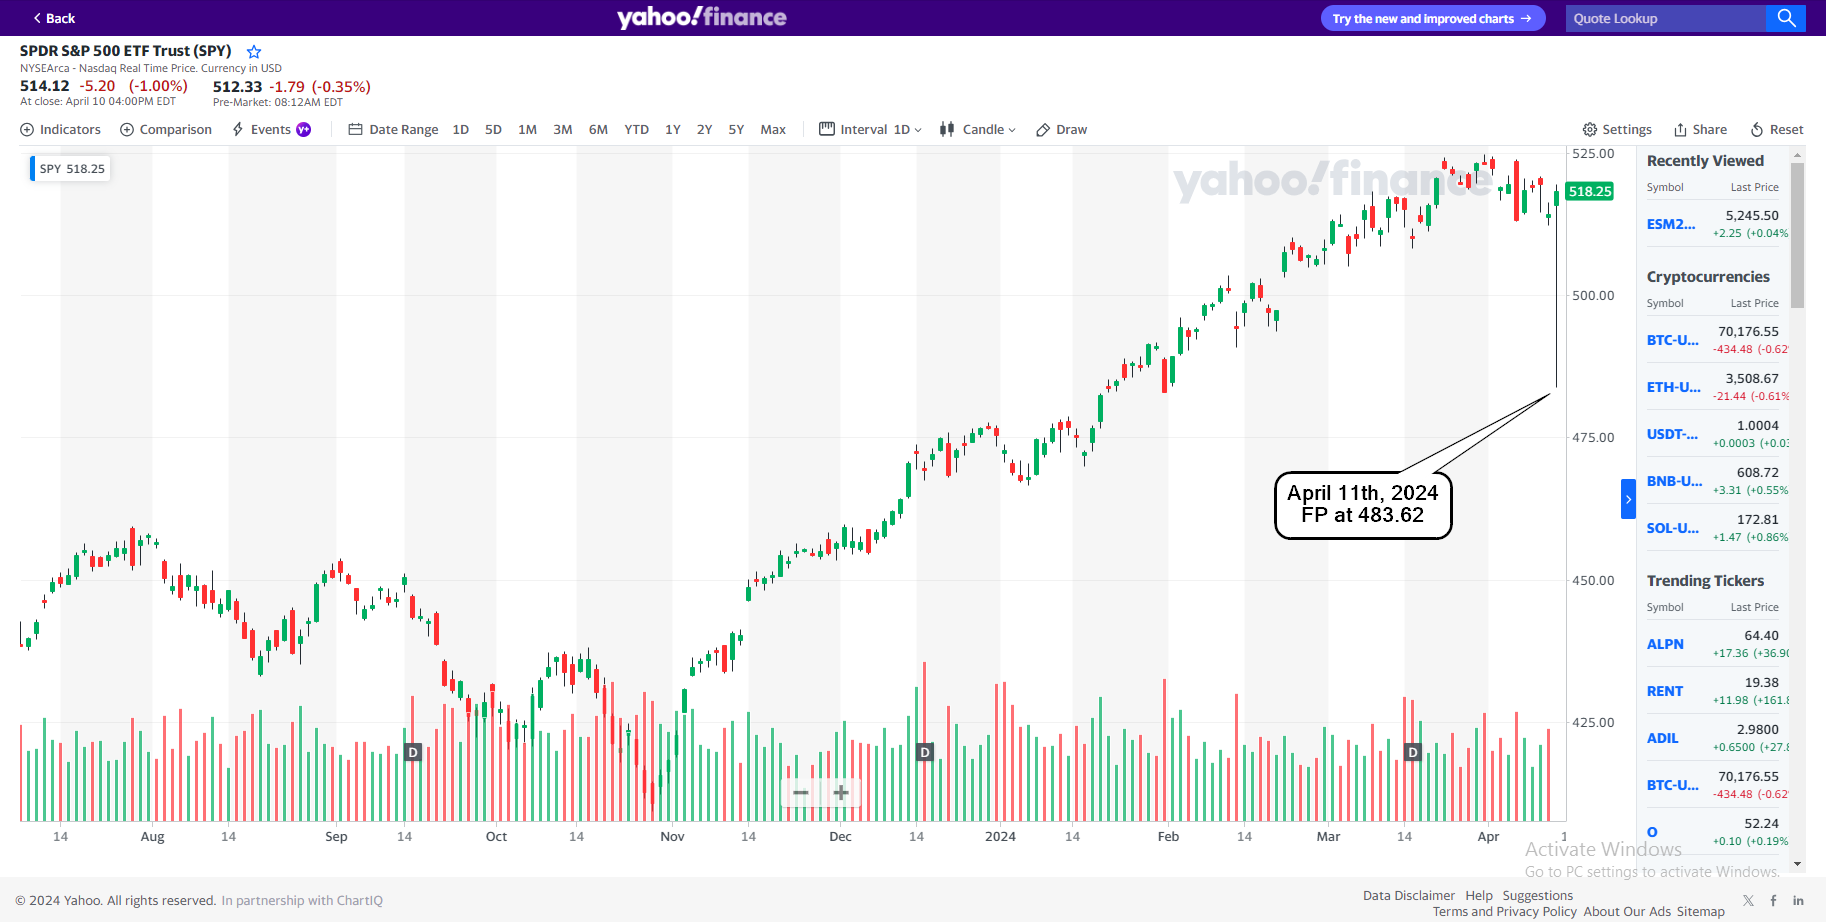
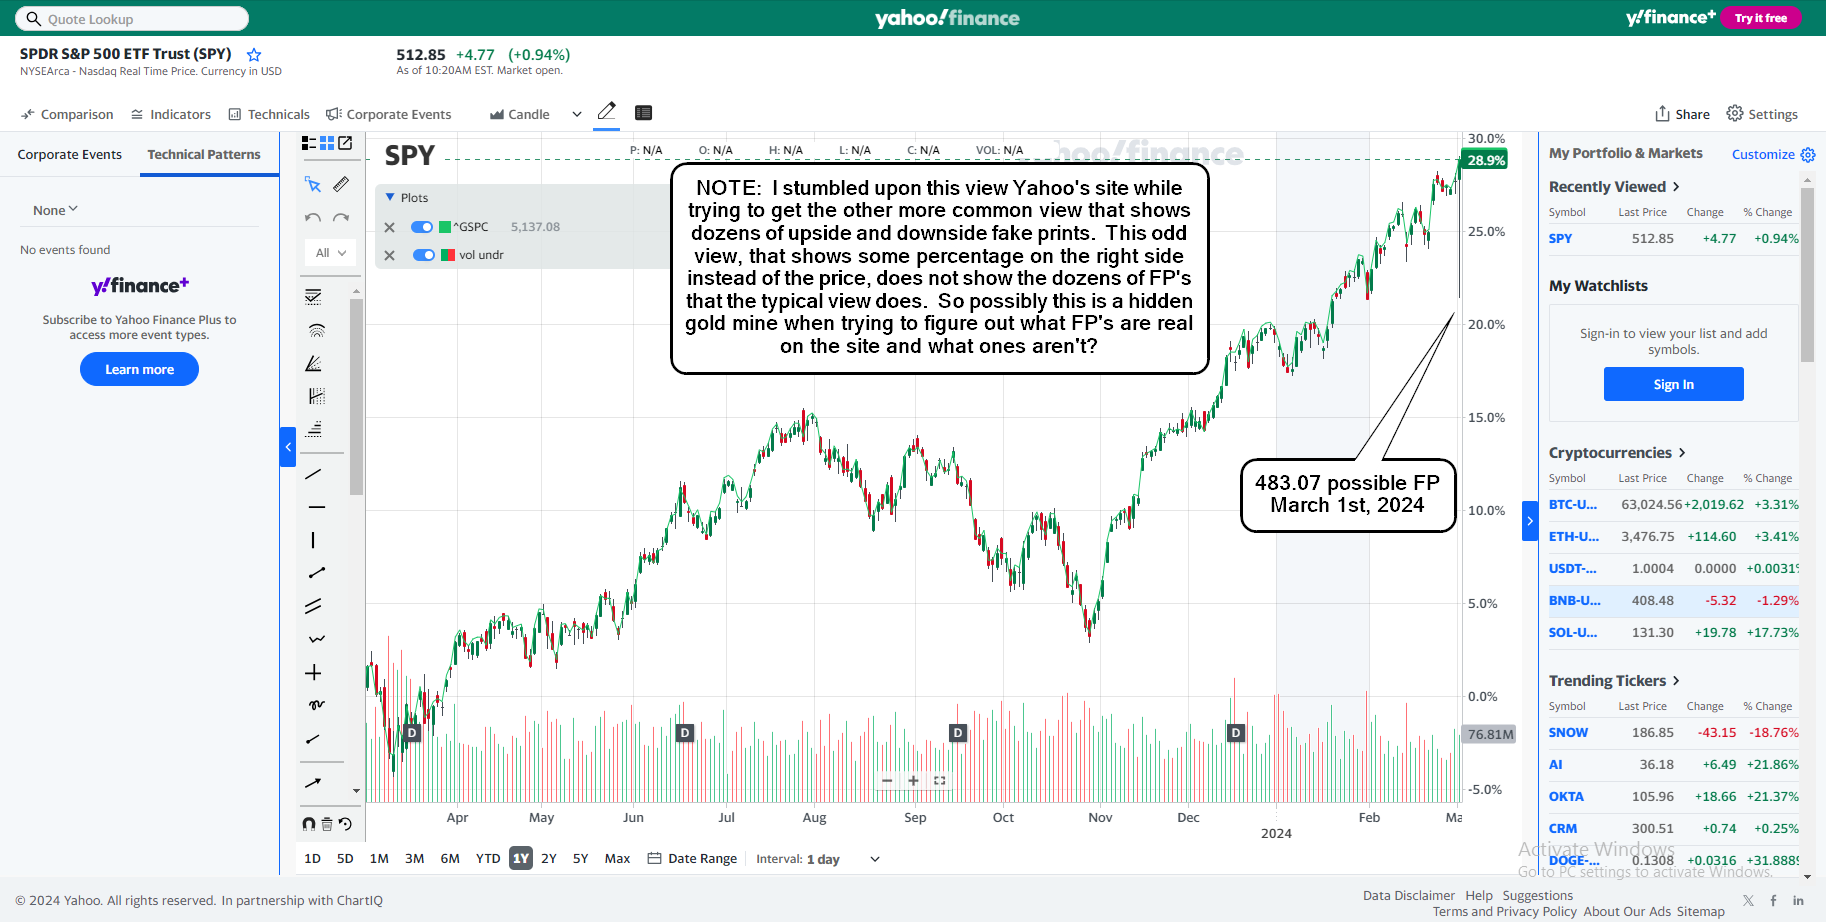
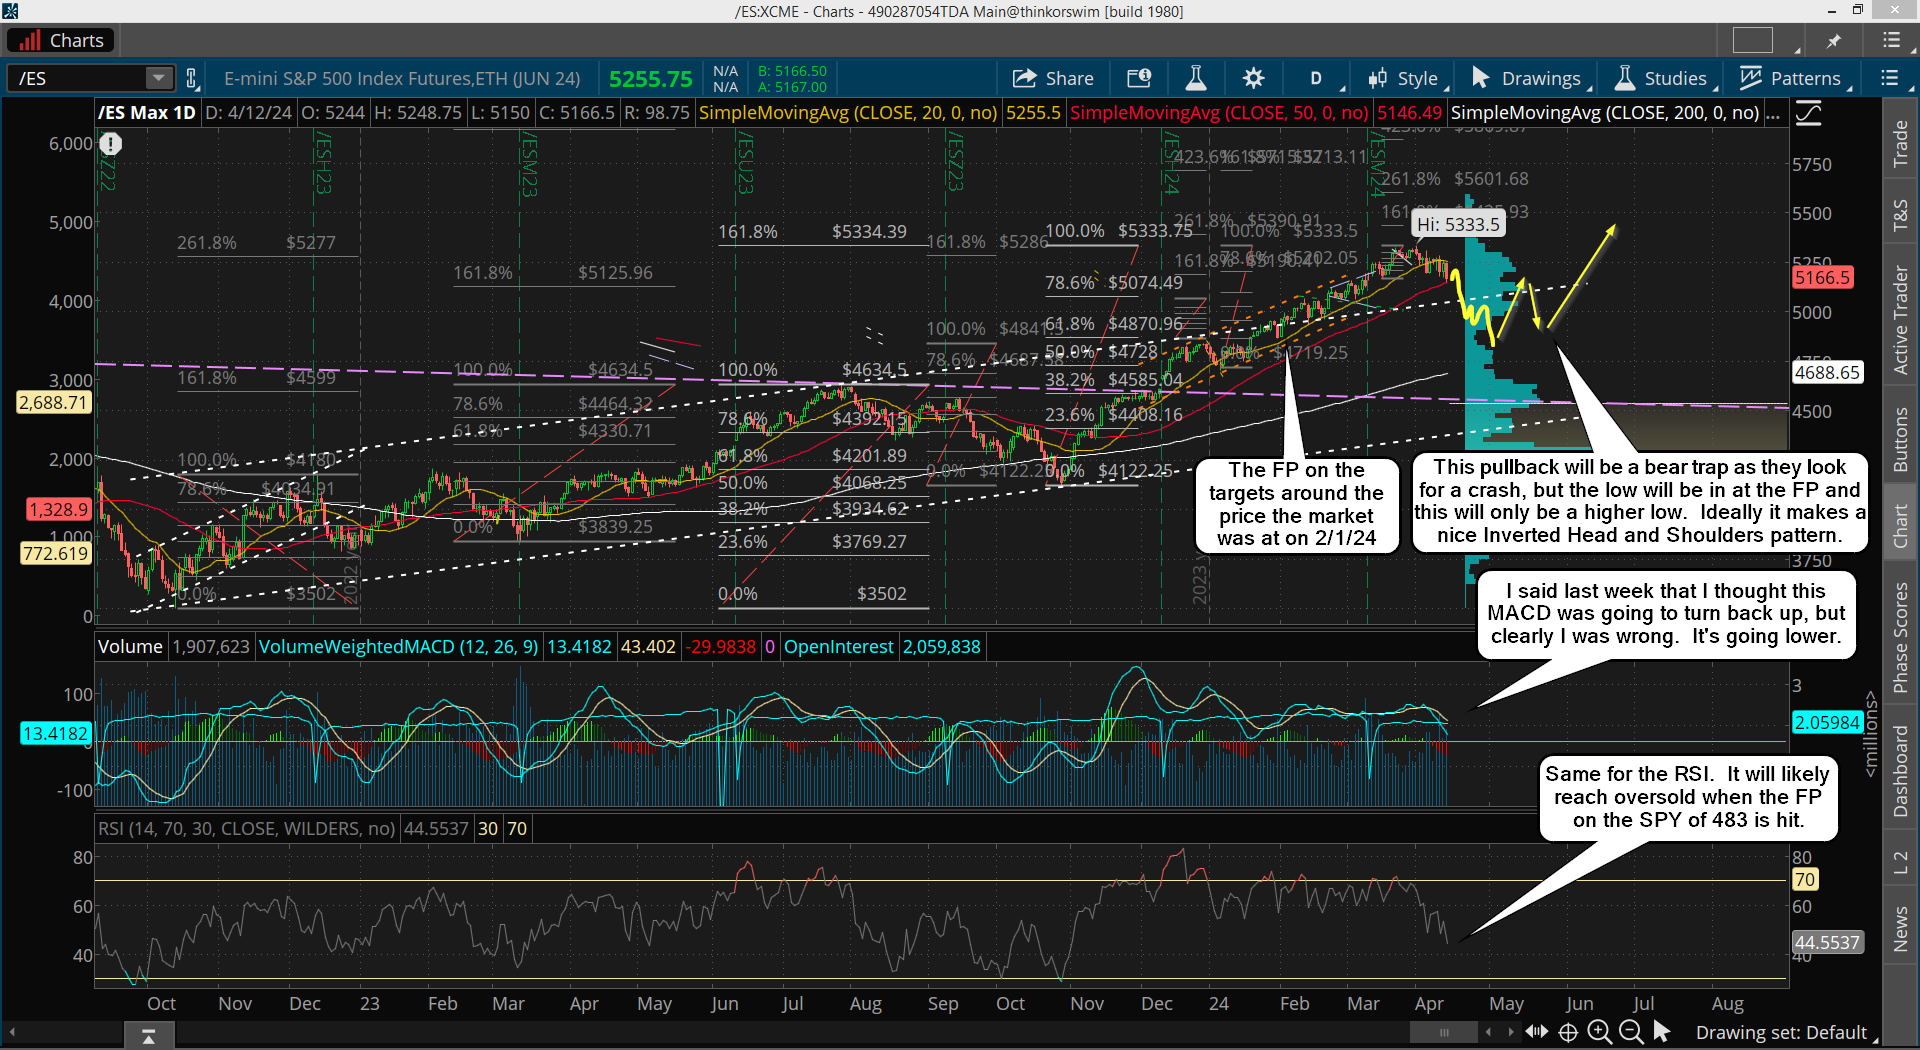
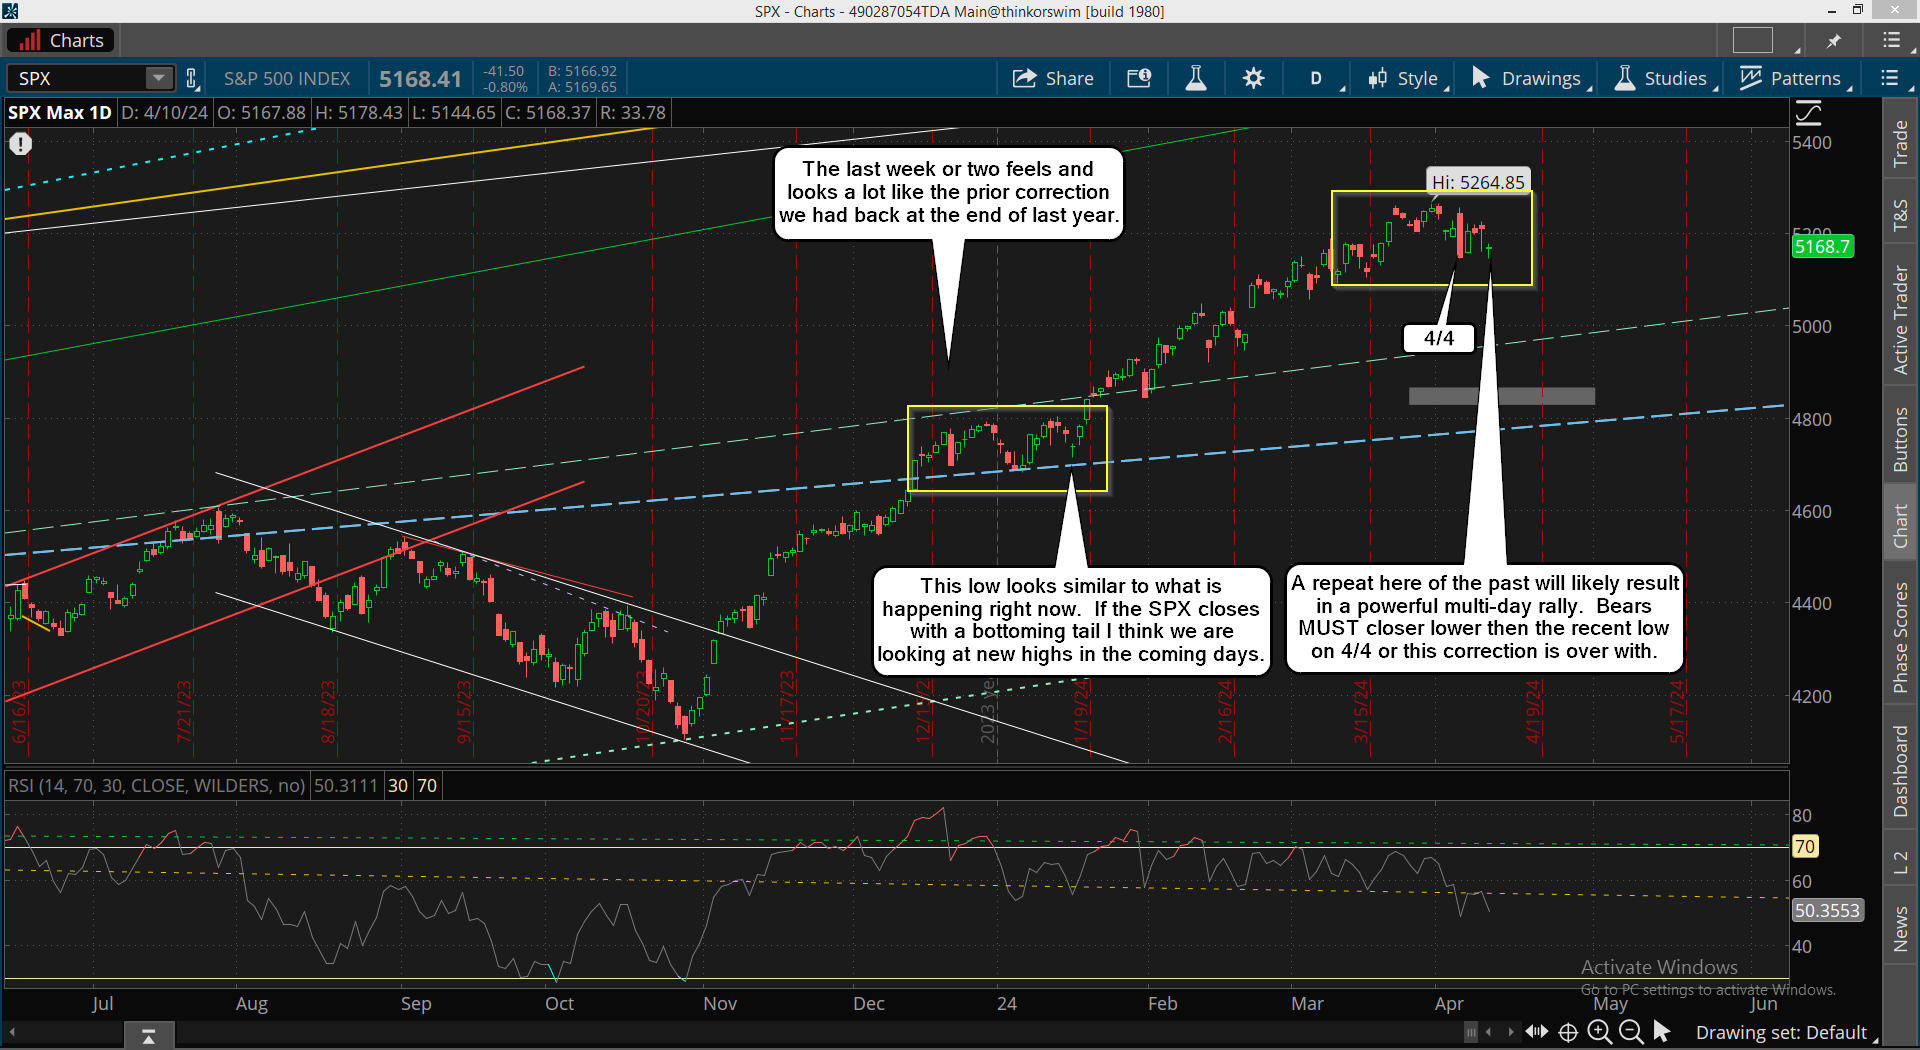
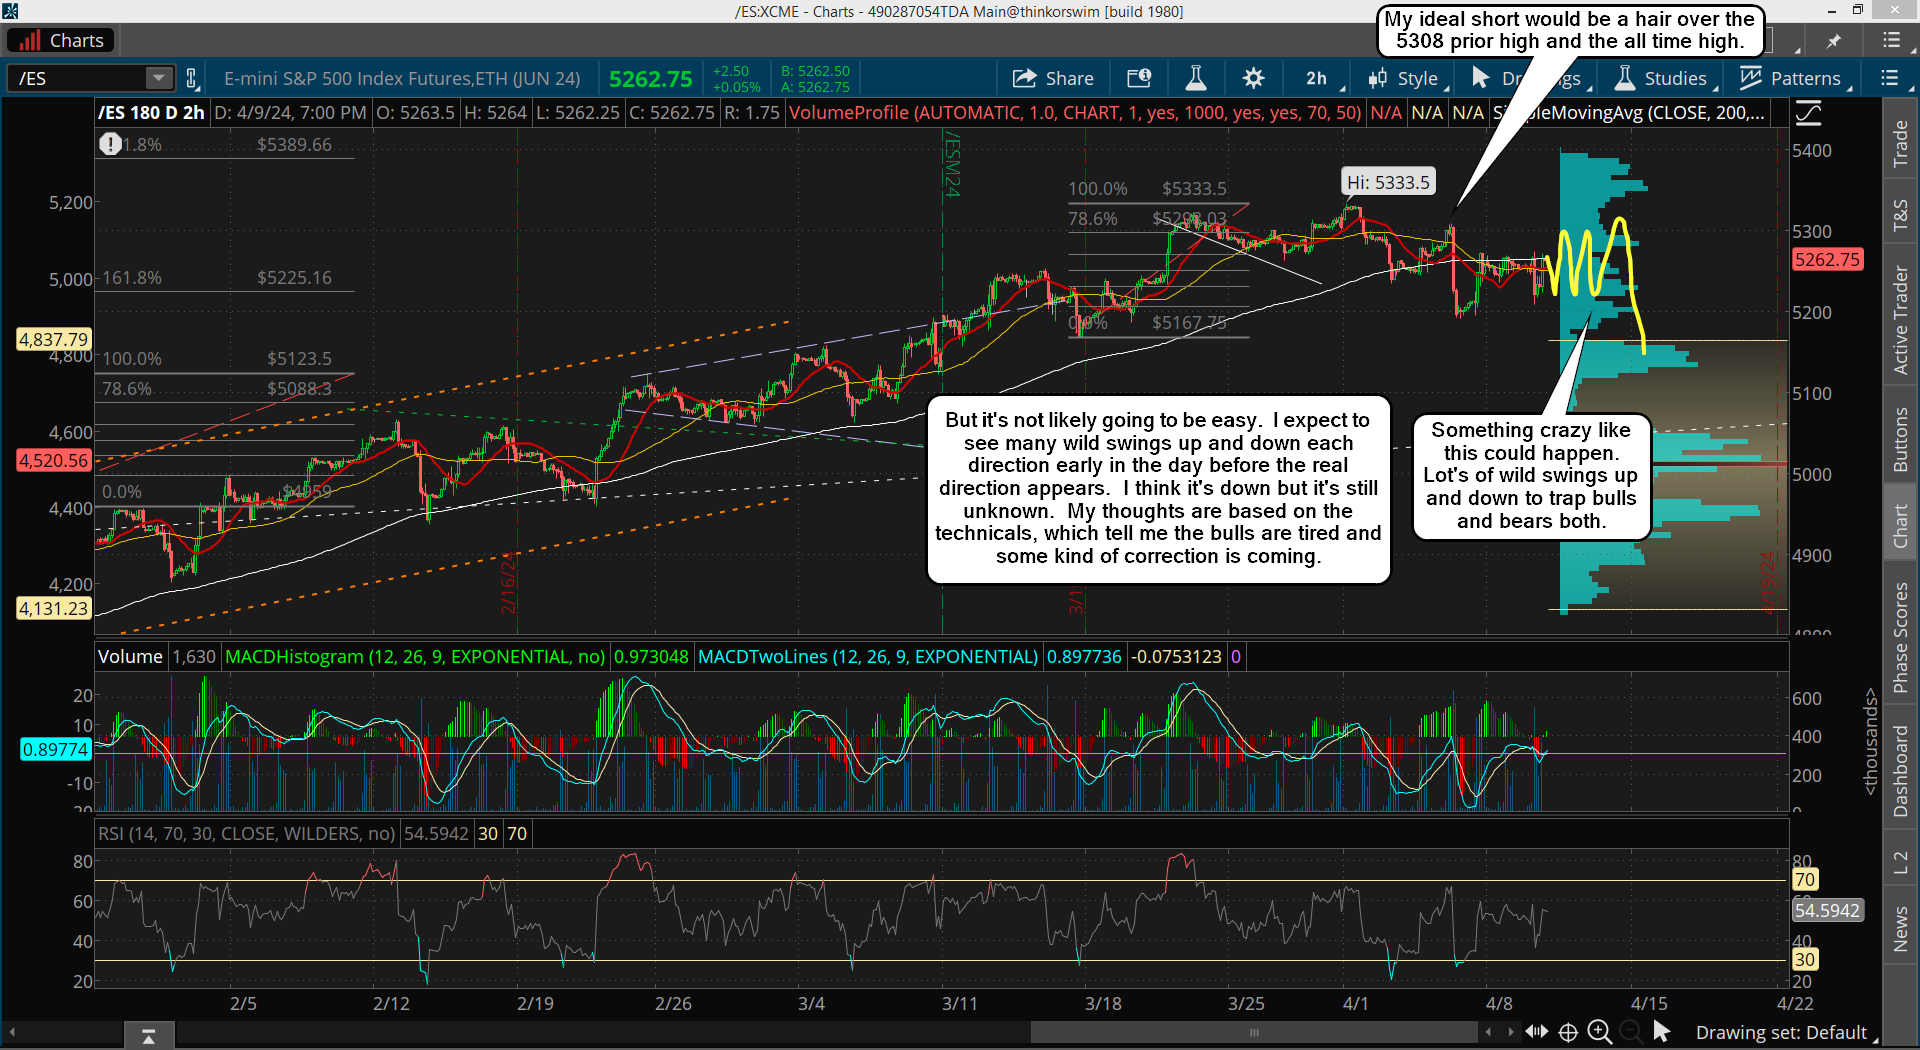
The market continues lower as we get closer and closer to the FP on the SPY. Last Thursday had a nice drop in the futures but was fully recovered by the open on Friday. However, it never held as as the market rolled back over the rest of the day. This week (possibly today or Tuesday) we should see the FP hit, and that's where I think we get a 50% retrace back up, and should complete by the end of this week or early next week.
From there is where it gets tricky as while I do think we will roll back over and go down again I just don't know how much. Will be be a higher low, meaning the move up from the FP is a wave 1 of some degree and the pullback is a wave 2?
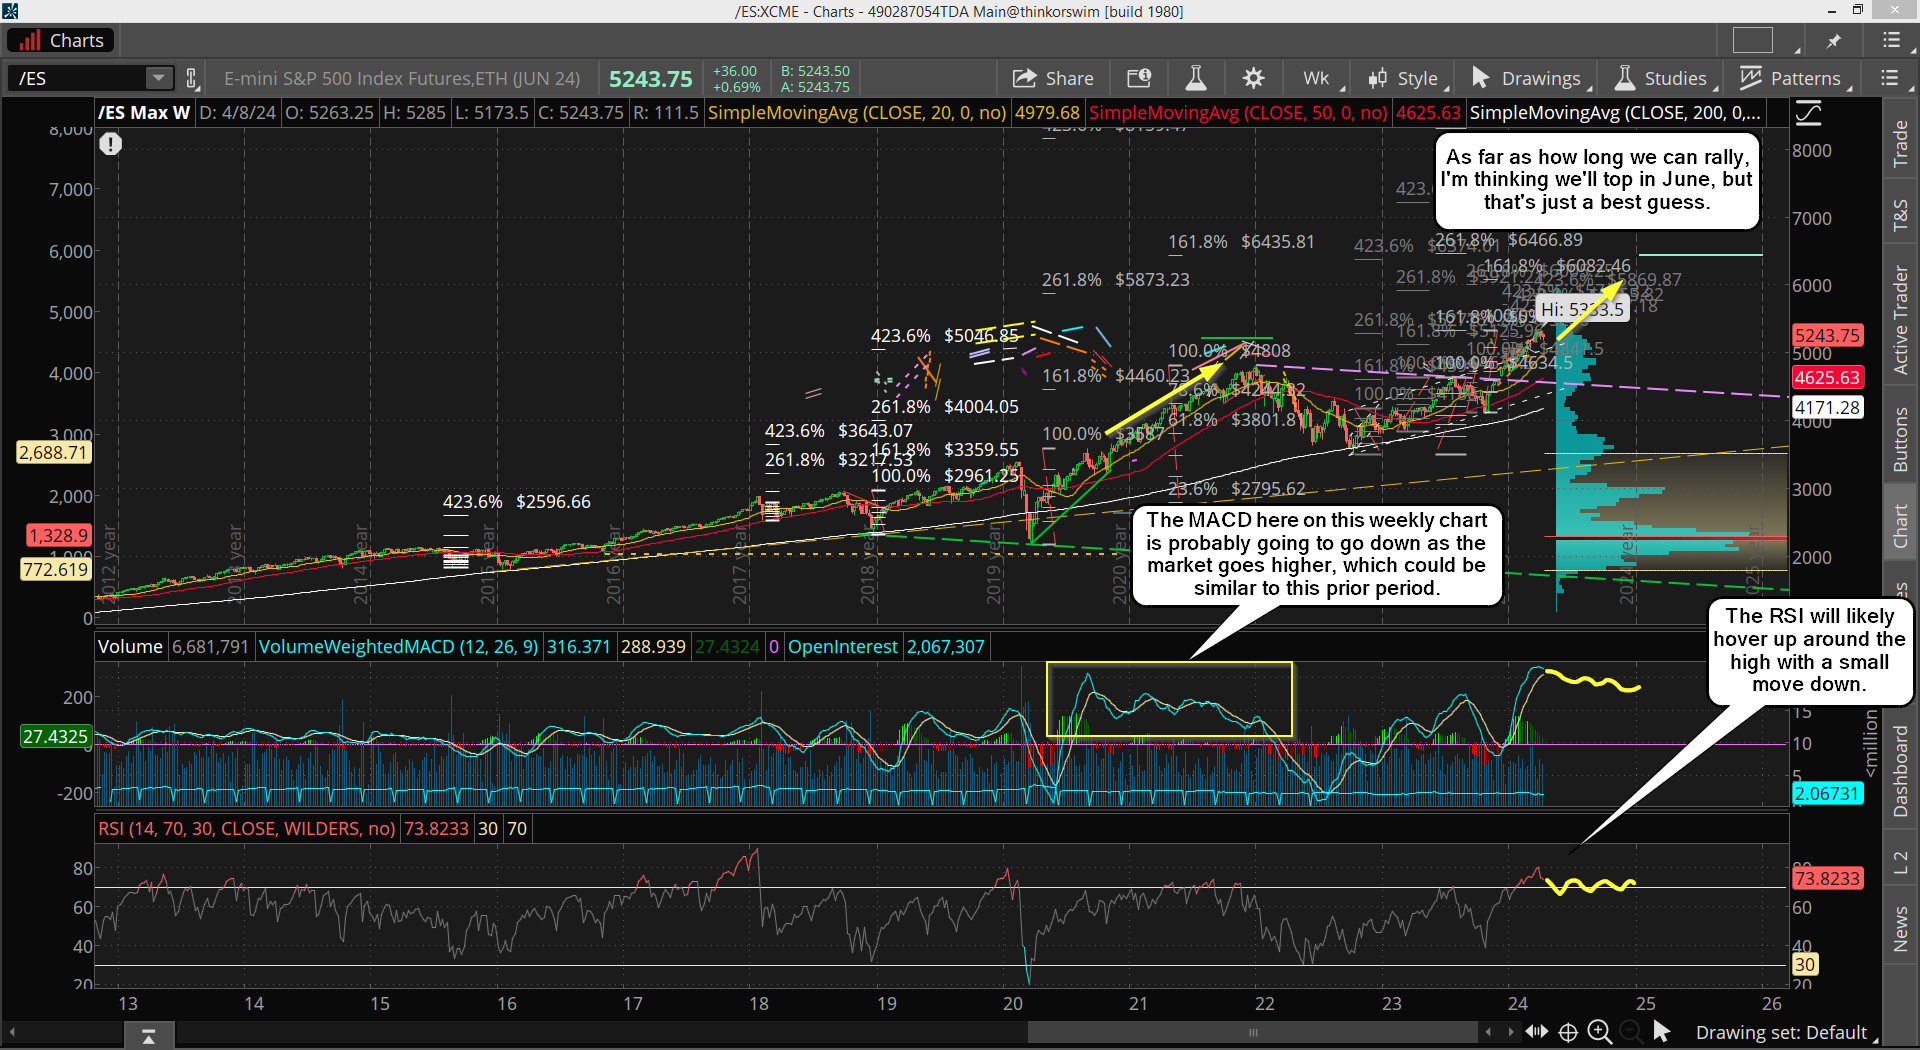
Or will it be a lower low, meaning the drop from the all time high to the FP is just an A wave and the bounce of 50% is a B wave, so the drop after that would be a C wave. I don't know the answer but looking at the technicals on the weekly chart I'd have to lean toward the ABC as it's quite bearish, so I don't see the market just resuming the non-stop rally yet.
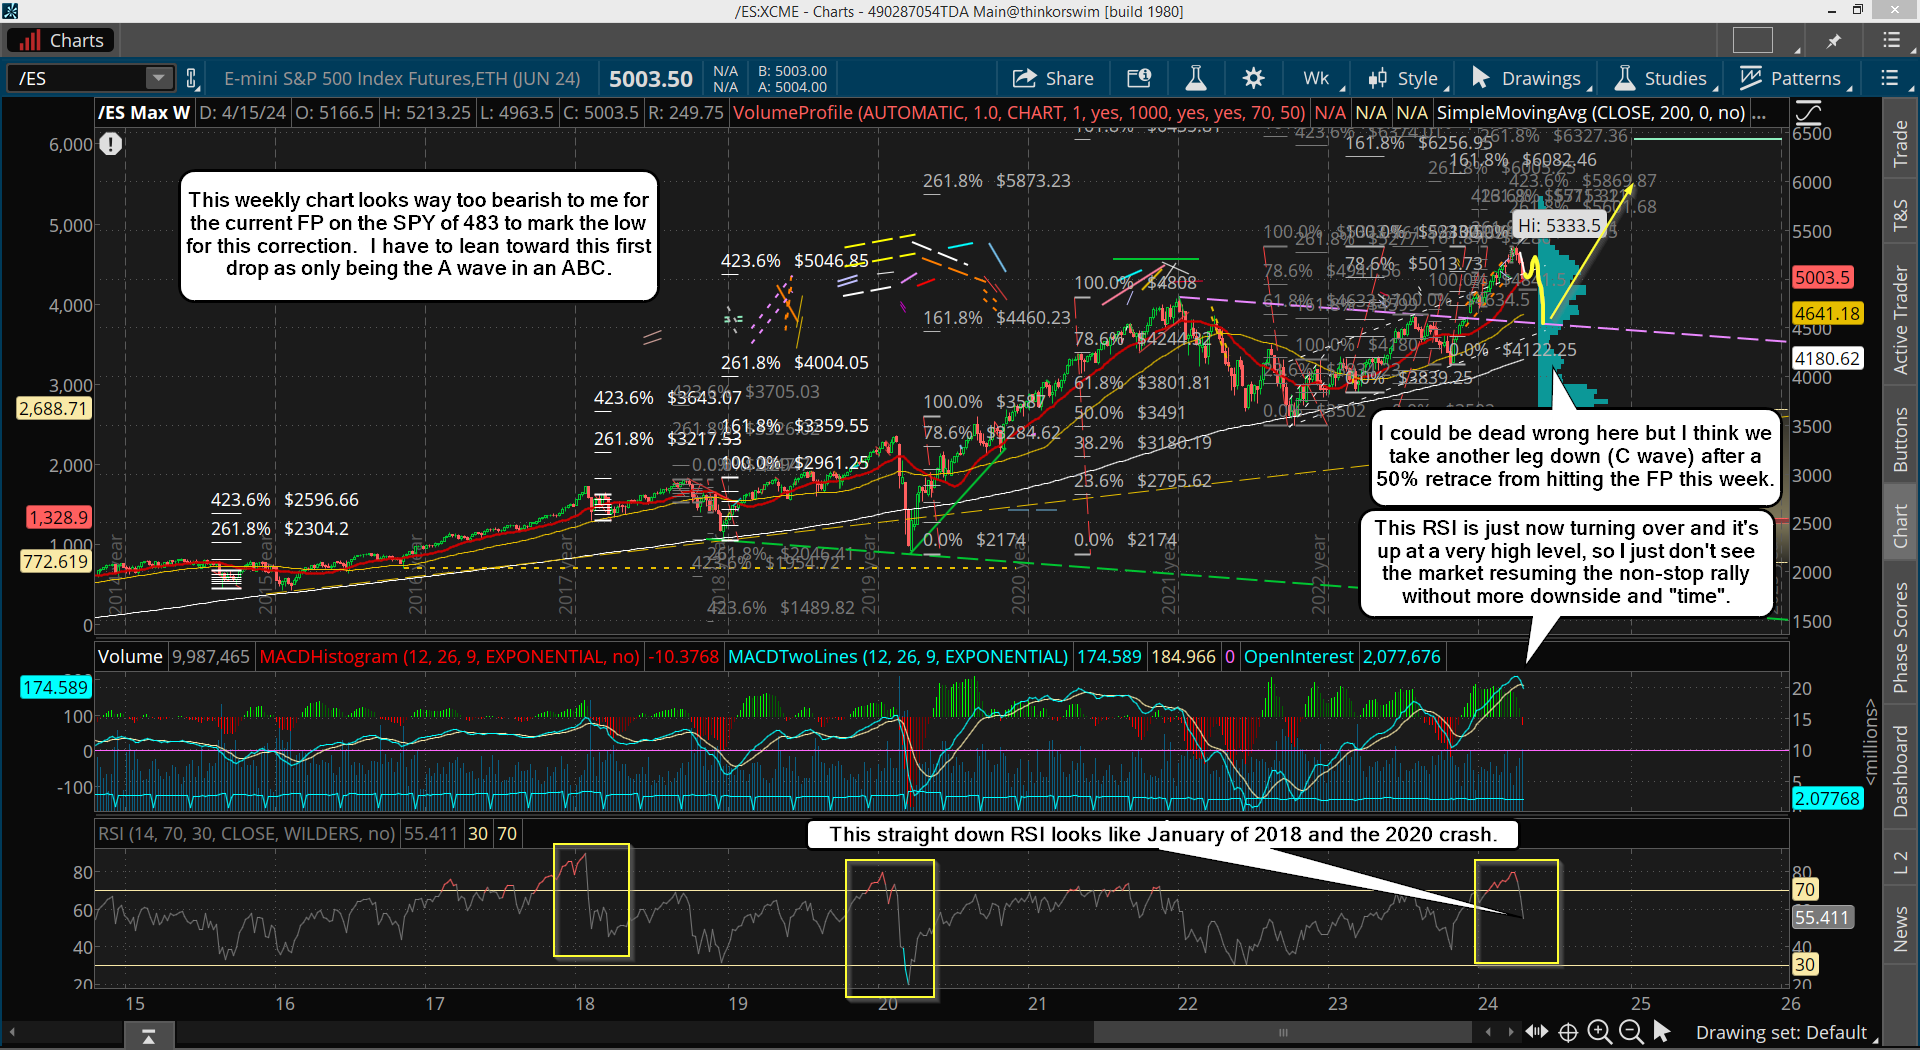
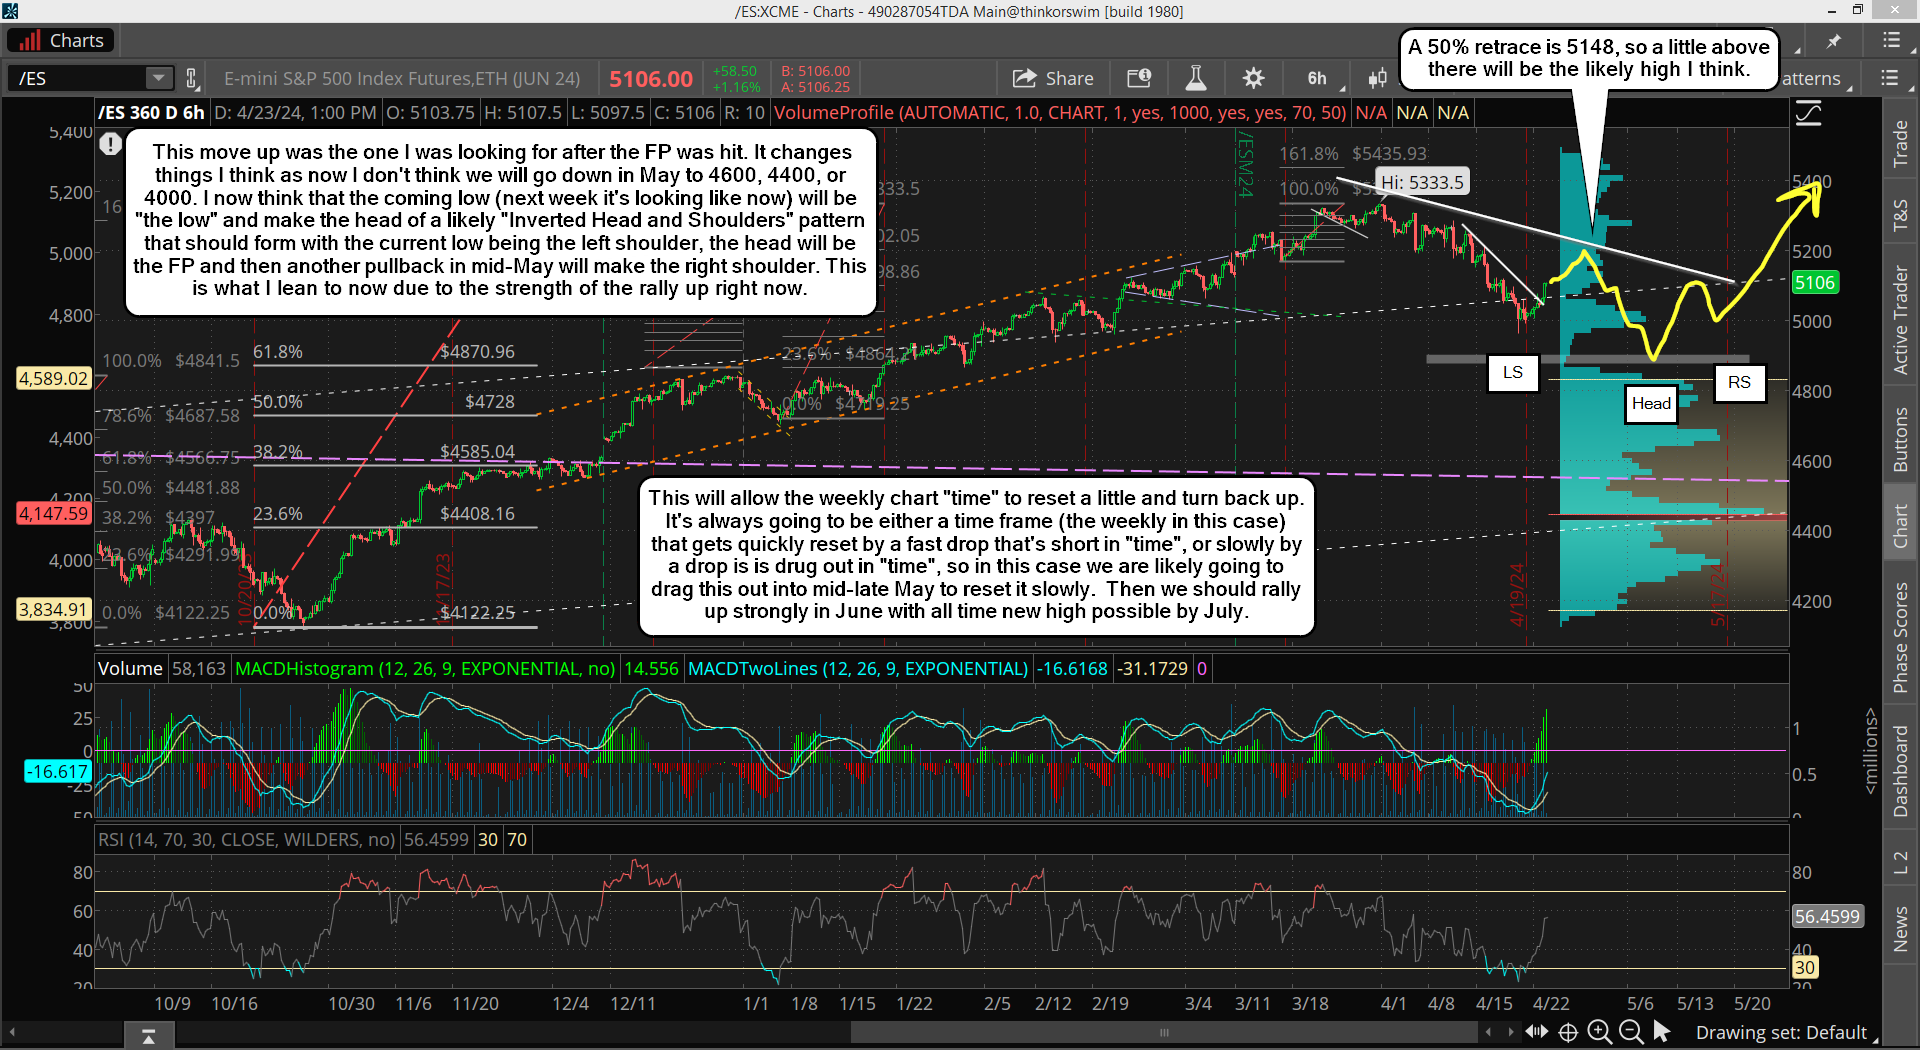
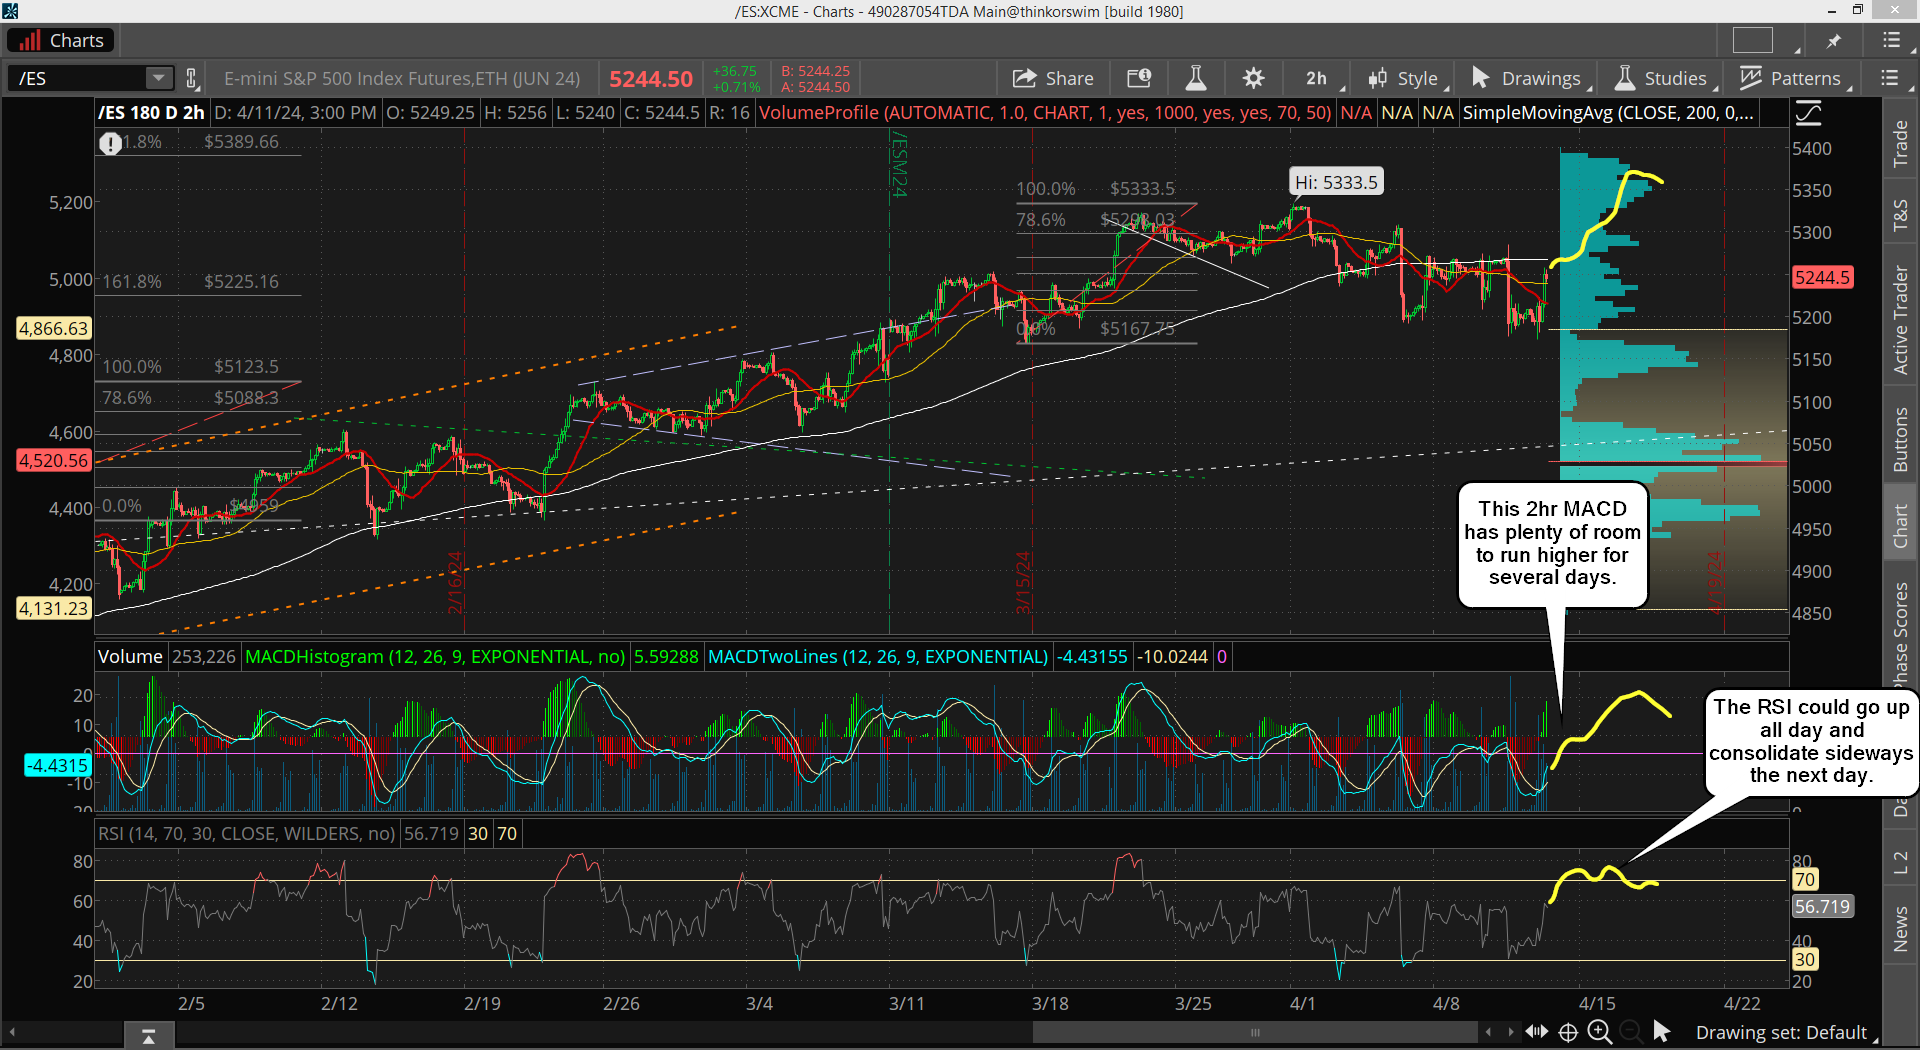
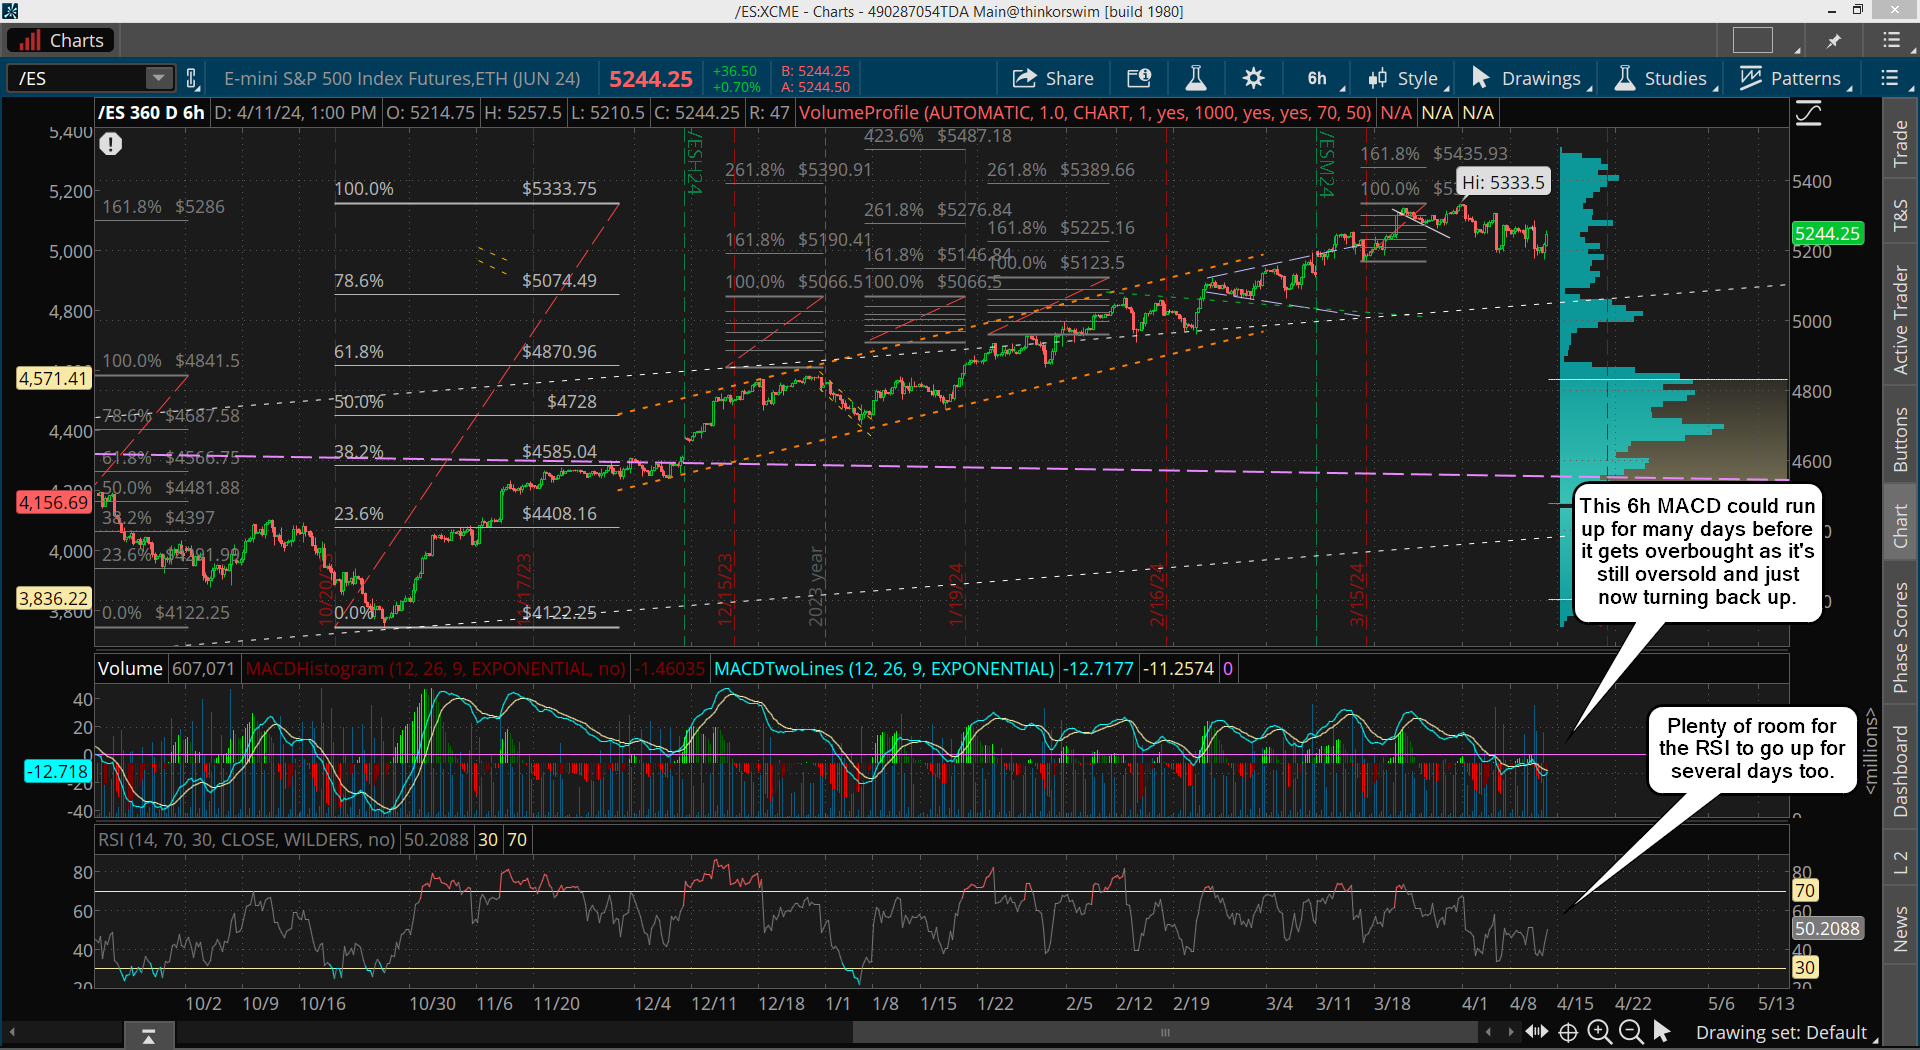
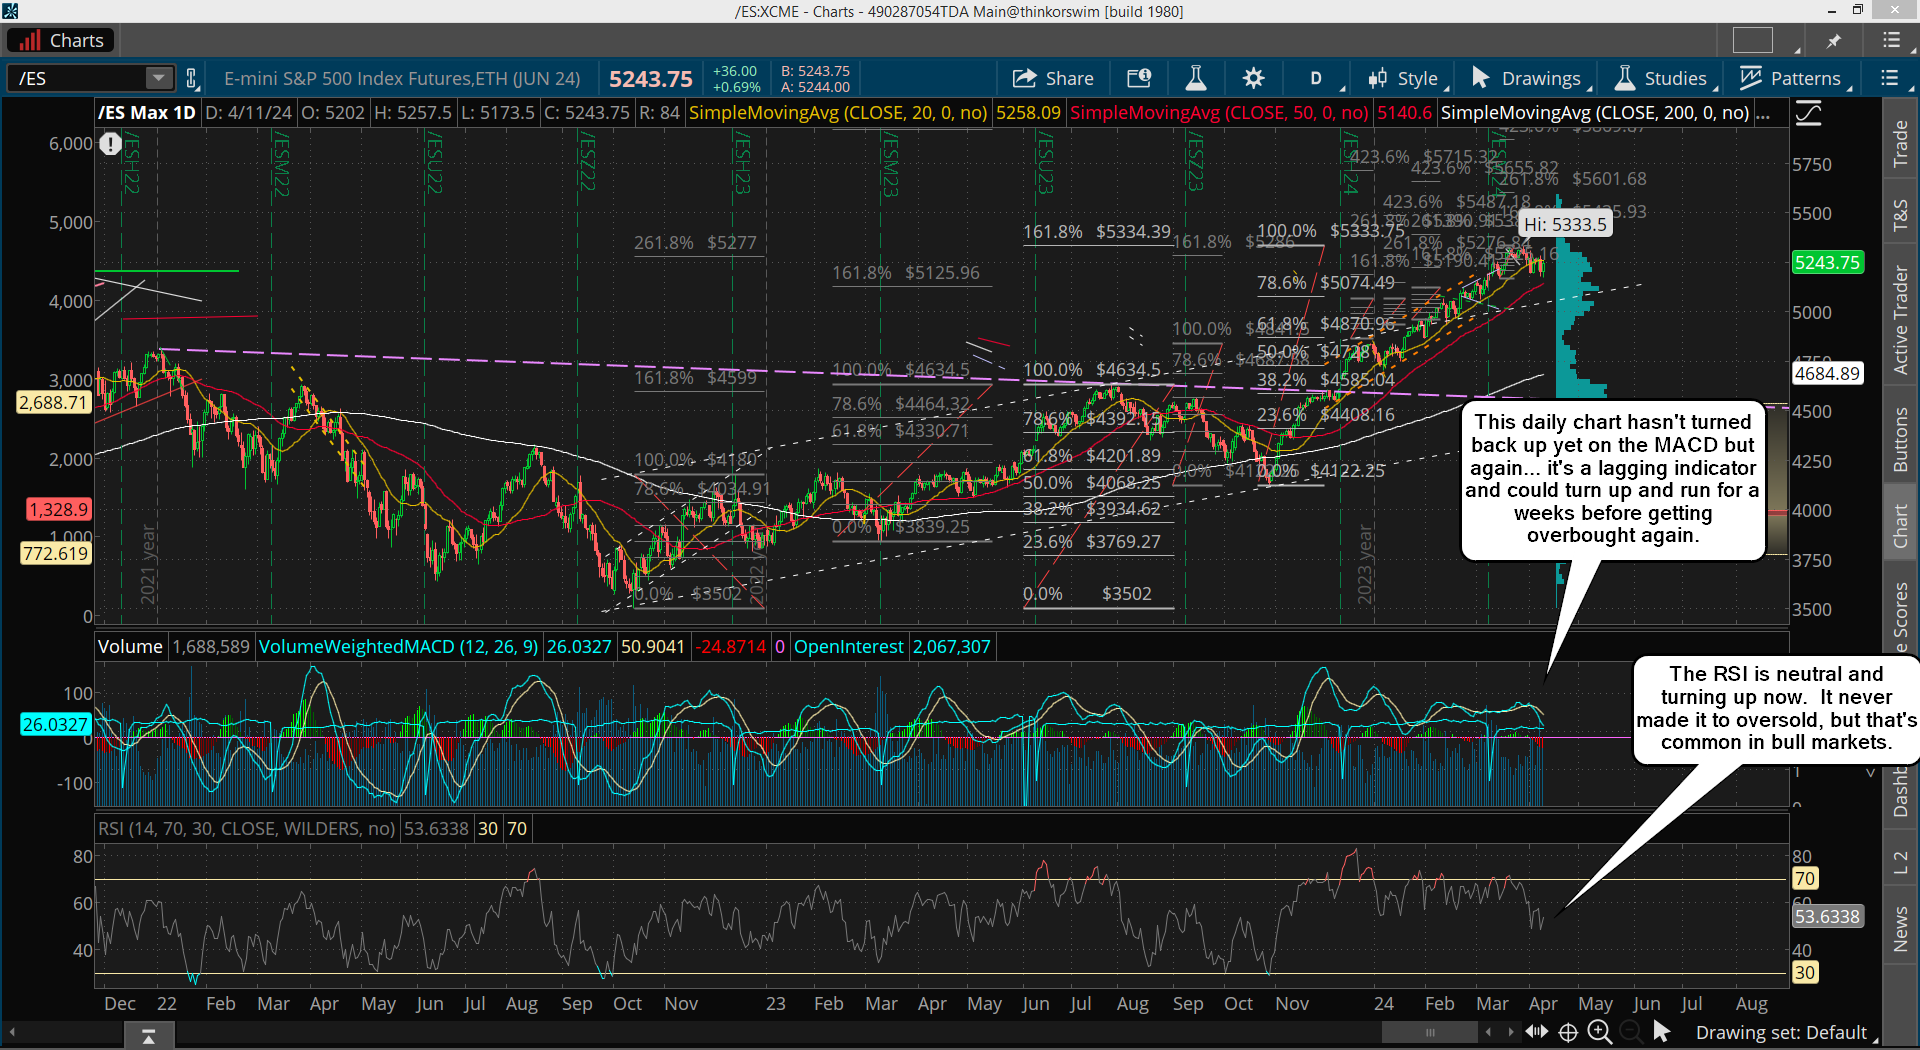
More time is needed to allow the weekly chart to reset as it will need to turn back up and support the daily chart to get that day after day grind going again. Yes, the daily is almost oversold and will turn back up after the FP on the SPY is hit, but the weekly is more powerful and will keep downward pressure on the daily, so rallies will not "stick" in my opinion.
My best guess is that the weekly chart will need 3-4 more weeks of "time" to get it deep enough to bottom and turn back up. Basically the first, second, or possibly the third week of May should about finish it. Of course if the price is deep enough then we could be finished in the first week, but if price isn't that deep then it might last into the third week.
For example, if we dropped to 4000 then it should finish in the first week, but if we only drop to 4800 then I'd say the third week would be needed. This is on the second leg down of course, which will be the C wave. The 4800 zone will be support as the high in 2022 was 4808 on the ES (4818 SPX), so if the market wants to stop there then I'd have to think there will be a lot of up's and down's from that zone before we get going back up strongly in a real rally... meaning late May to early June before it starts.
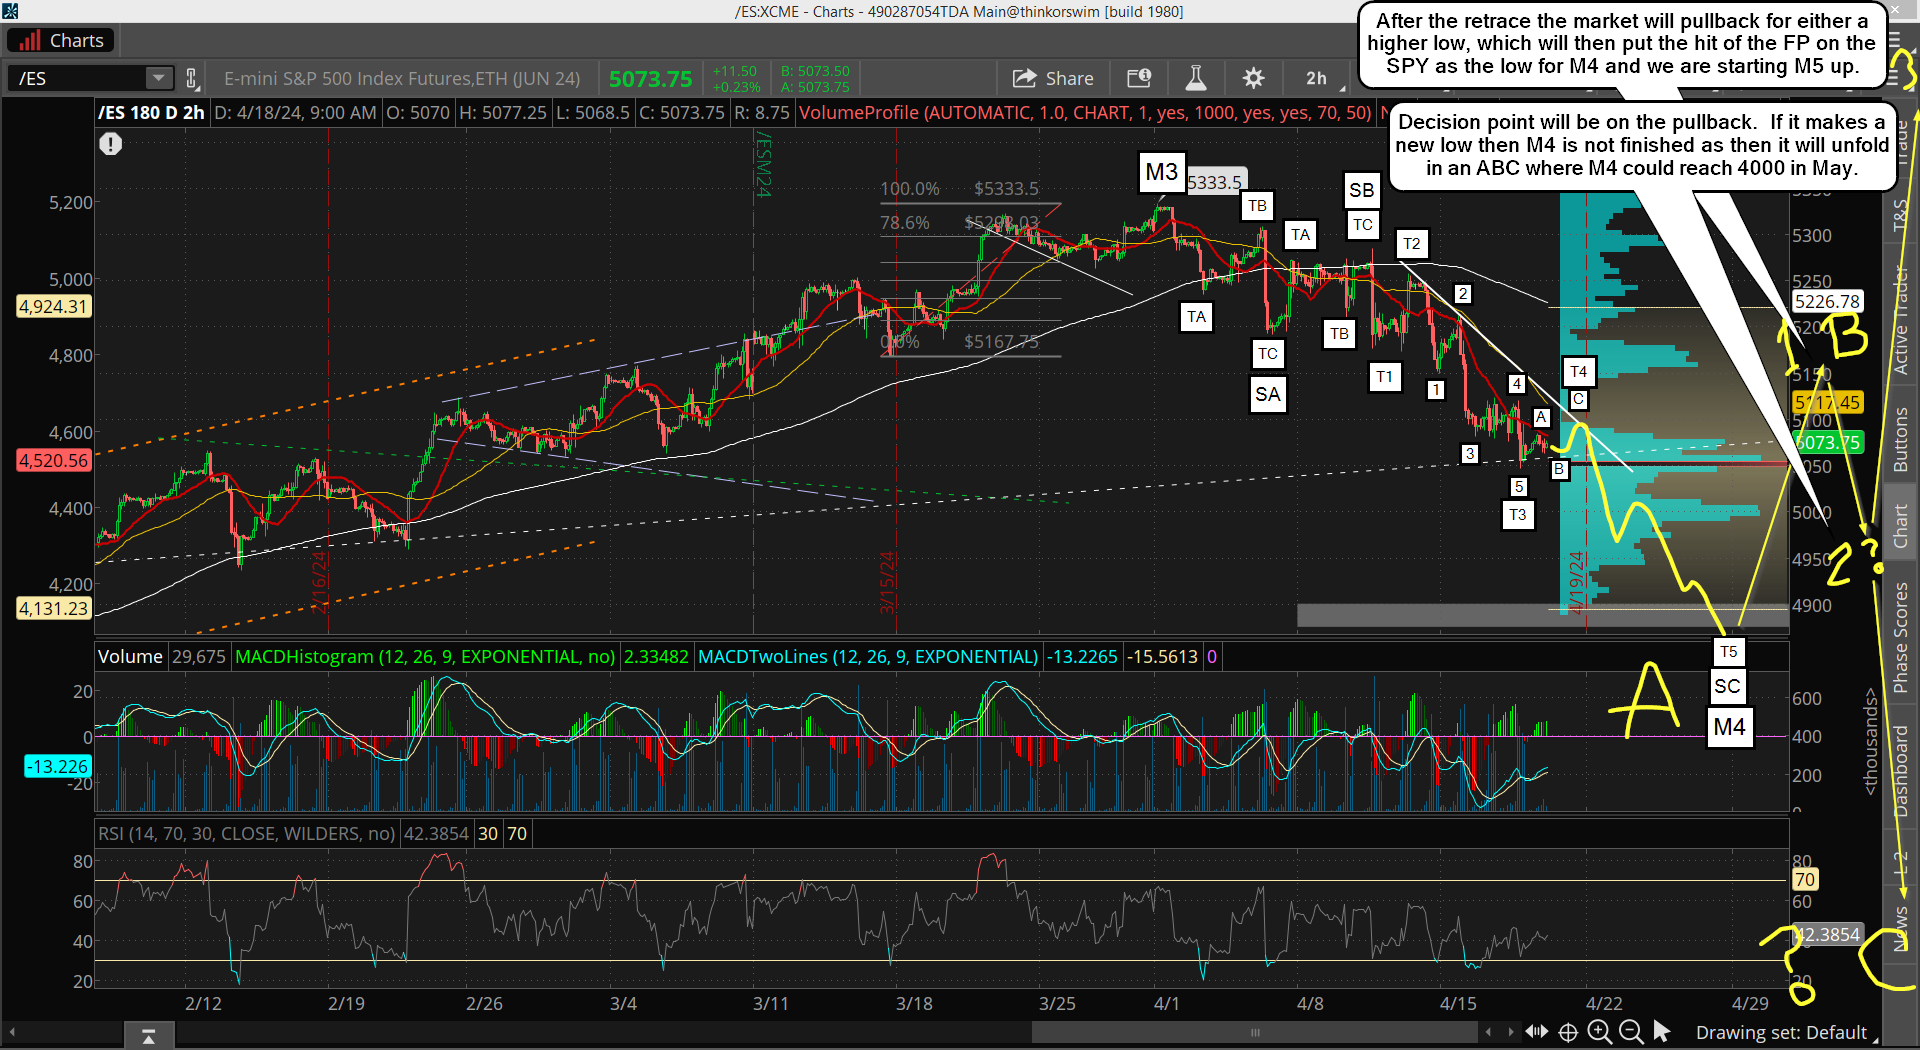
But if we drop to the 200 week moving average at just under 4200 then the weekly chart will be quite oversold and the correction will end sooner, as well as the rally back up from it will be faster and more powerful. Again, I don't know the target low but when I reverse my Fibonacci Extension Target system to forecast a downside projection it points to roughly the 4600 zone on the ES and SPX, but I've not used it for downside targets so I don't know if that will be accurate or not?
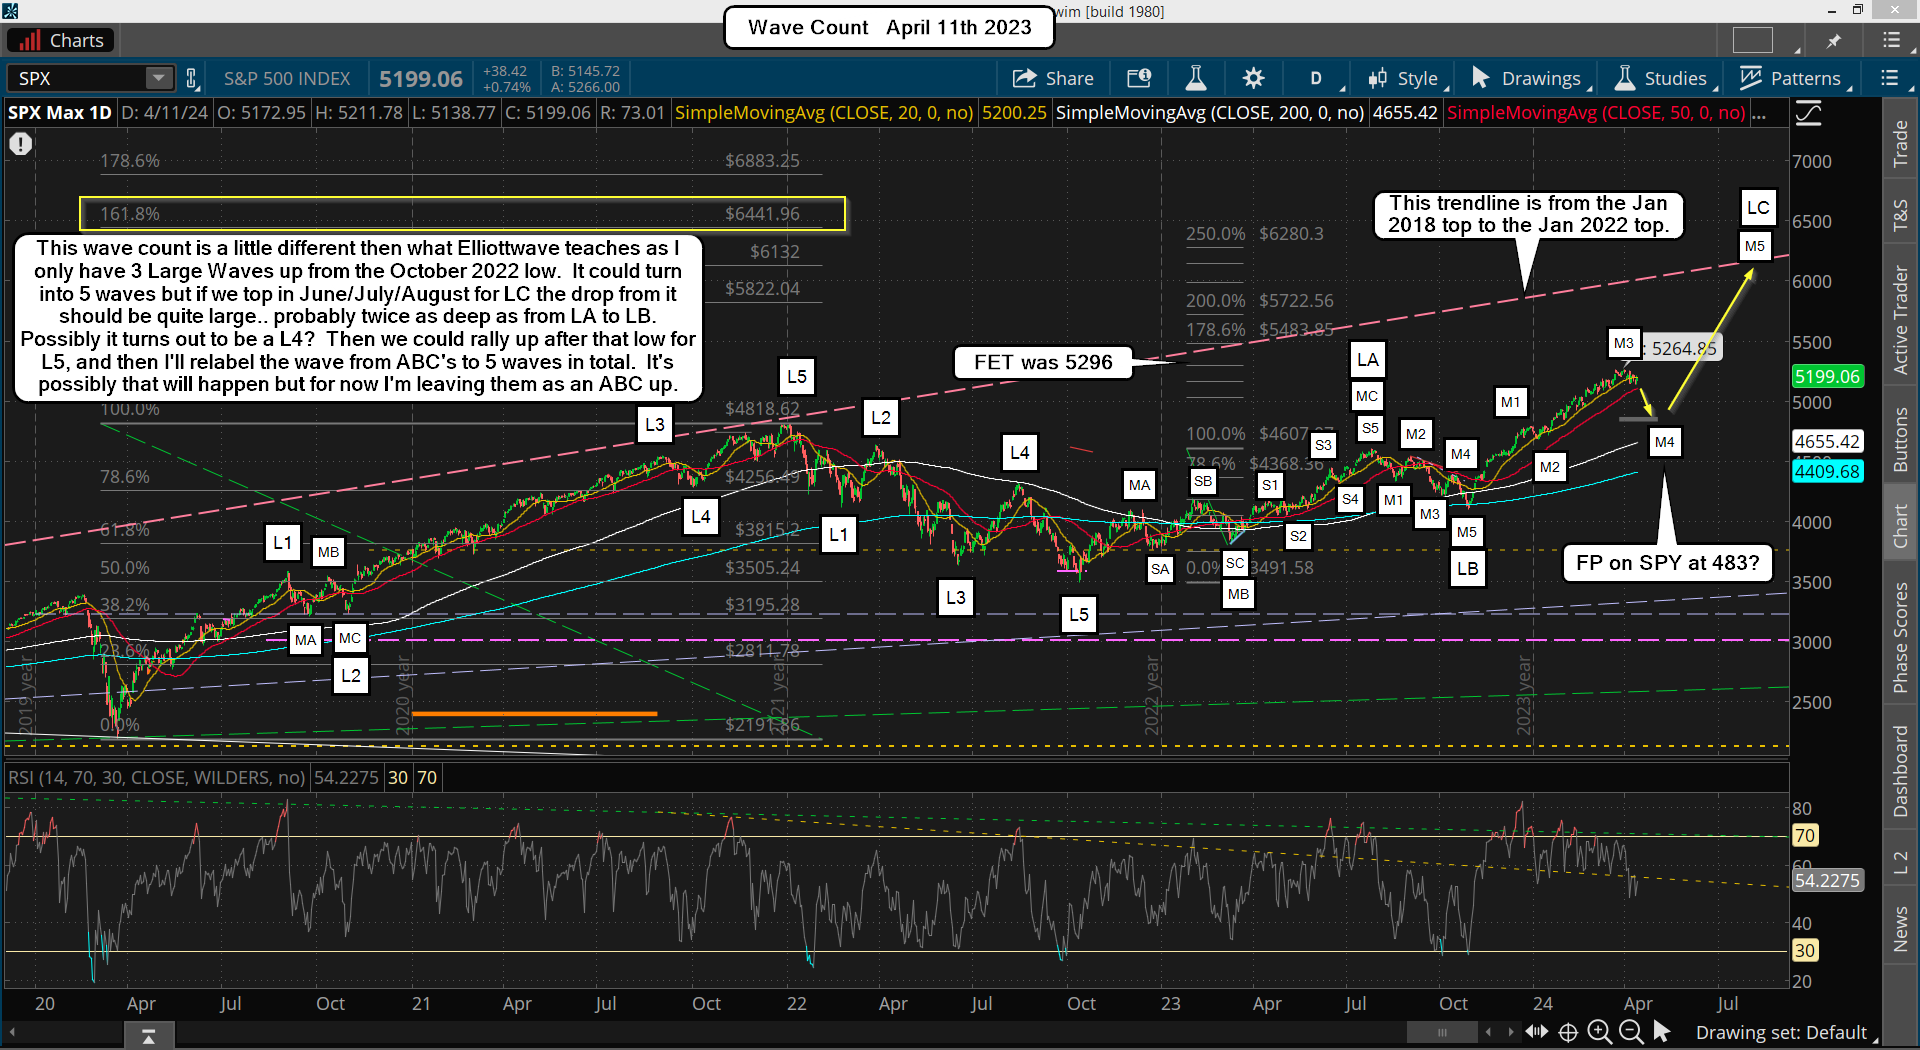
Another important support will be from a rising trendline that connects the 2020 low, with the 2022 low, and the 2023 low, which is in the 4370-4400 zone (depends on when it's hit). This all assumes of course that we will decline in a C wave after the bounce back up from hitting the FP on the SPY. If that low turns out to be the bottom then these targets are worthless as then we'll be off to the races again to 6000+ in the coming many months.
But let's assume I'm right and we do get another drop lower in a C wave, and let's look as something else that is interesting. The low of 2174 (ES) in 2020 to the high of 4808 in 2022 was followed by a pullback into late 2022 that bottomed at 3502. Now, from the 4808 to the 2174 low the 50% retrace level was 3491, so that 3502 level was basically a 50% retrace of the entire rally up from 2020 to early 2022.
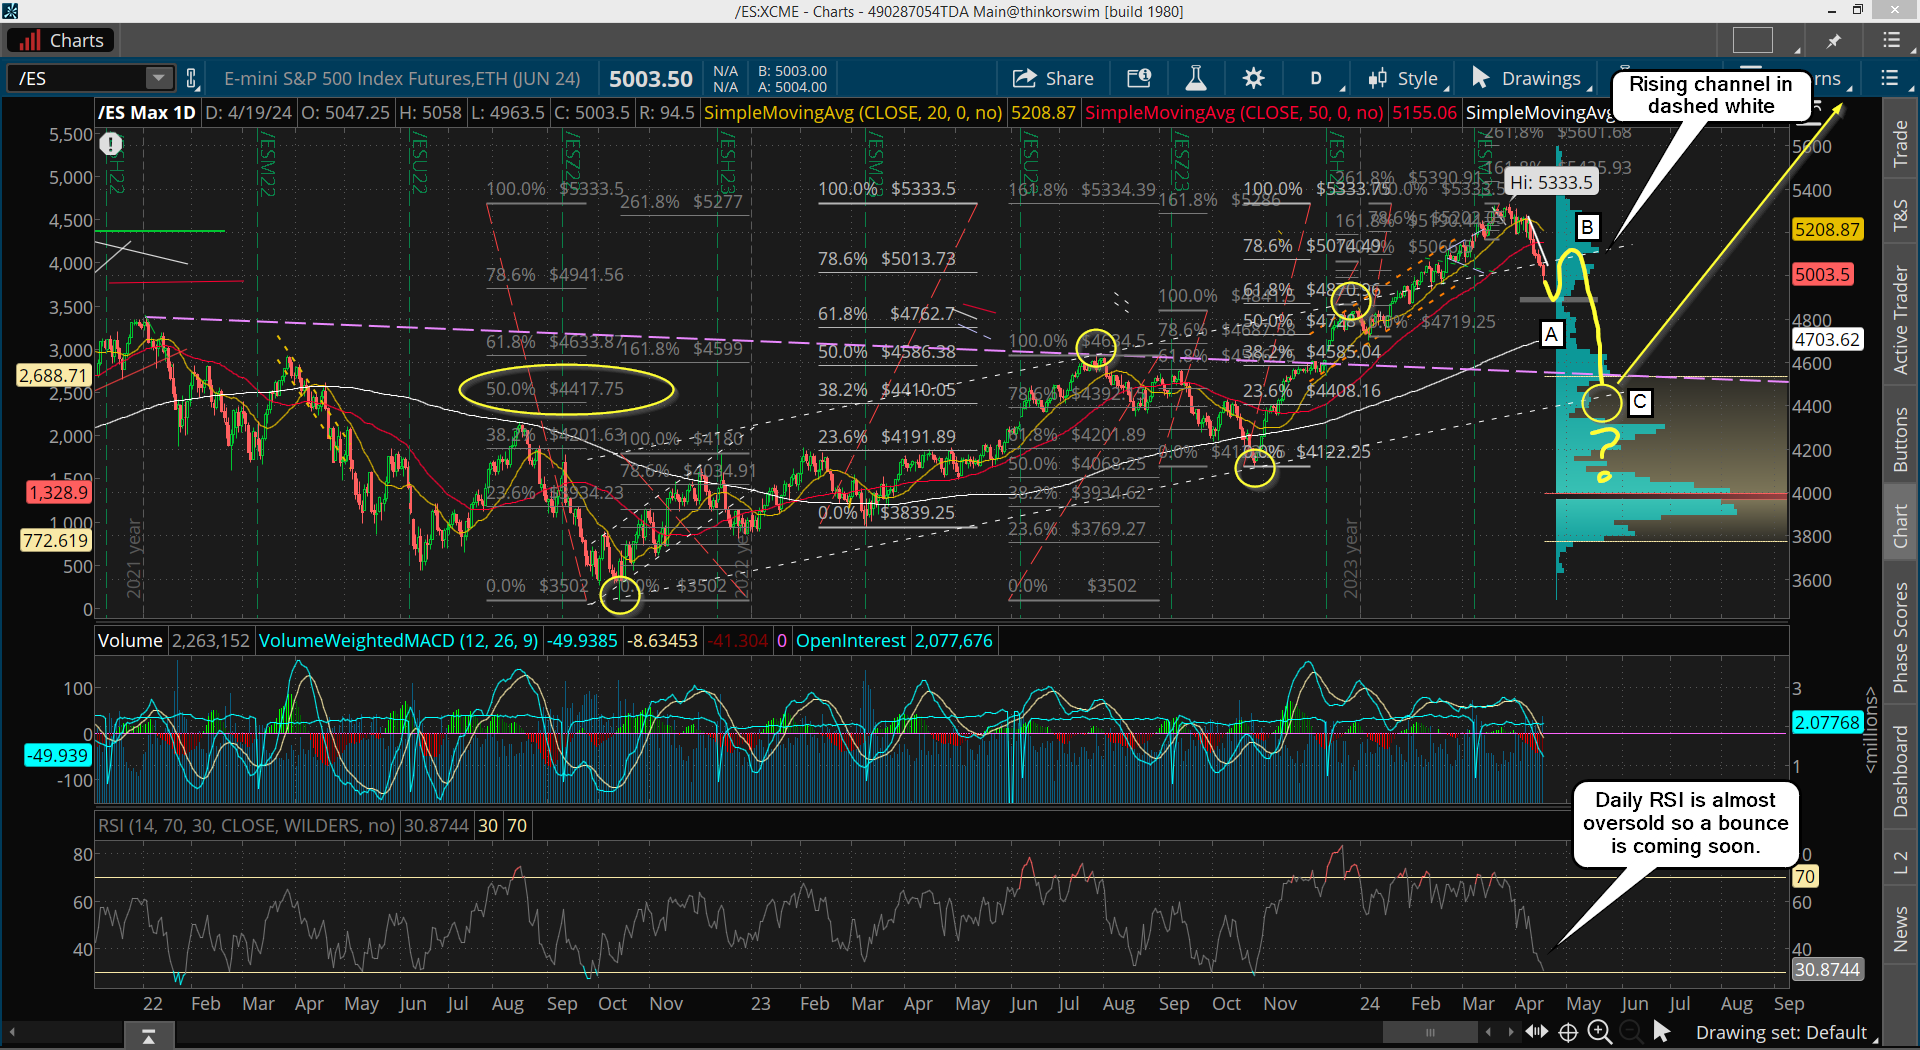
Well, if we take the 3502 low up to the current 5333 high, and do a retrace of 50%, where does that point too? It points to 4417 (ES), so if we repeat the past that could be our downside target. It would also hit (and pierce) a rising trendline that forms a channel.
It's created from the 3502 low and the 10/26/23 low of 4122 and shown on my charts in dashed white. So that is certainly an important level to pay attention to. As far as "time" I have to think that if we start dropping hard and fast for the coming C wave the low could be in by the first week of May, or into part of the second week.
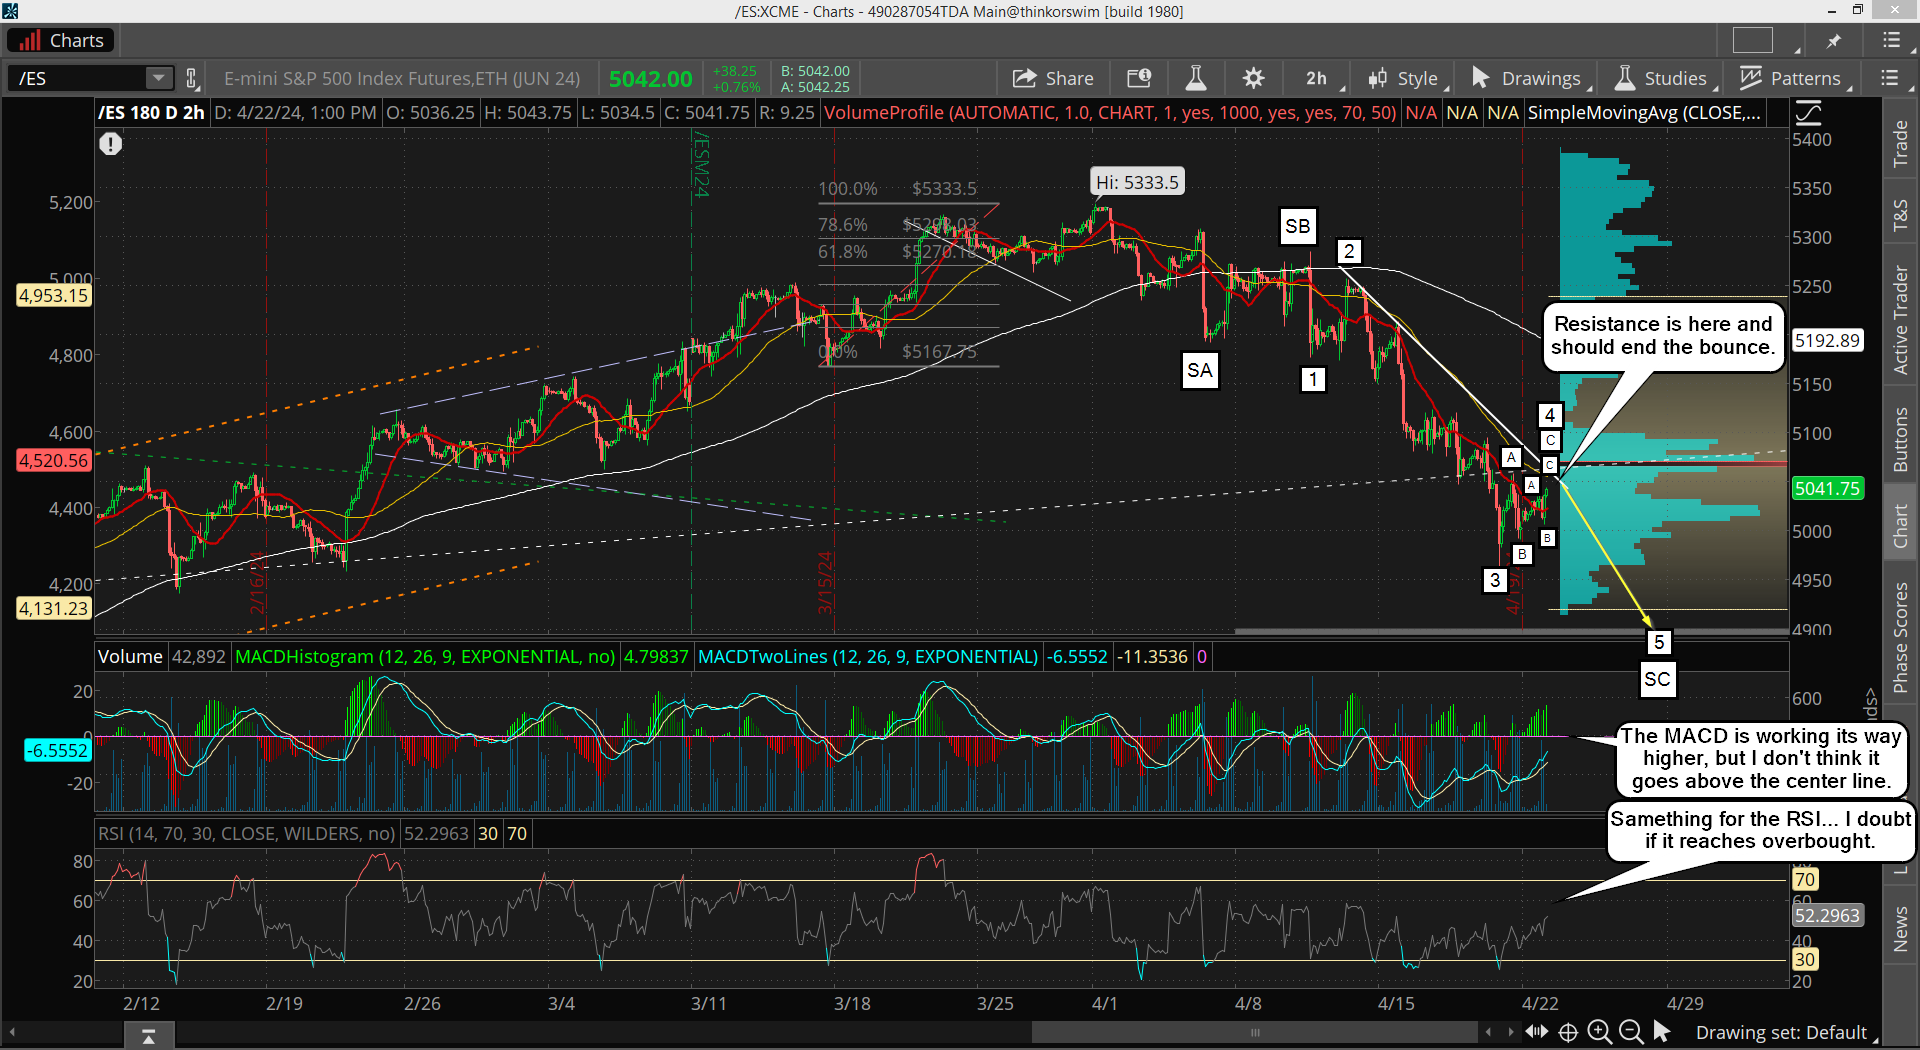
It's just something that will have to be monitored along the way and adapted to. The strength or weakness of the next drop will determine the "time" part, and possibly the price target to?
For now though let's just see the FP on the SPY hit first so I can exit my short and go long for the 50% bounce. After that I'll just re-evaluate and adjust to whatever the market throws at me.
Have a blessed day.