
Well, it comes as no surprise that today up again. After all, every Monday is now bullish... a new rule created by the people who control the market. Of course we all know who that is... but I won't rant on them in this paragraph, I'll save it for another.
Did you notice that the dollar barely sold off any today? With a strong dollar, and the market and the dollar still being on opposite sides of the coin, you would think that the market would have been held back from rallying... but the extremely light volume (147 million) allowed the market to float higher (despite the flat dollar).
It seems quite clear that the big institutions aren't selling or buying right now. They are simply sitting on the sidelines and waiting for the retail traders to push it up to the magic level before they dump their stocks. What is that magic level? I don't know? It could go back up to the 1150 area for a double top, before selling off.
Since all the bears are broke, and the institutions aren't selling, the only person left in the game is the retail bulls. They will continue to buy, pushing up this market, until the big boys want to dump it on them. If the retails get weak, the buy programs will come back in and bait the retails into buying some more. Almost like a horse on a race track, with a carrot dangling just out of reach, in front of his nose.
Of course the bears can't even be found in this picture, as they are horses that have broken, bruised, or worn out body parts, locked up in the stall... trying to mend their injuries. That's me of course... beaten, bruised, not quite broken yet, but trying hang on and get ready for next race.
So, what about tomorrow you ask? I think we are going higher. Yes, I know... why am I bullish now? I'm not... but the charts are looking bullish too me. I like being a bear, but the market is looking more and more bullish everyday now, and as much as I'd like to see a nice sell off, I think we have to go higher first.
Looking at the 60 minute chart below, I see that the RSI is now 66.63, which means that there is now "2 buys to every 1 sell" in the market. Or 33 sellers to every 66 buyers. That's a bullish sign on the 60 minute chart. Notice also that the positive DI line is now on top, which means we are in a bullish mode. The ADX line is still quite low, which means that there isn't much strength in this bullish mode. But, as long as the market still has light volume, they can push it higher... at least for the short term.
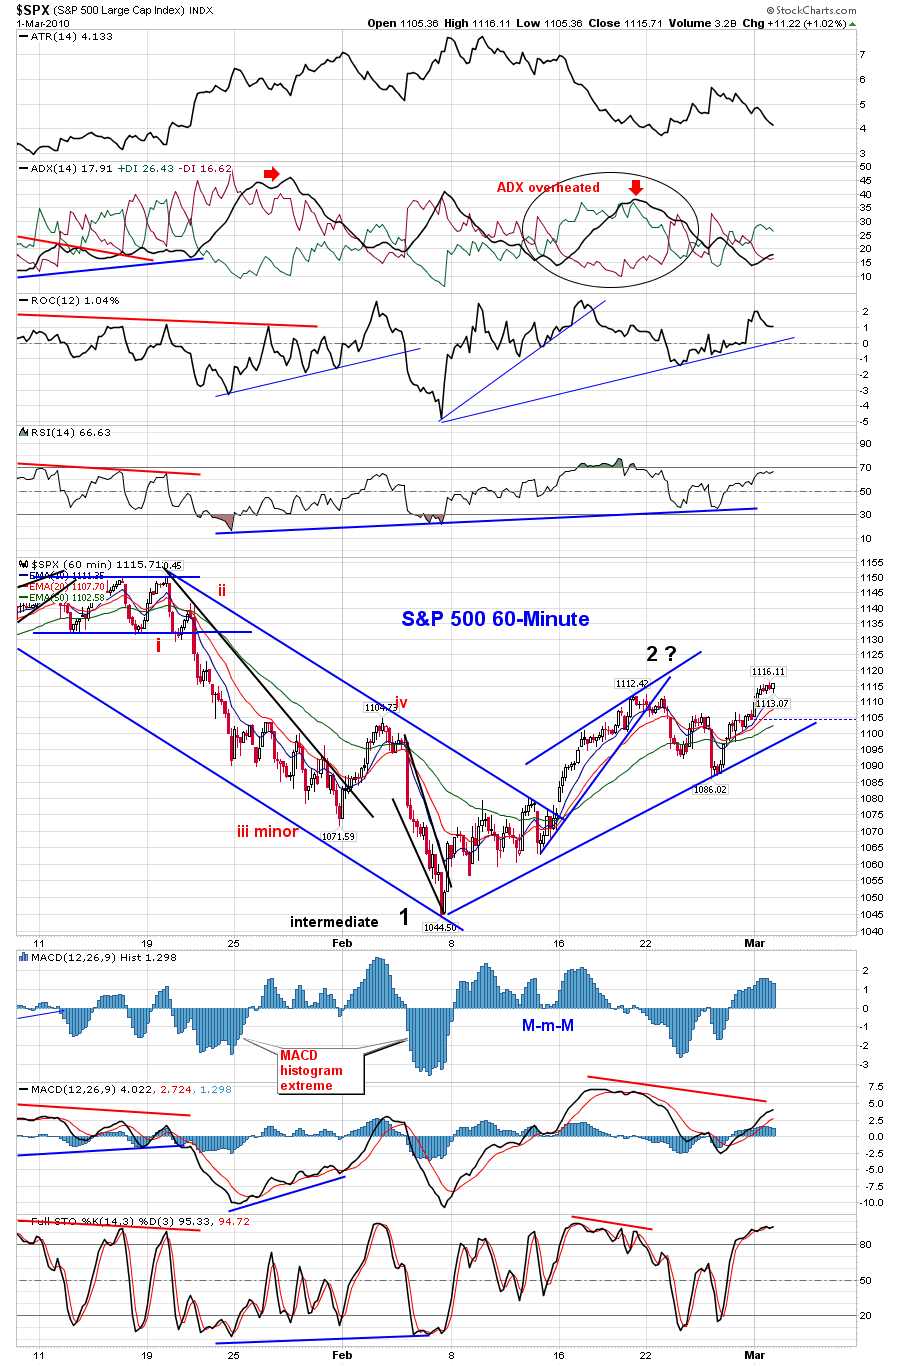
Now, looking at the daily chart below, you can see that the RSI is only at 57.45... which means that it leaning bullish, but still could go either way. The ADX line is now under 20, which tells me that a big move is coming soon, as it should curl back up and giving a lot of strength to whichever line is on top. I believe that will be the negative DI line, as whichever one gets on top should stay there for a few weeks... and I don't see the bulls rallying up for another month.

The monthly and weekly charts don't support a rally up to 1250-1300, which is where we should head if the positive DI line is on top when the ADX line starts to rally up (on the daily chart). Those charts don't turn on a dime folks. That's why I don't see this month closing higher. Just look at that ADX line on the daily chart above, and notice how long the line spent above the mid-point level of 25. I count about 4 weeks... which is about what I'd expect to happen again, once it breaks above that level.
So again, we could go up a little more tomorrow, as they control this market until big volume comes back in. When will that happen? Probably this Wednesday through Friday, as the economic news shouldn't be viewed too positively, but no one except those "on the inside" can really answer that question.
Red


Great post Red – thank you. I think everyone is confused right now.
It's just too scary to go long, as when they finally decide to dump the market, you won't have time to get out. And, it's also scary to go short, as they can eat away your option as we grind higher or sideways.
Rough market right now… at least for swing traders. Day traders are fine, but trying to ride a trend just isn't in the cards right now.
I'm still 33% long in my retirement fund. I moved 66% to “safer” assets just before Xmas. I'll be looking to move the other 33% to … god, I just don't know. I can't move it to cash unless I want to withdraw the whole damn thing and pay the penalty. If we have a financial panic, I suppose treasuries might be the place to go.
Carl just now:
March S&P E-mini Futures: Today's range estimate is 1113-1128. I expect the market to reach 1200 over the next three months.
1113-1128 Todays estimate range for /ES
1103-1116 Yesterdays estimate range for /ES
Carl owns one unit of /ES at 1098.50 since last Friday
It's up 23 at the moment.
Earl, what are you up to today?
Lamenting my decision to buy some TZA yesterday 🙂
Added some TZA at 8.46
What is american bull saying today.
TNA is a hold — whether it goes up or down
TZA is a buy on a white candle (doesn't look too promising)
SPX 60 min chart
http://www.flickr.com/photos/47091634@N04/44006…
the TA enthusiasts will see a inverse H&S, those patterns are of no value to me, everybody has heard me explaining the 1127.38 gap so once that gap is filled my inventory will be unloaded for this setup.
It is important to note if we get a higher close than open on the $SPX today it'll be 5 consecutive in this sequence. An important clue on the daily especially if we close the 1127.38 gap today.
Sundancer, thanks.. Spx 115 and S&P 1127.38 are important.
snapshot of controlling trendlines on SPY daily
http://www.flickr.com/photos/47091634@N04/44007…
Orange trendline comes in @ SPY 113.62 today
Great post Red 🙂
Sundancer can you share the origin of those controlling lines ?
TIA 🙂
the orange trendline intersects the 8/11/08 & 9/2/2008 highs
the yellow trendline intersects the 9/08/2008 & 9/19/2008 higihs
Dollar daily- big move coming
http://www.flickr.com/photos/47091634@N04/44016…
$RUT: IWM Daily update
IWM gapped over an important containment pt. this morning
http://www.flickr.com/photos/47091634@N04/44009…
after the operators run the stops above Jan. 19 highs, the brown line will be the next magnet
I concur. $RUT is looking for the 61.8% retracement level from the 2007 highs.
Here's some interesting numbers on the $DJI
IF the $DJI closes above 10,404.16 today, it will have 3 consecutive higher closes than opens
The last 6 times the $DJI had 3 consecutive higher closes than opens it went onto a 4th consecutive higher close than open
the operators make me laugh, the $DJI closed it's 15:57 3 min candle @ 10,401.52 and then magically 1 minute after the close the $DJI settles @ 10,405.98. So given the above setup, it tells you the operators want all the buying power they can get from the algos with this sequence setup.
Leo — I've taken the opposite approach. I don't even look at the monthly charts anymore. We are in a liquidity fueled market since 2009. The longest duration charts I look at are weekly charts or a long string of dailies to see relative overbought/oversold conditions.
Dread, another typical day.
Carl at days end:
1113-1128 Todays estimate range for /ES
1115.25-1122.75 Todays actual range
Today stayed in Carls range by several points bottom & top.
Carl owns one unit of /ES at 1098.50 since last Friday
It's up 19.50 at the moment.
All in all a good day for Carl. Grade: A
TNA gapped up 1.2% and closed up 2.4%.
We are in a Full Moon Trade, which favors TNA.
After two days, this trade is up 7.5%.
Volume today for TNA was a bit higher than normal for these past 12 days.
$RVX (VIX for $RUT) closed 1.5% higher with TNA up 2.4%. A bit of a divergence (they should go different directions) and possibly bad for TNA.
TNA has been up 13 of the past 15 days.
Ultimate Oscillator for TNA peaked at 78 seven trading days ago and has generally fallen since then but has remained above 50 and is currently 68. Indicating continued strength for TNA.
However, TNA today closed 7% higher than that day with the peak Ultimate Oscillator value. A higher close with a lower Ultimate Oscillator value might be seen as negative divergence indicating that TNA is due to fall.
Also, TNA was up 2.4% today, but the Ultimate Oscillator dropped from 68.8 to 68.3 – a bit of a divergence.
Bollinger Bands for $RVX (VIX for $RUT): today’s green candle closed farther from the lower band and the lower Bollinger band dropped, — indicating that $RVX could rise tomorrow, bad for TNA.
Bollinger Bands for $RUT: $RUT rose to near the upper Bollinger Band, but that upper band rose today, indicating that $RUT could rise again tomorrow, favoring TNA.
Bollinger Bands for $RUT:$RVX ($RUT vs VIX for $RUT): today’s candle was inside yesterdays candle, quite a contrast from prior days rising candles. This is a reflection of the divergence between $RVX & $RUT.
http://www.americanbulls.com had TNA as a BUY on Feb 9th, and hold since then. TNA remains a hold for tomorrow.
Overall, it looks like TNA continues to move above an area of congestion and might continue rising tomorrow. The divergences are bothersome and might be warning of a reversal tomorrow.
snapshot of the IYR (real estate)
http://www.flickr.com/photos/47091634@N04/44018…
Sundancer hard to read your resistent tgt – what is it on IYR?
Americanbulls.com view:
TZA is a WAIT (for a buy signal). TZA is down 23.82% since the sell signal on Feb 9th.
TNA is a HOLD (for a sell signal). TNA is up 29.16% since the buy signal on Feb 9th.
Americanbulls.com view:
TZA is a WAIT (for a buy signal). TZA is down 23.82% since the sell signal on Feb 9th.
TNA is a HOLD (for a sell signal). TNA is up 29.16% since the buy signal on Feb 9th.
snapshot of the IYR (real estate)
http://www.flickr.com/photos/47091634@N04/44018…
Sundancer hard to read your resistent tgt – what is it on IYR?
TNA gapped up 1.2% and closed up 2.4%.
We are in a Full Moon Trade, which favors TNA.
After two days, this trade is up 7.5%.
Volume today for TNA was a bit higher than normal for these past 12 days.
$RVX (VIX for $RUT) closed 1.5% higher with TNA up 2.4%. A bit of a divergence (they should go different directions) and possibly bad for TNA.
TNA has been up 13 of the past 15 days.
The high for TNA today was $48.20, the highest TNA since Oct 21st.
January 11 had a high of $48.15. Just eyeballing the chart at a high level, Jan 11th & today seem rather like a double top.
Ultimate Oscillator for TNA peaked at 78 seven trading days ago and has generally fallen since then but has remained above 50 and is currently 68. Indicating continued strength for TNA.
However, TNA today closed 7% higher than that day with the peak Ultimate Oscillator value. A higher close with a lower Ultimate Oscillator value might be seen as negative divergence indicating that TNA is due to fall.
Also, TNA was up 2.4% today, but the Ultimate Oscillator dropped from 68.8 to 68.3 – a bit of a divergence.
Bollinger Bands for $RVX (VIX for $RUT): today’s green candle closed farther from the lower band and the lower Bollinger band dropped, — indicating that $RVX could rise tomorrow, bad for TNA.
Bollinger Bands for $RUT: $RUT rose to near the upper Bollinger Band, but that upper band rose today, indicating that $RUT could rise again tomorrow, favoring TNA.
Bollinger Bands for $RUT:$RVX ($RUT vs VIX for $RUT): today’s candle was inside yesterdays candle, quite a contrast from prior days rising candles. This is a reflection of the divergence between $RVX & $RUT.
http://www.americanbulls.com had TNA as a BUY on Feb 9th, and hold since then. TNA remains a hold for tomorrow.
Overall, it looks like TNA continues to move above an area of congestion and might continue rising tomorrow. The divergences are bothersome and might be warning of a reversal tomorrow.
Carl at days end:
1113-1128 Todays estimate range for /ES
1115.25-1122.75 Todays actual range
Today stayed in Carls range by several points bottom & top.
Carl owns one unit of /ES at 1098.50 since last Friday
It's up 19.50 at the moment.
All in all a good day for Carl. Grade: A
Leo — I've taken the opposite approach. I don't even look at the monthly charts anymore. We are in a liquidity fueled market since 2009. The longest duration charts I look at are weekly charts or a long string of dailies to see relative overbought/oversold conditions.
Dread, another typical day.
the operators make me laugh, the $DJI closed it's 15:57 3 min candle @ 10,401.52 and then magically 1 minute after the close the $DJI settles @ 10,405.98. So given the above setup, it tells you the operators want all the buying power they can get from the algos with this sequence setup.