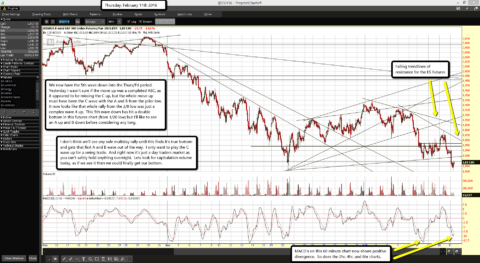
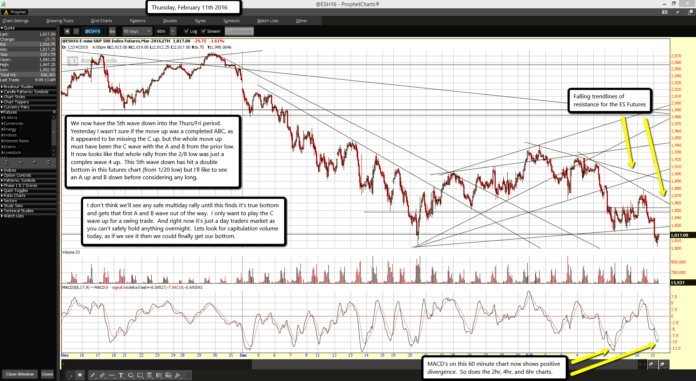
 Falling trendlines of resistance for the ES Futures
MACD's on this 60 minute chart now shows positive divergence. So does the 2hr, 4hr, and 6hr charts.
We now have the 5th wave down into the Thurs/Fri period. Yesterday I wasn't sure if the move up was a completed ABC, as it appeared to be missing the C up, but the whole move up must have been the C wave with the A and B from the prior low. It now looks like that whole rally from the 2/8 low was just a complex wave 4 up. This 5th wave down has hit a double bottom in this futures chart (from 1/20 low) but I'll like to see an A up and B down before considering any long.
I don't think we'll see any safe multiday rally until this finds it's true bottom and gets that first A and B wave out of the way. I only want to play the C wave up for a swing trade. And right now it's just a day traders market as you can't safely hold anything overnight. Lets look for capitulation volume today, as if we see it then we could finally get our bottom.


