
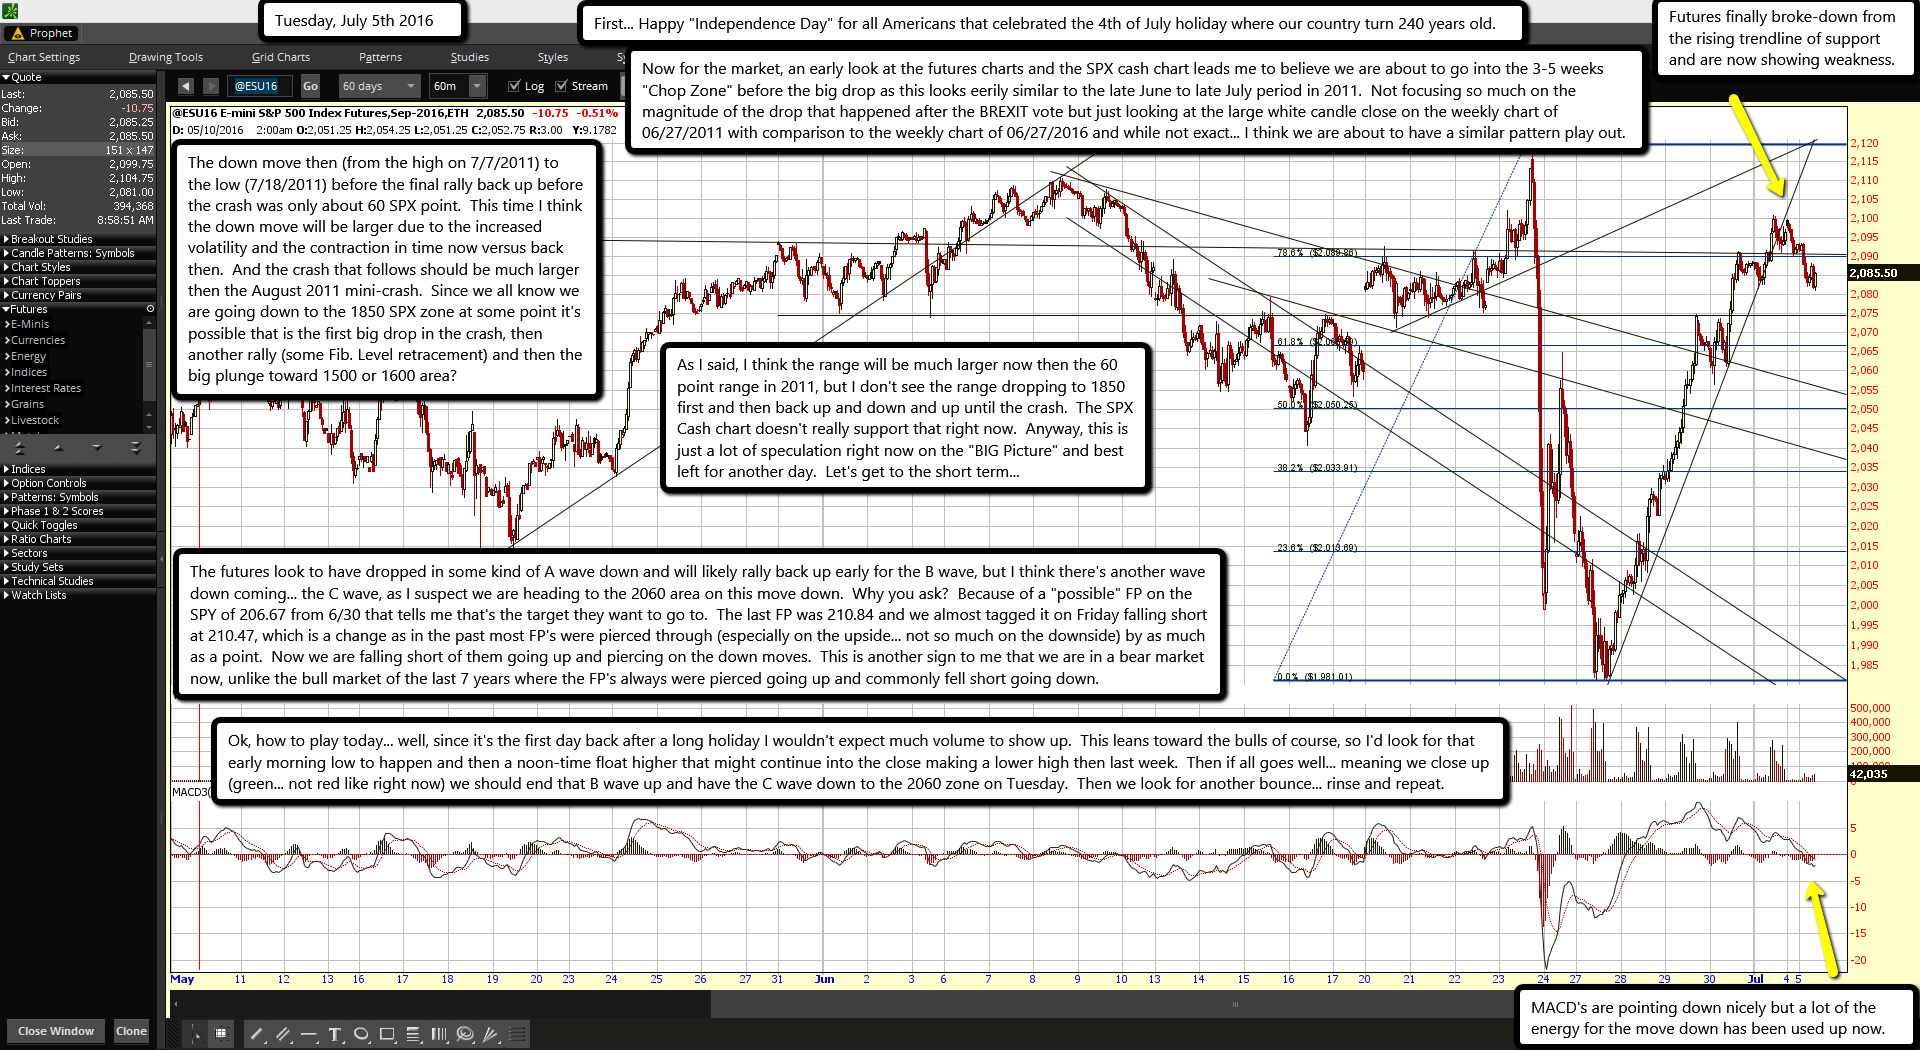
Futures finally broke-down from the rising trendline of support and are now showing weakness.
MACD's are pointing down nicely but a lot of the energy for the move down has been used up now.
First... Happy "Independence Day" for all Americans that celebrated the 4th of July holiday where our country turn 240 years old.
Now for the market, an early look at the futures charts and the SPX cash chart leads me to believe we are about to go into the 3-5 weeks "Chop Zone" before the big drop as this looks eerily similar to the late June to late July period in 2011. Not focusing so much on the magnitude of the drop that happened after the BREXIT vote but just looking at the large white candle close on the weekly chart of 06/27/2011 with comparison to the weekly chart of 06/27/2016 and while not exact... I think we are about to have a similar pattern play out.
The down move then (from the high on 7/7/2011) to the low (7/18/2011) before the final rally back up before the crash was only about 60 SPX point. This time I think the down move will be larger due to the increased volatility and the contraction in time now versus back then. And the crash that follows should be much larger then the August 2011 mini-crash. Since we all know we are going down to the 1850 SPX zone at some point it's possible that is the first big drop in the crash, then another rally (some Fib. Level retracement) and then the big plunge toward 1500 or 1600 area?
As I said, I think the range will be much larger now then the 60 point range in 2011, but I don't see the range dropping to 1850 first and then back up and down and up until the crash. The SPX Cash chart doesn't really support that right now. Anyway, this is just a lot of speculation right now on the "BIG Picture" and best left for another day. Let's get to the short term...
The futures look to have dropped in some kind of A wave down and will likely rally back up early for the B wave, but I think there's another wave down coming... the C wave, as I suspect we are heading to the 2060 area on this move down. Why you ask? Because of a "possible" FP on the SPY of 206.67 from 6/30 that tells me that's the target they want to go to. The last FP was 210.84 and we almost tagged it on Friday falling short at 210.47, which is a change as in the past most FP's were pierced through (especially on the upside... not so much on the downside) by as much as a point. Now we are falling short of them going up and piercing on the down moves. This is another sign to me that we are in a bear market now, unlike the bull market of the last 7 years where the FP's always were pierced going up and commonly fell short going down.
Ok, how to play today... well, since it's the first day back after a long holiday I wouldn't expect much volume to show up. This leans toward the bulls of course, so I'd look for that early morning low to happen and then a noon-time float higher that might continue into the close making a lower high then last week. Then if all goes well... meaning we close up (green... not red like right now) we should end that B wave up and have the C wave down to the 2060 zone on Tuesday. Then we look for another bounce... rinse and repeat.

