
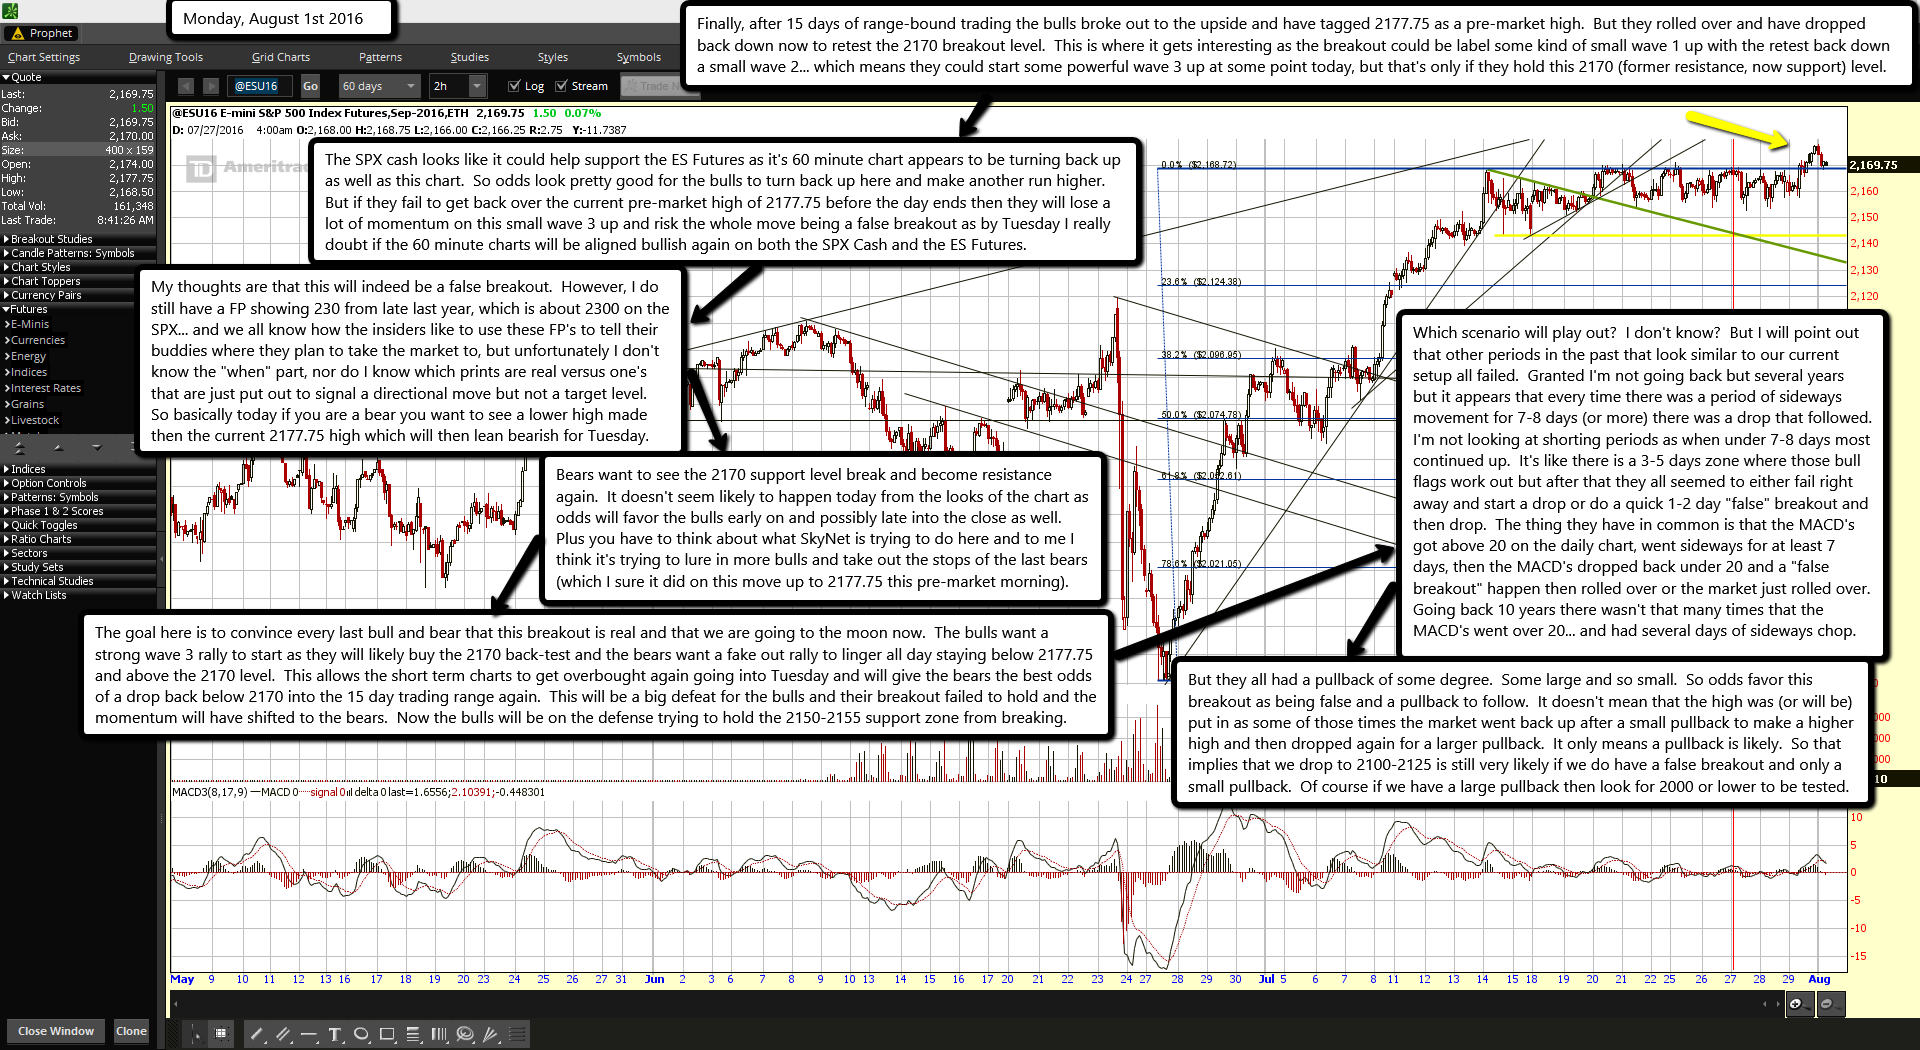
Finally, after 15 days of range-bound trading the bulls broke out to the upside and have tagged 2177.75 as a pre-market high. But they rolled over and have dropped back down now to retest the 2170 breakout level. This is where it gets interesting as the breakout could be label some kind of small wave 1 up with the retest back down a small wave 2... which means they could start some powerful wave 3 up at some point today, but that's only if they hold this 2170 (former resistance, now support) level.
The SPX cash looks like it could help support the ES Futures as it's 60 minute chart appears to be turning back up as well as this chart. So odds look pretty good for the bulls to turn back up here and make another run higher. But if they fail to get back over the current pre-market high of 2177.75 before the day ends then they will lose a lot of momentum on this small wave 3 up and risk the whole move being a false breakout as by Tuesday I really doubt if the 60 minute charts will be aligned bullish again on both the SPX Cash and the ES Futures.
My thoughts are that this will indeed be a false breakout. However, I do still have a FP showing 230 from late last year, which is about 2300 on the SPX... and we all know how the insiders like to use these FP's to tell their buddies where they plan to take the market to, but unfortunately I don't know the "when" part, nor do I know which prints are real versus one's that are just put out to signal a directional move but not a target level. So basically today if you are a bear you want to see a lower high made then the current 2177.75 high which will then lean bearish for Tuesday.
Bears want to see the 2170 support level break and become resistance again. It doesn't seem likely to happen today from the looks of the chart as odds will favor the bulls early on and possibly late into the close as well. Plus you have to think about what SkyNet is trying to do here and to me I think it's trying to lure in more bulls and take out the stops of the last bears (which I sure it did on this move up to 2177.75 this pre-market morning).
The goal here is to convince every last bull and bear that this breakout is real and that we are going to the moon now. The bulls want a strong wave 3 rally to start as they will likely buy the 2170 back-test and the bears want a fake out rally to linger all day staying below 2177.75 and above the 2170 level. This allows the short term charts to get overbought again going into Tuesday and will give the bears the best odds of a drop back below 2170 into the 15 day trading range again. This will be a big defeat for the bulls and their breakout failed to hold and the momentum will have shifted to the bears. Now the bulls will be on the defense trying to hold the 2150-2155 support zone from breaking.
Which scenario will play out? I don't know? But I will point out that other periods in the past that look similar to our current setup all failed. Granted I'm not going back but several years but it appears that every time there was a period of sideways movement for 7-8 days (or more) there was a drop that followed. I'm not looking at shorting periods as when under 7-8 days most continued up. It's like there is a 3-5 days zone where those bull flags work out but after that they all seemed to either fail right away and start a drop or do a quick 1-2 day "false" breakout and then drop. The thing they have in common is that the MACD's got above 20 on the daily chart, went sideways for at least 7 days, then the MACD's dropped back under 20 and a "false breakout" happen then rolled over or the market just rolled over. Going back 10 years there wasn't that many times that the MACD's went over 20... and had several days of sideways chop.
But they all had a pullback of some degree. Some large and so small. So odds favor this breakout as being false and a pullback to follow. It doesn't mean that the high was (or will be) put in as some of those times the market went back up after a small pullback to make a higher high and then dropped again for a larger pullback. It only means a pullback is likely. So that implies that we drop to 2100-2125 is still very likely if we do have a false breakout and only a small pullback. Of course if we have a large pullback then look for 2000 or lower to be tested.

