
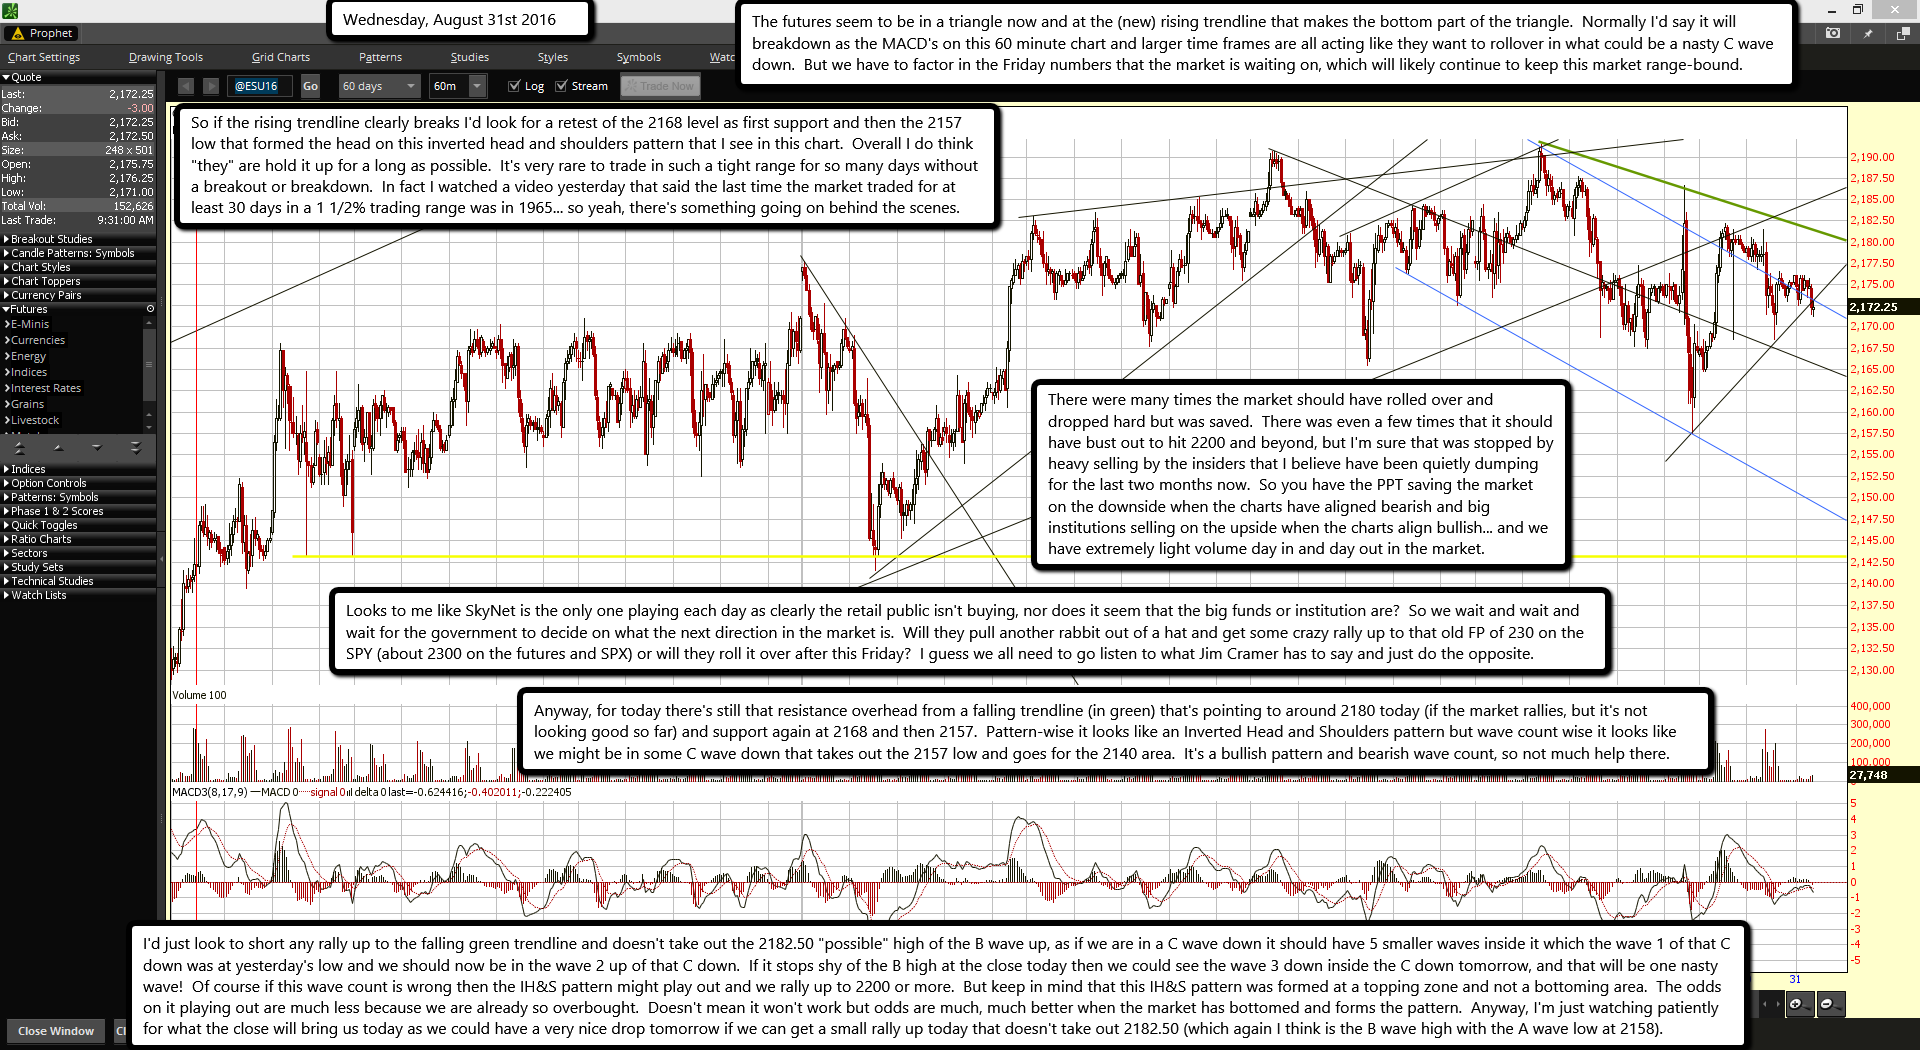
The futures seem to be in a triangle now and at the (new) rising trendline that makes the bottom part of the triangle. Normally I'd say it will breakdown as the MACD's on this 60 minute chart and larger time frames are all acting like they want to rollover in what could be a nasty C wave down. But we have to factor in the Friday numbers that the market is waiting on, which will likely continue to keep this market range-bound.
So if the rising trendline clearly breaks I'd look for a retest of the 2168 level as first support and then the 2157 low that formed the head on this inverted head and shoulders pattern that I see in this chart. Overall I do think "they" are hold it up for a long as possible. It's very rare to trade in such a tight range for so many days without a breakout or breakdown. In fact I watched a video yesterday that said the last time the market traded for at least 30 days in a 1 1/2% trading range was in 1965... so yeah, there's something going on behind the scenes.
There were many times the market should have rolled over and dropped hard but was saved. There was even a few times that it should have bust out to hit 2200 and beyond, but I'm sure that was stopped by heavy selling by the insiders that I believe have been quietly dumping for the last two months now. So you have the PPT saving the market on the downside when the charts have aligned bearish and big institutions selling on the upside when the charts align bullish... and we have extremely light volume day in and day out in the market.
Looks to me like SkyNet is the only one playing each day as clearly the retail public isn't buying, nor does it seem that the big funds or institution are? So we wait and wait and wait for the government to decide on what the next direction in the market is. Will they pull another rabbit out of a hat and get some crazy rally up to that old FP of 230 on the SPY (about 2300 on the futures and SPX) or will they roll it over after this Friday? I guess we all need to go listen to what Jim Cramer has to say and just do the opposite.
Anyway, for today there's still that resistance overhead from a falling trendline (in green) that's pointing to around 2180 today (if the market rallies, but it's not looking good so far) and support again at 2168 and then 2157. Pattern-wise it looks like an Inverted Head and Shoulders pattern but wave count wise it looks like we might be in some C wave down that takes out the 2157 low and goes for the 2140 area. It's a bullish pattern and bearish wave count, so not much help there.
I'd just look to short any rally up to the falling green trendline and doesn't take out the 2182.50 "possible" high of the B wave up, as if we are in a C wave down it should have 5 smaller waves inside it which the wave 1 of that C down was at yesterday's low and we should now be in the wave 2 up of that C down. If it stops shy of the B high at the close today then we could see the wave 3 down inside the C down tomorrow, and that will be one nasty wave! Of course if this wave count is wrong then the IH&S pattern might play out and we rally up to 2200 or more. But keep in mind that this IH&S pattern was formed at a topping zone and not a bottoming area. The odds on it playing out are much less because we are already so overbought. Doesn't mean it won't work but odds are much, much better when the market has bottomed and forms the pattern. Anyway, I'm just watching patiently for what the close will bring us today as we could have a very nice drop tomorrow if we can get a small rally up today that doesn't take out 2182.50 (which again I think is the B wave high with the A wave low at 2158).

