
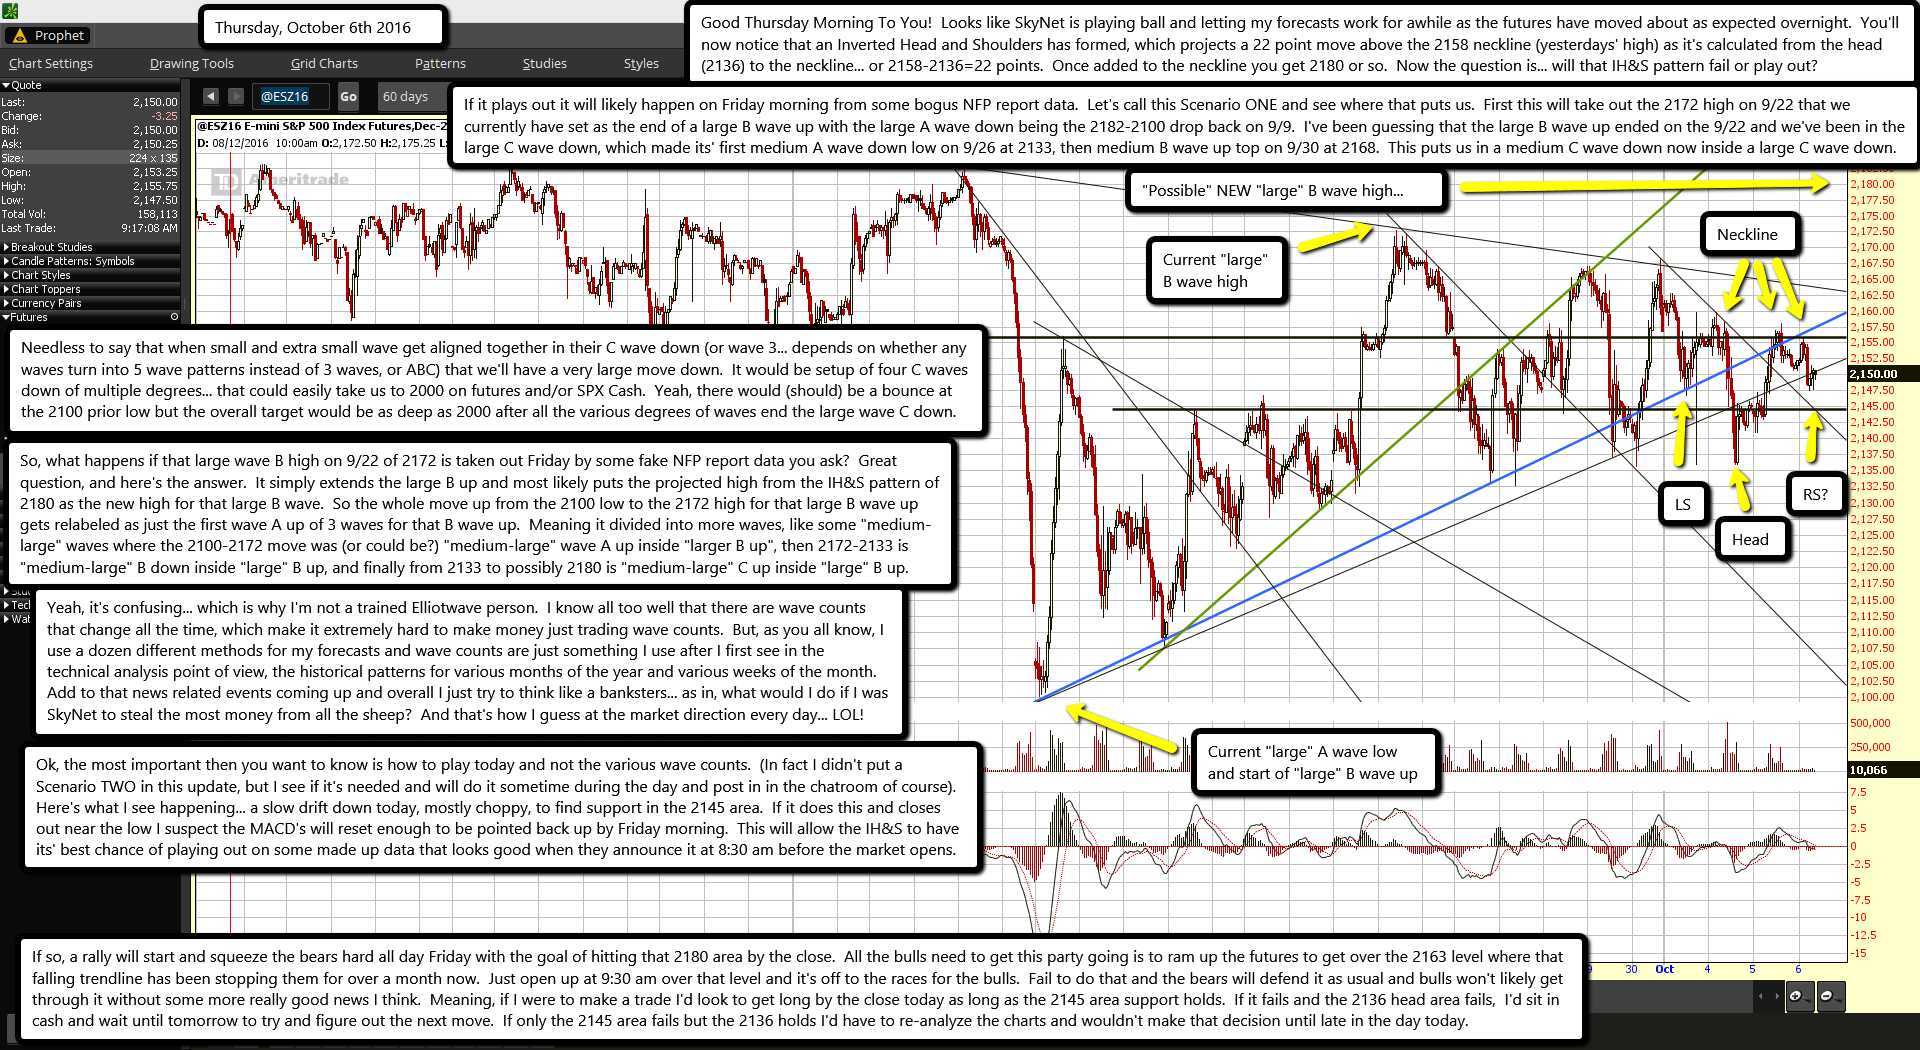
Good Thursday Morning To You! Looks like SkyNet is playing ball and letting my forecasts work for awhile as the futures have moved about as expected overnight. You'll now notice that an Inverted Head and Shoulders has formed, which projects a 22 point move above the 2158 neckline (yesterdays' high) as it's calculated from the head (2136) to the neckline... or 2158-2136=22 points. Once added to the neckline you get 2180 or so. Now the question is... will that IH&S pattern fail or play out?
If it plays out it will likely happen on Friday morning from some bogus NFP report data. Let's call this Scenario ONE and see where that puts us. First this will take out the 2172 high on 9/22 that we currently have set as the end of a large B wave up with the large A wave down being the 2182-2100 drop back on 9/9. I've been guessing that the large B wave up ended on the 9/22 and we've been in the large C wave down, which made its' first medium A wave down low on 9/26 at 2133, then medium B wave up top on 9/30 at 2168. This puts us in a medium C wave down now inside a large C wave down.
Needless to say that when small and extra small wave get aligned together in their C wave down (or wave 3... depends on whether any waves turn into 5 wave patterns instead of 3 waves, or ABC) that we'll have a very large move down. It would be setup of four C waves down of multiple degrees... that could easily take us to 2000 on futures and/or SPX Cash. Yeah, there would (should) be a bounce at the 2100 prior low but the overall target would be as deep as 2000 after all the various degrees of waves end the large wave C down.
So, what happens if that large wave B high on 9/22 of 2172 is taken out Friday by some fake NFP report data you ask? Great question, and here's the answer. It simply extends the large B up and most likely puts the projected high from the IH&S pattern of 2180 as the new high for that large B wave. So the whole move up from the 2100 low to the 2172 high for that large B wave up gets relabeled as just the first wave A up of 3 waves for that B wave up. Meaning it divided into more waves, like some "medium-large" waves where the 2100-2172 move was (or could be?) "medium-large" wave A up inside "larger B up", then 2172-2133 is "medium-large" B down inside "large" B up, and finally from 2133 to possibly 2180 is "medium-large" C up inside "large" B up.
Yeah, it's confusing... which is why I'm not a trained Elliotwave person. I know all too well that there are wave counts that change all the time, which make it extremely hard to make money just trading wave counts. But, as you all know, I use a dozen different methods for my forecasts and wave counts are just something I use after I first see in the technical analysis point of view, the historical patterns for various months of the year and various weeks of the month. Add to that news related events coming up and overall I just try to think like a banksters... as in, what would I do if I was SkyNet to steal the most money from all the sheep? And that's how I guess at the market direction every day... LOL!
Ok, the most important then you want to know is how to play today and not the various wave counts. (In fact I didn't put a Scenario TWO in this update, but I see if it's needed and will do it sometime during the day and post in in the chatroom of course). Here's what I see happening... a slow drift down today, mostly choppy, to find support in the 2145 area. If it does this and closes out near the low I suspect the MACD's will reset enough to be pointed back up by Friday morning. This will allow the IH&S to have its' best chance of playing out on some made up data that looks good when they announce it at 8:30 am before the market opens.
If so, a rally will start and squeeze the bears hard all day Friday with the goal of hitting that 2180 area by the close. All the bulls need to get this party going is to ram up the futures to get over the 2163 level where that falling trendline has been stopping them for over a month now. Just open up at 9:30 am over that level and it's off to the races for the bulls. Fail to do that and the bears will defend it as usual and bulls won't likely get through it without some more really good news I think. Meaning, if I were to make a trade I'd look to get long by the close today as long as the 2145 area support holds. If it fails and the 2136 head area fails, I'd sit in cash and wait until tomorrow to try and figure out the next move. If only the 2145 area fails but the 2136 holds I'd have to re-analyze the charts and wouldn't make that decision until late in the day today.

