
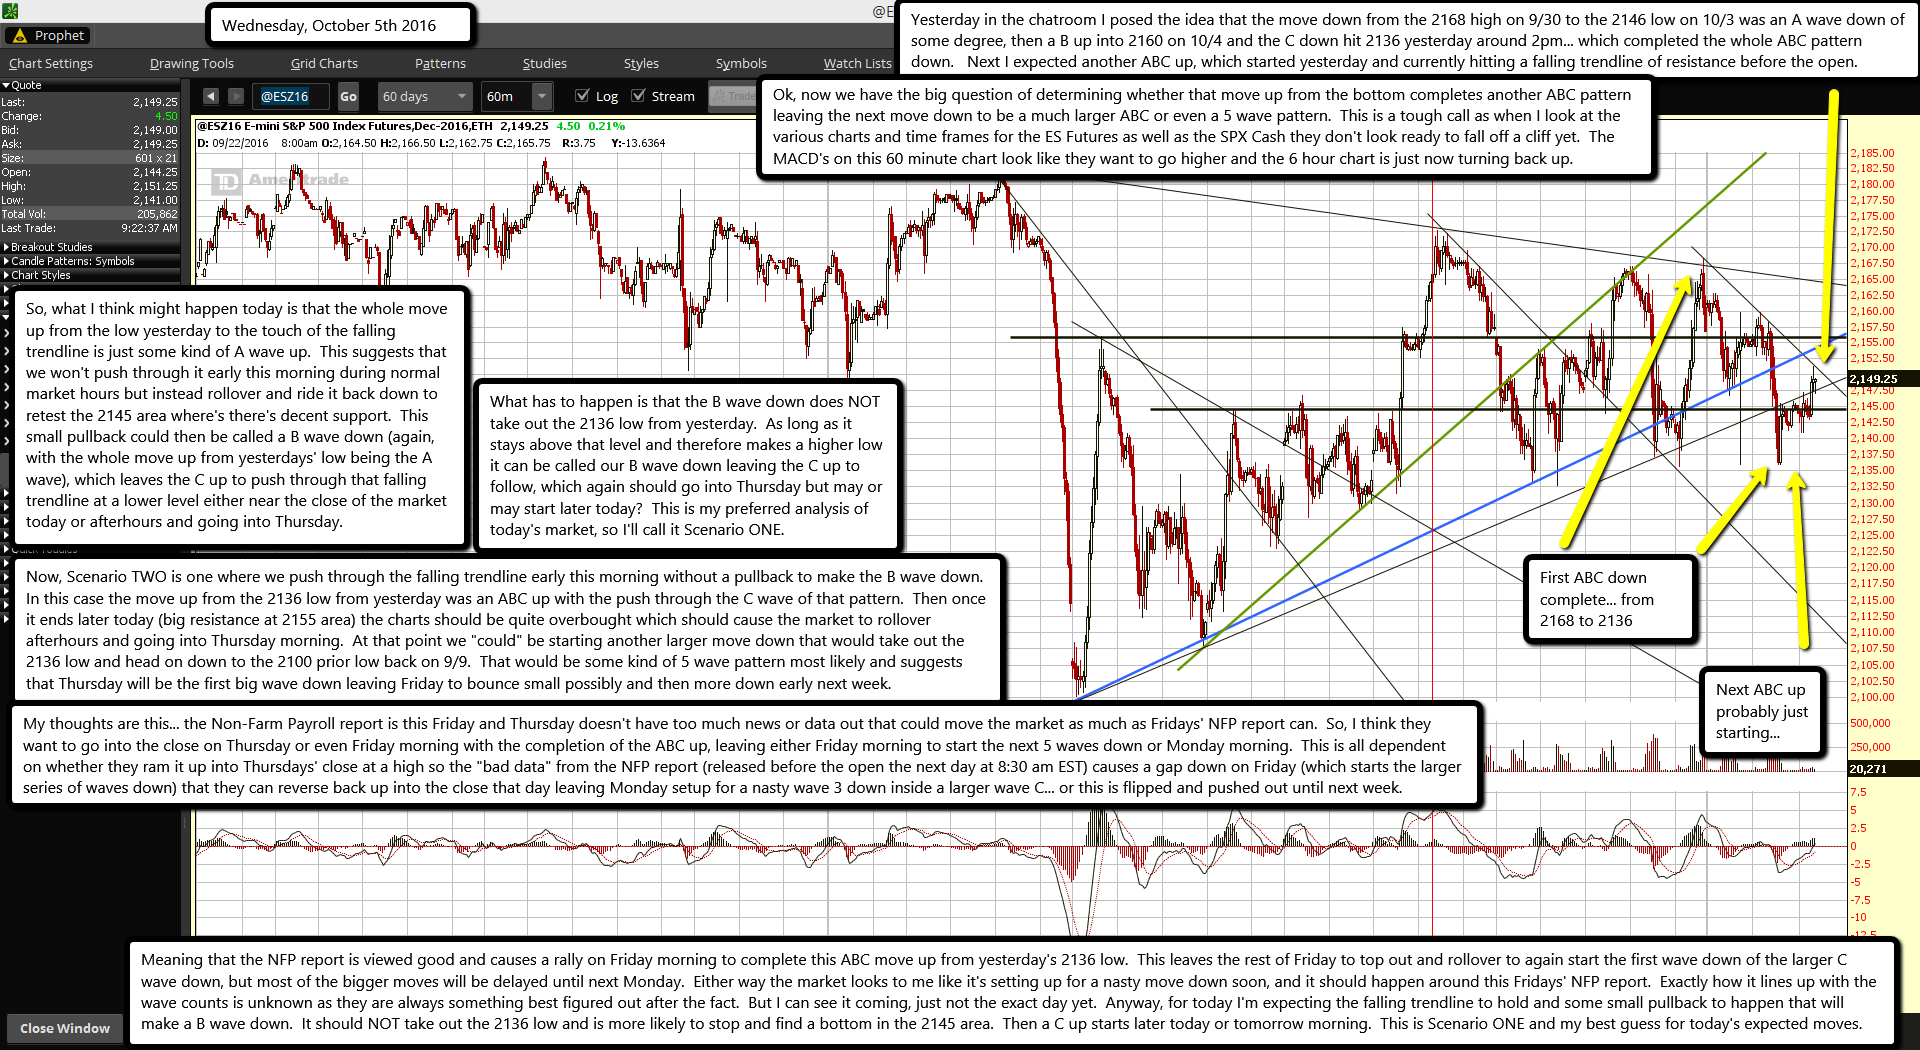
Yesterday in the chatroom I posed the idea that the move down from the 2168 high on 9/30 to the 2146 low on 10/3 was an A wave down of some degree, then a B up into 2160 on 10/4 and the C down hit 2136 yesterday around 2pm... which completed the whole ABC pattern down. Next I expected another ABC up, which started yesterday and currently hitting a falling trendline of resistance before the open.
Ok, now we have the big question of determining whether that move up from the bottom completes another ABC pattern leaving the next move down to be a much larger ABC or even a 5 wave pattern. This is a tough call as when I look at the various charts and time frames for the ES Futures as well as the SPX Cash they don't look ready to fall off a cliff yet. The MACD's on this 60 minute chart look like they want to go higher and the 6 hour chart is just now turning back up.
So, what I think might happen today is that the whole move up from the low yesterday to the touch of the falling trendline is just some kind of A wave up. This suggests that we won't push through it early this morning during normal market hours but instead rollover and ride it back down to retest the 2145 area where's there's decent support. This small pullback could then be called a B wave down (again, with the whole move up from yesterdays' low being the A wave), which leaves the C up to push through that falling trendline at a lower level either near the close of the market today or afterhours and going into Thursday.
What has to happen is that the B wave down does NOT take out the 2136 low from yesterday. As long as it stays above that level and therefore makes a higher low it can be called our B wave down leaving the C up to follow, which again should go into Thursday but may or may start later today? This is my preferred analysis of today's market, so I'll call it Scenario ONE.
Now, Scenario TWO is one where we push through the falling trendline early this morning without a pullback to make the B wave down. In this case the move up from the 2136 low from yesterday was an ABC up with the push through the C wave of that pattern. Then once it ends later today (big resistance at 2155 area) the charts should be quite overbought which should cause the market to rollover afterhours and going into Thursday morning. At that point we "could" be starting another larger move down that would take out the 2136 low and head on down to the 2100 prior low back on 9/9. That would be some kind of 5 wave pattern most likely and suggests that Thursday will be the first big wave down leaving Friday to bounce small possibly and then more down early next week.
My thoughts are this... the Non-Farm Payroll report is this Friday and Thursday doesn't have too much news or data out that could move the market as much as Fridays' NFP report can. So, I think they want to go into the close on Thursday or even Friday morning with the completion of the ABC up, leaving either Friday morning to start the next 5 waves down or Monday morning. This is all dependent on whether they ram it up into Thursdays' close at a high so the "bad data" from the NFP report (released before the open the next day at 8:30 am EST) causes a gap down on Friday (which starts the larger series of waves down) that they can reverse back up into the close that day leaving Monday setup for a nasty wave 3 down inside a larger wave C... or this is flipped and pushed out until next week.
Meaning that the NFP report is viewed good and causes a rally on Friday morning to complete this ABC move up from yesterday's 2136 low. This leaves the rest of Friday to top out and rollover to again start the first wave down of the larger C wave down, but most of the bigger moves will be delayed until next Monday. Either way the market looks to me like it's setting up for a nasty move down soon, and it should happen around this Fridays' NFP report. Exactly how it lines up with the wave counts is unknown as they are always something best figured out after the fact. But I can see it coming, just not the exact day yet. Anyway, for today I'm expecting the falling trendline to hold and some small pullback to happen that will make a B wave down. It should NOT take out the 2136 low and is more likely to stop and find a bottom in the 2145 area. Then a C up starts later today or tomorrow morning. This is Scenario ONE and my best guess for today's expected moves.

