
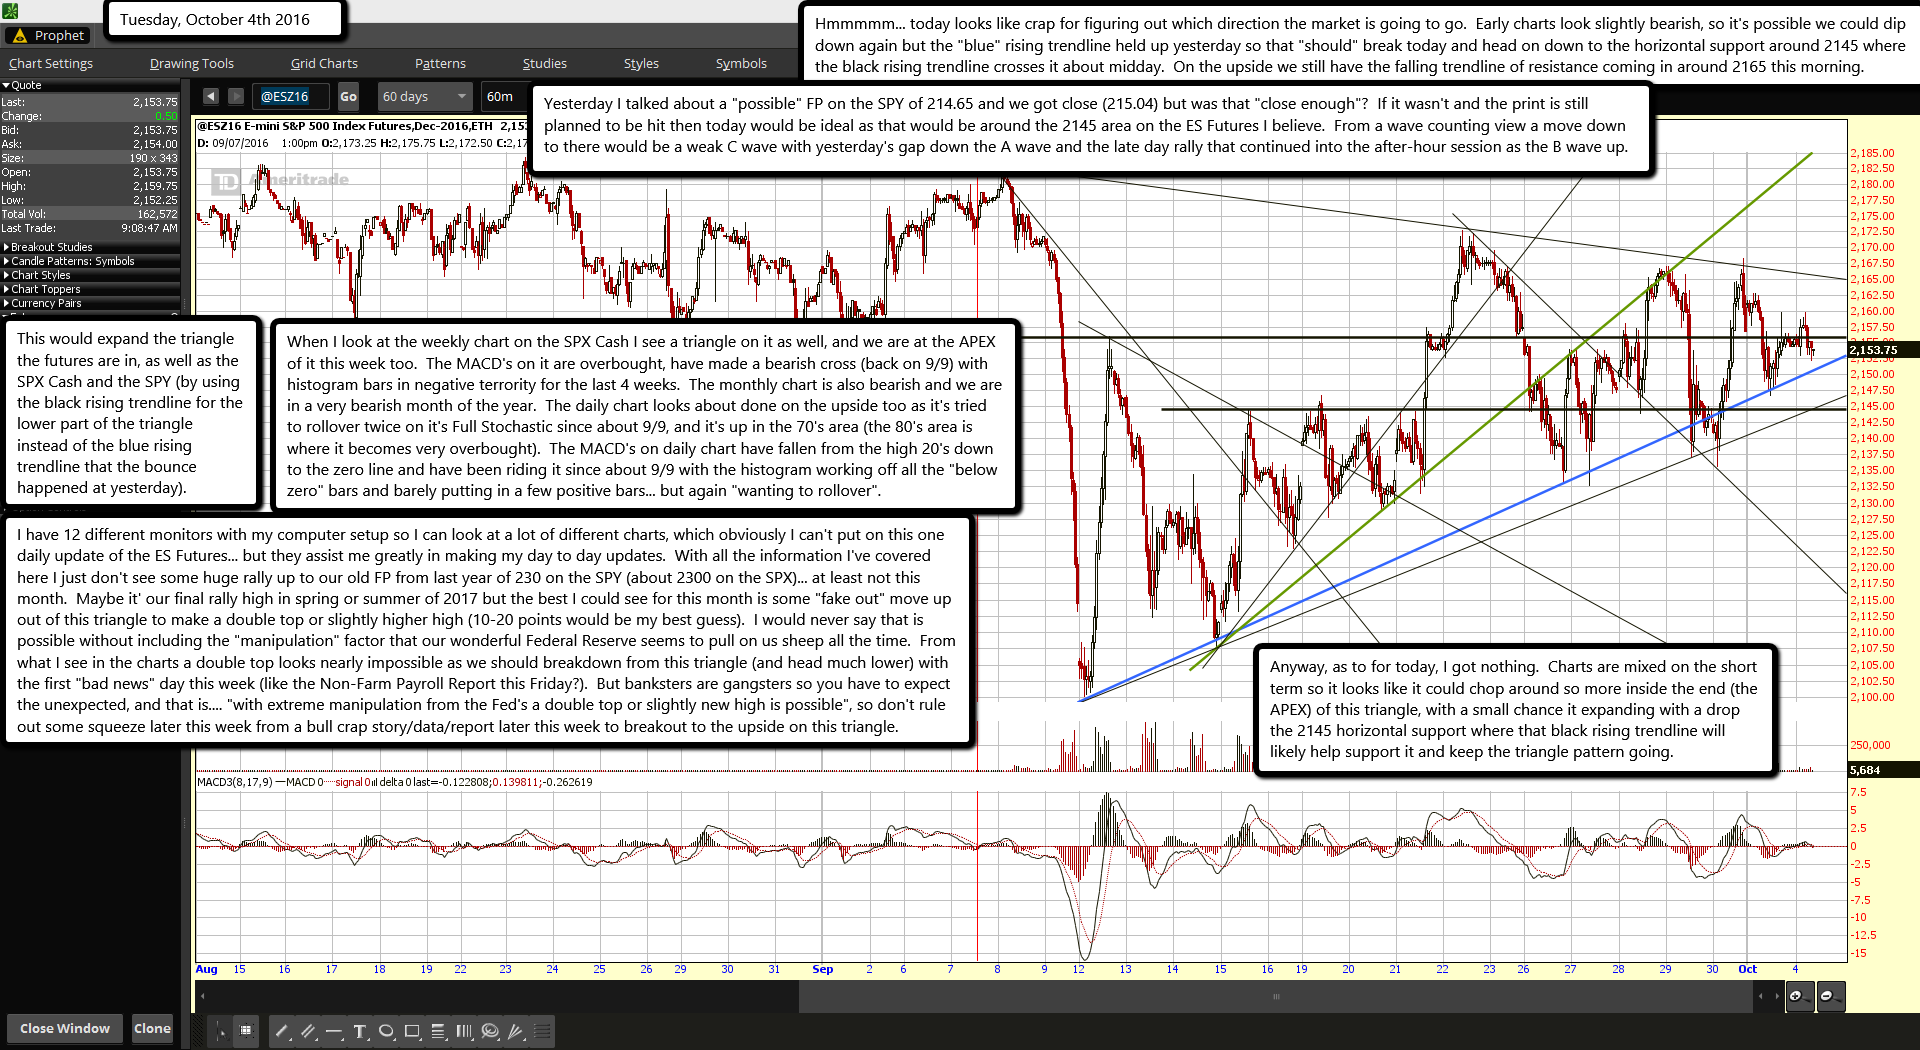
Hmmmmm... today looks like crap for figuring out which direction the market is going to go. Early charts look slightly bearish, so it's possible we could dip down again but the "blue" rising trendline held up yesterday so that "should" break today and head on down to the horizontal support around 2145 where the black rising trendline crosses it about midday. On the upside we still have the falling trendline of resistance coming in around 2165 this morning.
Yesterday I talked about a "possible" FP on the SPY of 214.65 and we got close (215.04) but was that "close enough"? If it wasn't and the print is still planned to be hit then today would be ideal as that would be around the 2145 area on the ES Futures I believe. From a wave counting view a move down to there would be a weak C wave with yesterday's gap down the A wave and the late day rally that continued into the after-hour session as the B wave up.
This would expand the triangle the futures are in, as well as the SPX Cash and the SPY (by using the black rising trendline for the lower part of the triangle instead of the blue rising trendline that the bounce happened at yesterday).
When I look at the weekly chart on the SPX Cash I see a triangle on it as well, and we are at the APEX of it this week too. The MACD's on it are overbought, have made a bearish cross (back on 9/9) with histogram bars in negative terrority for the last 4 weeks. The monthly chart is also bearish and we are in a very bearish month of the year. The daily chart looks about done on the upside too as it's tried to rollover twice on it's Full Stochastic since about 9/9, and it's up in the 70's area (the 80's area is where it becomes very overbought). The MACD's on daily chart have fallen from the high 20's down to the zero line and have been riding it since about 9/9 with the histogram working off all the "below zero" bars and barely putting in a few positive bars... but again "wanting to rollover".
I have 12 different monitors with my computer setup so I can look at a lot of different charts, which obviously I can't put on this one daily update of the ES Futures... but they assist me greatly in making my day to day updates. With all the information I've covered here I just don't see some huge rally up to our old FP from last year of 230 on the SPY (about 2300 on the SPX)... at least not this month. Maybe it' our final rally high in spring or summer of 2017 but the best I could see for this month is some "fake out" move up out of this triangle to make a double top or slightly higher high (10-20 points would be my best guess). I would never say that is possible without including the "manipulation" factor that our wonderful Federal Reserve seems to pull on us sheep all the time. From what I see in the charts a double top looks nearly impossible as we should breakdown from this triangle (and head much lower) with the first "bad news" day this week (like the Non-Farm Payroll Report this Friday?). But banksters are gangsters so you have to expect the unexpected, and that is.... "with extreme manipulation from the Fed's a double top or slightly new high is possible", so don't rule out some squeeze later this week from a bull crap story/data/report later this week to breakout to the upside on this triangle.
Anyway, as to for today, I got nothing. Charts are mixed on the short term so it looks like it could chop around so more inside the end (the APEX) of this triangle, with a small chance it expanding with a drop the 2145 horizontal support where that black rising trendline will likely help support it and keep the triangle pattern going.

