
Another Monday, another rangebound day... that's todays' title!
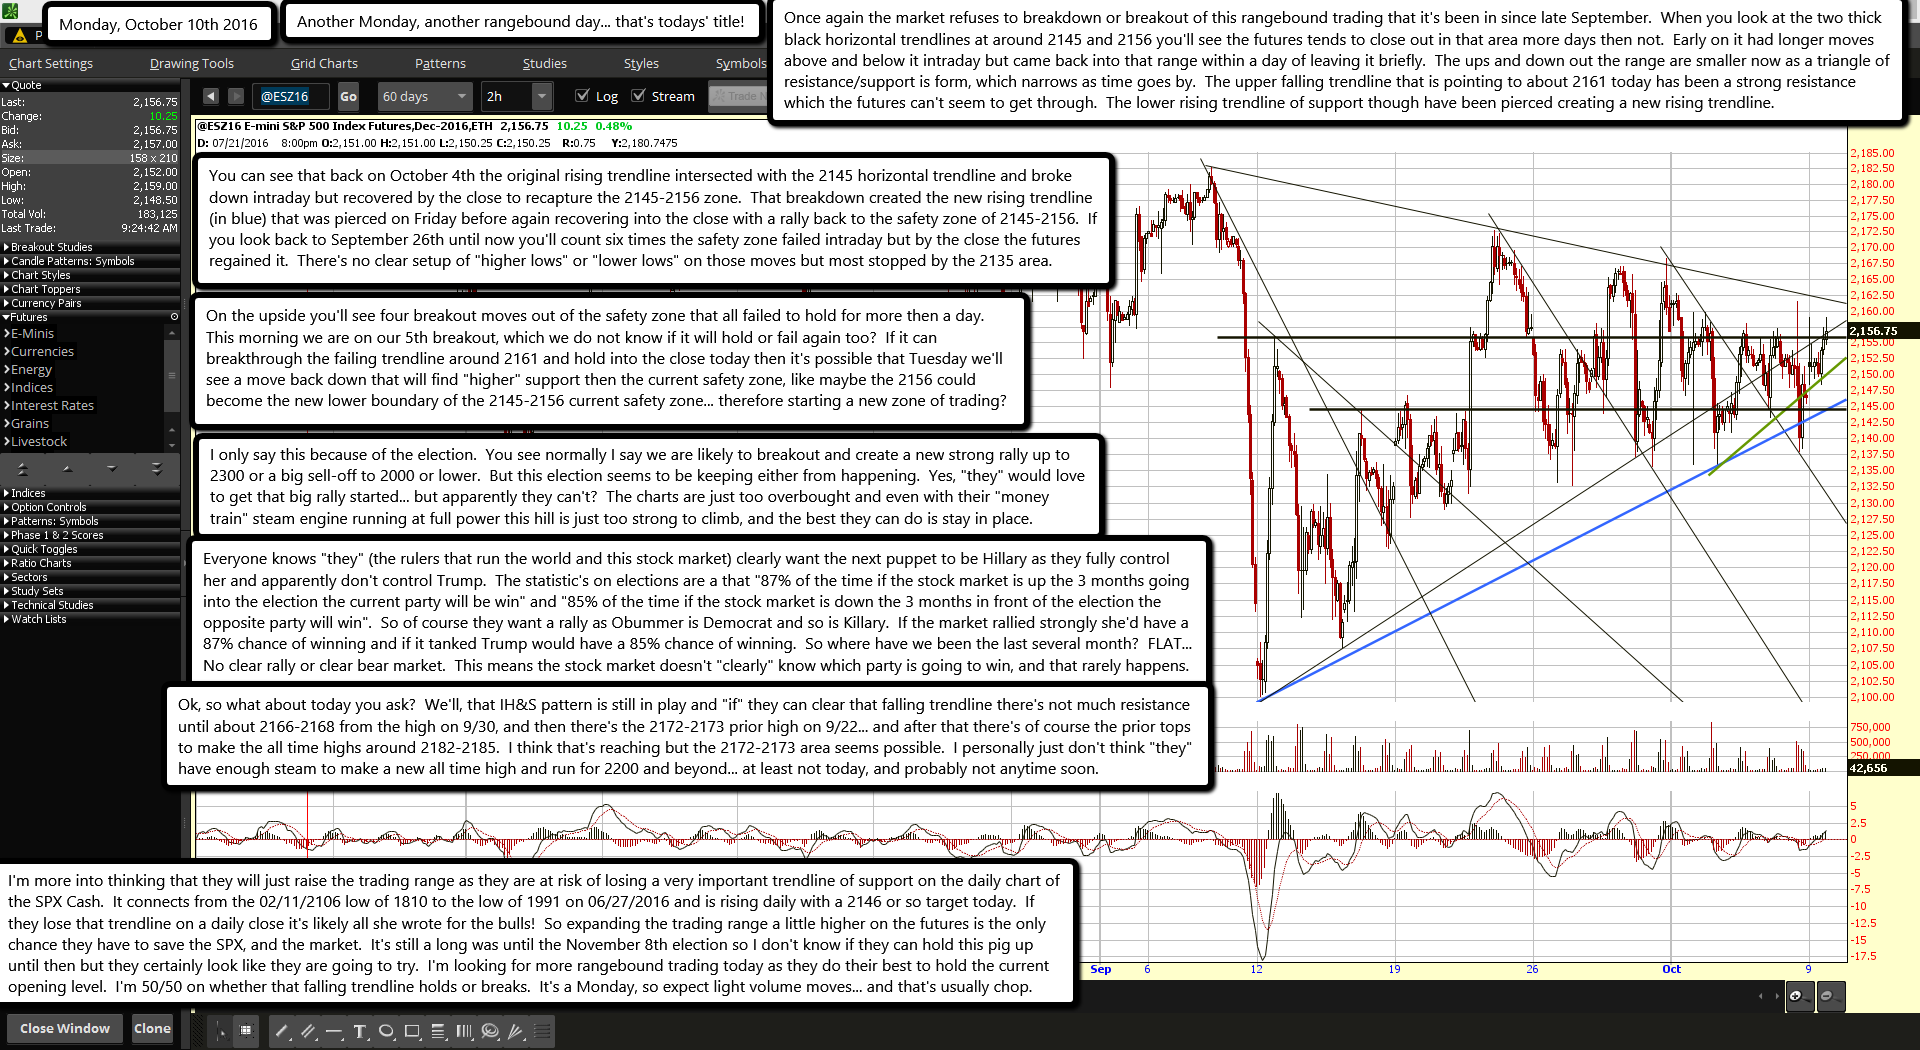
Once again the market refuses to breakdown or breakout of this rangebound trading that it's been in since late September. When you look at the two thick black horizontal trendlines at around 2145 and 2156 you'll see the futures tends to close out in that area more days then not. Early on it had longer moves above and below it intraday but came back into that range within a day of leaving it briefly. The ups and down out the range are smaller now as a triangle of resistance/support is form, which narrows as time goes by. The upper falling trendline that is pointing to about 2161 today has been a strong resistance which the futures can't seem to get through. The lower rising trendline of support though have been pierced creating a new rising trendline.
You can see that back on October 4th the original rising trendline intersected with the 2145 horizontal trendline and broke down intraday but recovered by the close to recapture the 2145-2156 zone. That breakdown created the new rising trendline (in blue) that was pierced on Friday before again recovering into the close with a rally back to the safety zone of 2145-2156. If you look back to September 26th until now you'll count six times the safety zone failed intraday but by the close the futures regained it. There's no clear setup of "higher lows" or "lower lows" on those moves but most stopped by the 2135 area.
On the upside you'll see four breakout moves out of the safety zone that all failed to hold for more then a day. This morning we are on our 5th breakout, which we do not know if it will hold or fail again too? If it can breakthrough the failing trendline around 2161 and hold into the close today then it's possible that Tuesday we'll see a move back down that will find "higher" support then the current safety zone, like maybe the 2156 could become the new lower boundary of the 2145-2156 current safety zone... therefore starting a new zone of trading?
I only say this because of the election. You see normally I say we are likely to breakout and create a new strong rally up to 2300 or a big sell-off to 2000 or lower. But this election seems to be keeping either from happening. Yes, "they" would love to get that big rally started... but apparently they can't? The charts are just too overbought and even with their "money train" steam engine running at full power this hill is just too strong to climb, and the best they can do is stay in place.
Everyone knows "they" (the rulers that run the world and this stock market) clearly want the next puppet to be Hillary as they fully control her and apparently don't control Trump. The statistic's on elections are a that "87% of the time if the stock market is up the 3 months going into the election the current party will be win" and "85% of the time if the stock market is down the 3 months in front of the election the opposite party will win". So of course they want a rally as Obummer is Democrat and so is Killary. If the market rallied strongly she'd have a 87% chance of winning and if it tanked Trump would have a 85% chance of winning. So where have we been the last several month? FLAT... No clear rally or clear bear market. This means the stock market doesn't "clearly" know which party is going to win, and that rarely happens.
Ok, so what about today you ask? We'll, that IH&S pattern is still in play and "if" they can clear that falling trendline there's not much resistance until about 2166-2168 from the high on 9/30, and then there's the 2172-2173 prior high on 9/22... and after that there's of course the prior tops to make the all time highs around 2182-2185. I think that's reaching but the 2172-2173 area seems possible. I personally just don't think "they" have enough steam to make a new all time high and run for 2200 and beyond... at least not today, and probably not anytime soon.
I'm more into thinking that they will just raise the trading range as they are at risk of losing a very important trendline of support on the daily chart of the SPX Cash. It connects from the 02/11/2106 low of 1810 to the low of 1991 on 06/27/2016 and is rising daily with a 2146 or so target today. If they lose that trendline on a daily close it's likely all she wrote for the bulls! So expanding the trading range a little higher on the futures is the only chance they have to save the SPX, and the market. It's still a long was until the November 8th election so I don't know if they can hold this pig up until then but they certainly look like they are going to try. I'm looking for more rangebound trading today as they do their best to hold the current opening level. I'm 50/50 on whether that falling trendline holds or breaks. It's a Monday, so expect light volume moves... and that's usually chop.

