
Good Monday Morning to everyone. With this being the "monthly option expiration" week I'd normally say that it's a bullish week about 80% or more of the time. But I think all those "old rules" don't apply anymore as the "weekly options" has changed all the dynamics around options. So I'll just keep it focused on the charts this week and ignore any preconceived idea that it must be a bullish week. I'll let the charts tell me if it's bullish or bearish with no bias either way.
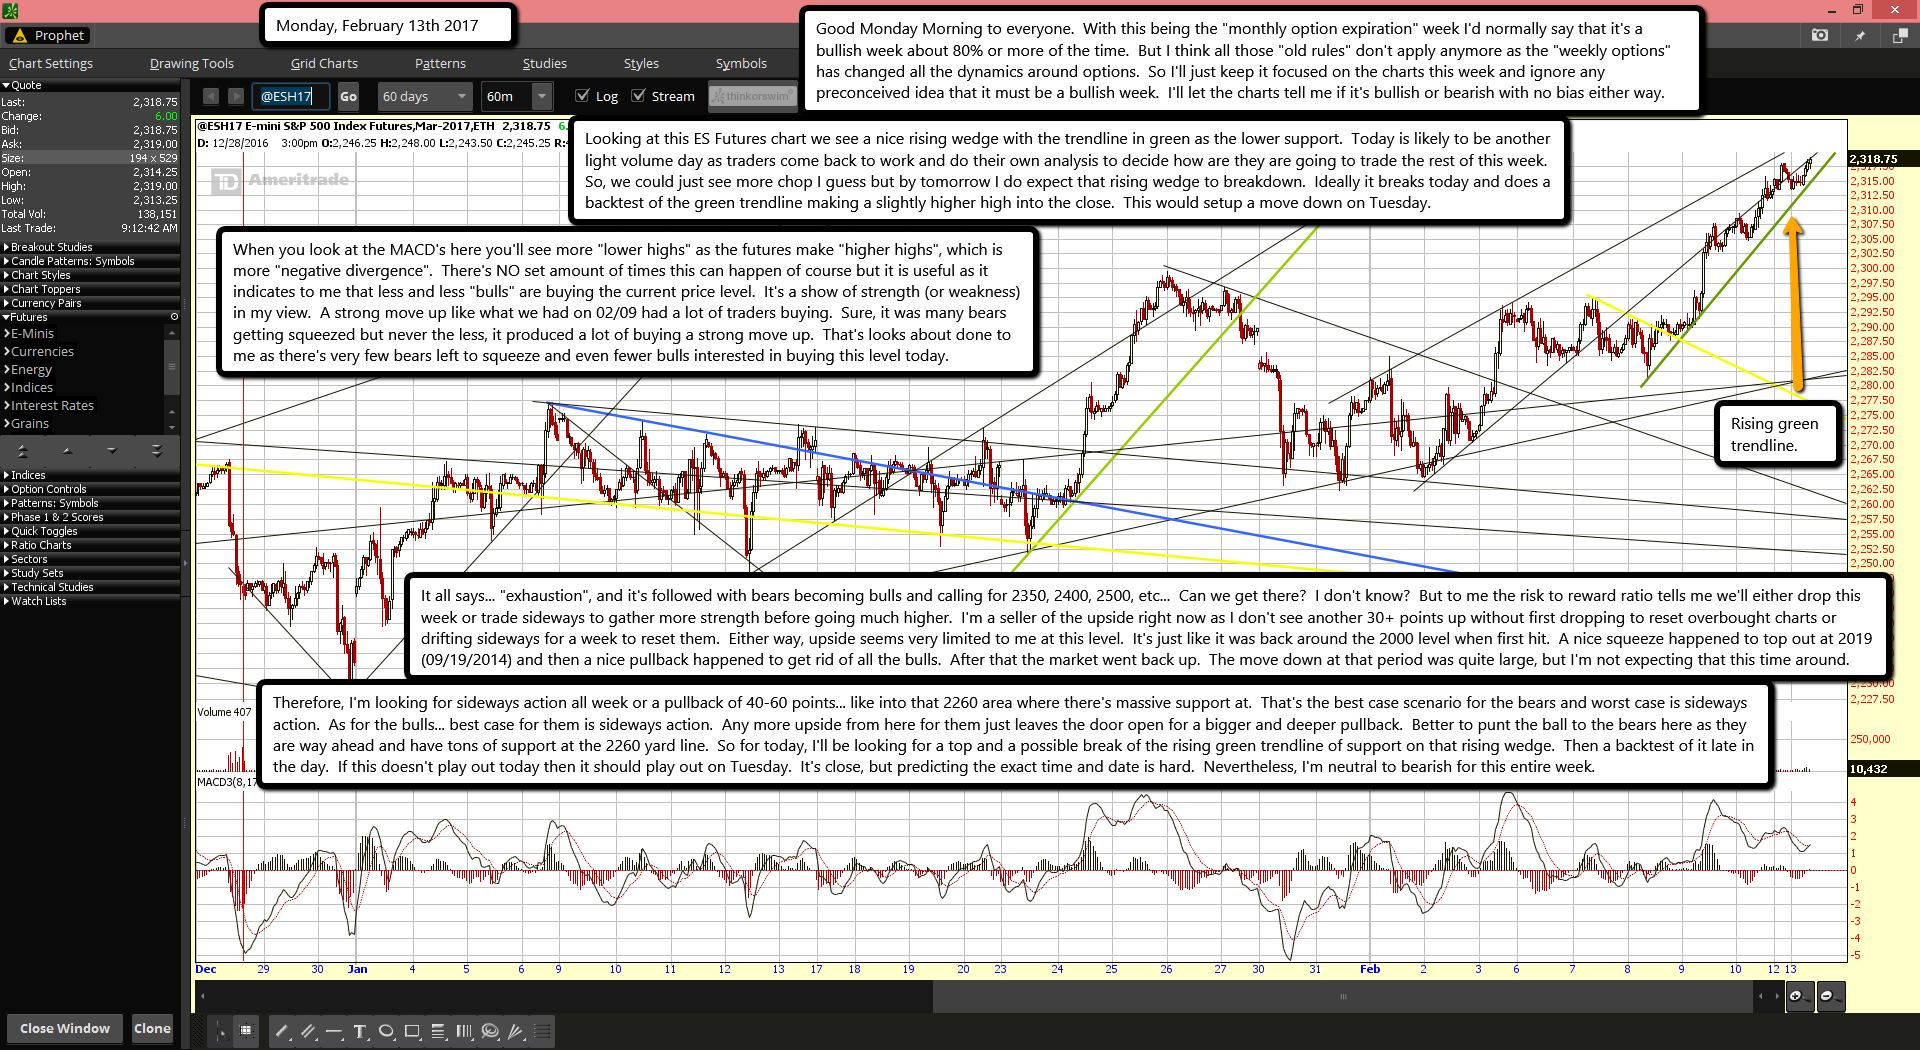
Looking at this ES Futures chart we see a nice rising wedge with the trendline in green as the lower support. Today is likely to be another light volume day as traders come back to work and do their own analysis to decide how are they are going to trade the rest of this week. So, we could just see more chop I guess but by tomorrow I do expect that rising wedge to breakdown. Ideally it breaks today and does a backtest of the green trendline making a slightly higher high into the close. This would setup a move down on Tuesday.
When you look at the MACD's here you'll see more "lower highs" as the futures make "higher highs", which is more "negative divergence". There's NO set amount of times this can happen of course but it is useful as it indicates to me that less and less "bulls" are buying the current price level. It's a show of strength (or weakness) in my view. A strong move up like what we had on 02/09 had a lot of traders buying. Sure, it was many bears getting squeezed but never the less, it produced a lot of buying a strong move up. That's looks about done to me as there's very few bears left to squeeze and even fewer bulls interested in buying this level today.
It all says... "exhaustion", and it's followed with bears becoming bulls and calling for 2350, 2400, 2500, etc... Can we get there? I don't know? But to me the risk to reward ratio tells me we'll either drop this week or trade sideways to gather more strength before going much higher. I'm a seller of the upside right now as I don't see another 30+ points up without first dropping to reset overbought charts or drifting sideways for a week to reset them. Either way, upside seems very limited to me at this level. It's just like it was back around the 2000 level when first hit. A nice squeeze happened to top out at 2019 (09/19/2014) and then a nice pullback happened to get rid of all the bulls. After that the market went back up. The move down at that period was quite large, but I'm not expecting that this time around.
Therefore, I'm looking for sideways action all week or a pullback of 40-60 points... like into that 2260 area where there's massive support at. That's the best case scenario for the bears and worst case is sideways action. As for the bulls... best case for them is sideways action. Any more upside from here for them just leaves the door open for a bigger and deeper pullback. Better to punt the ball to the bears here as they are way ahead and have tons of support at the 2260 yard line. So for today, I'll be looking for a top and a possible break of the rising green trendline of support on that rising wedge. Then a backtest of it late in the day. If this doesn't play out today then it should play out on Tuesday. It's close, but predicting the exact time and date is hard. Nevertheless, I'm neutral to bearish for this entire week.

