
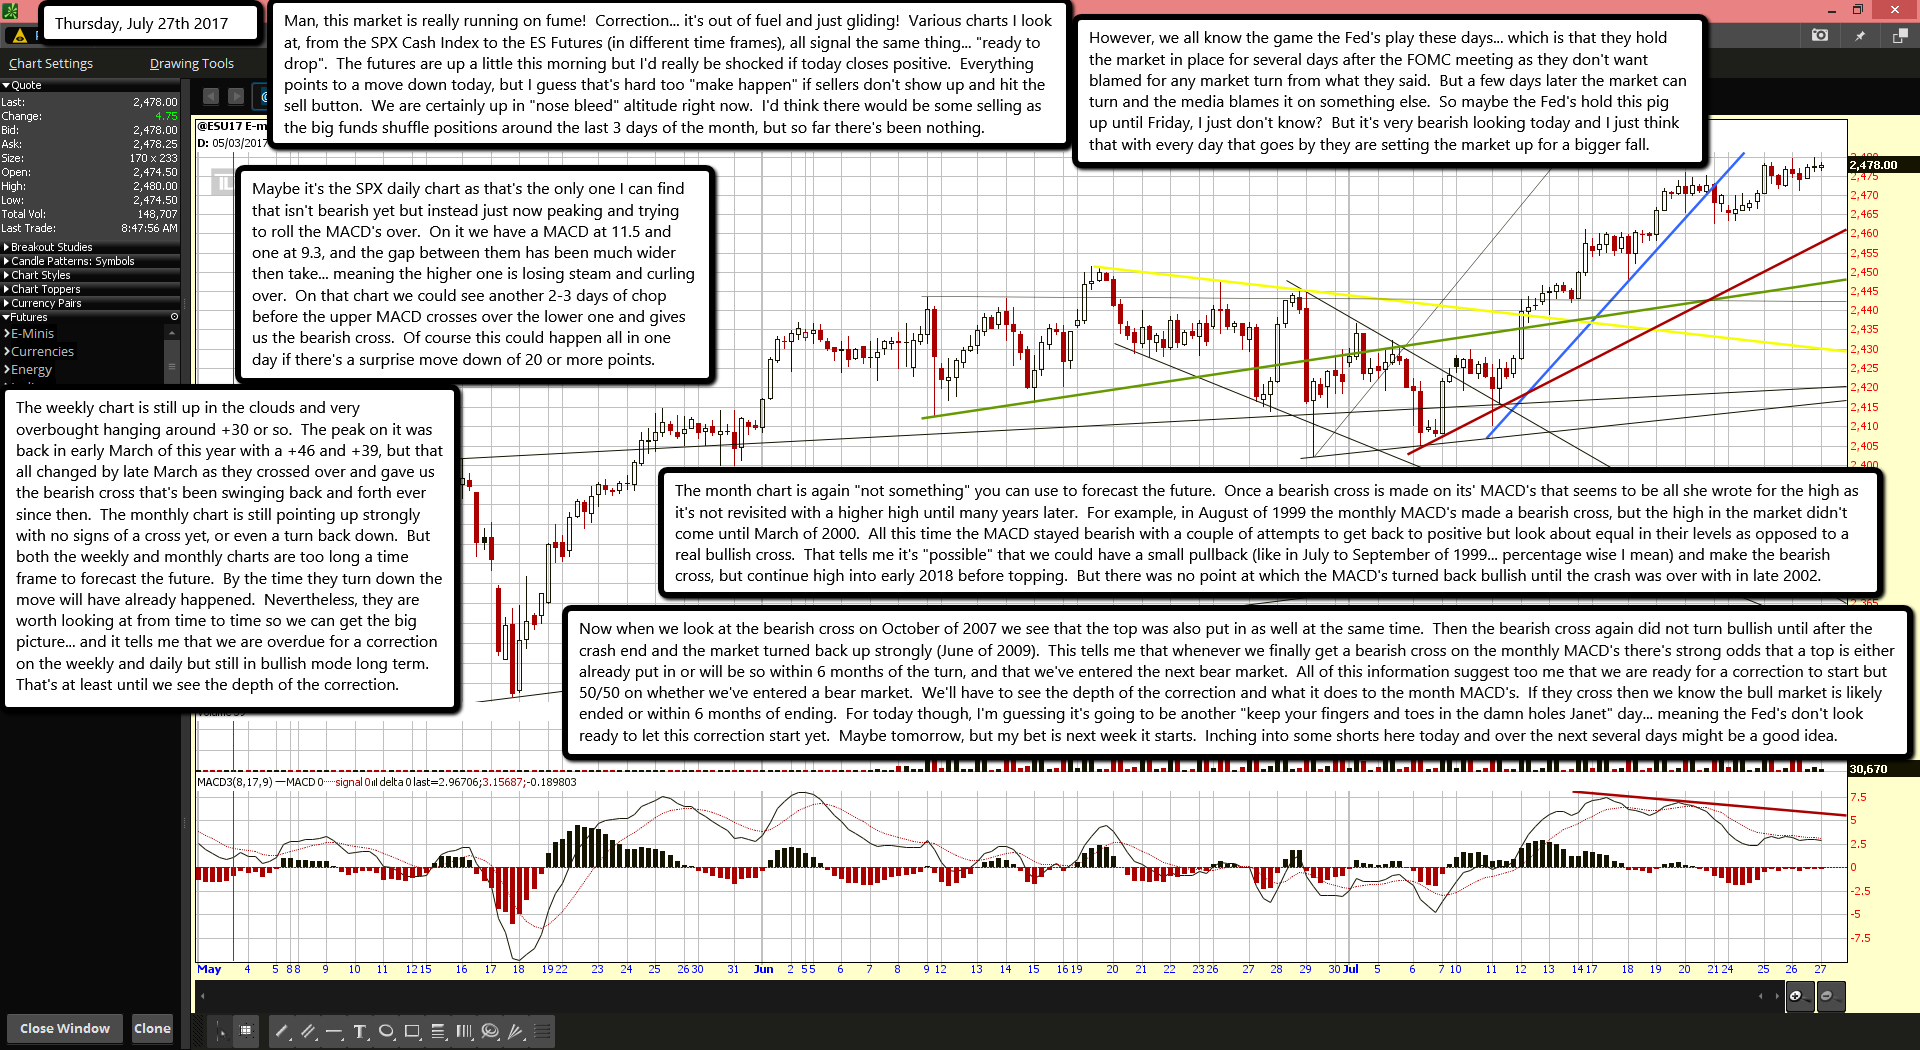
Man, this market is really running on fume! Correction... it's out of fuel and just gliding! Various charts I look at, from the SPX Cash Index to the ES Futures (in different time frames), all signal the same thing... "ready to drop". The futures are up a little this morning but I'd really be shocked if today closes positive. Everything points to a move down today, but I guess that's hard too "make happen" if sellers don't show up and hit the sell button. We are certainly up in "nose bleed" altitude right now. I'd think there would be some selling as the big funds shuffle positions around the last 3 days of the month, but so far there's been nothing.
However, we all know the game the Fed's play these days... which is that they hold the market in place for several days after the FOMC meeting as they don't want blamed for any market turn from what they said. But a few days later the market can turn and the media blames it on something else. So maybe the Fed's hold this pig up until Friday, I just don't know? But it's very bearish looking today and I just think that with every day that goes by they are setting the market up for a bigger fall.
Maybe it's the SPX daily chart as that's the only one I can find that isn't bearish yet but instead just now peaking and trying to roll the MACD's over. On it we have a MACD at 11.5 and one at 9.3, and the gap between them has been much wider then take... meaning the higher one is losing steam and curling over. On that chart we could see another 2-3 days of chop before the upper MACD crosses over the lower one and gives us the bearish cross. Of course this could happen all in one day if there's a surprise move down of 20 or more points.
The weekly chart is still up in the clouds and very overbought hanging around +30 or so. The peak on it was back in early March of this year with a +46 and +39, but that all changed by late March as they crossed over and gave us the bearish cross that's been swinging back and forth ever since then. The monthly chart is still pointing up strongly with no signs of a cross yet, or even a turn back down. But both the weekly and monthly charts are too long a time frame to forecast the future. By the time they turn down the move will have already happened. Nevertheless, they are worth looking at from time to time so we can get the big picture... and it tells me that we are overdue for a correction on the weekly and daily but still in bullish mode long term. That's at least until we see the depth of the correction.
The month chart is again "not something" you can use to forecast the future. Once a bearish cross is made on its' MACD's that seems to be all she wrote for the high as it's not revisited with a higher high until many years later. For example, in August of 1999 the monthly MACD's made a bearish cross, but the high in the market didn't come until March of 2000. All this time the MACD stayed bearish with a couple of attempts to get back to positive but look about equal in their levels as opposed to a real bullish cross. That tells me it's "possible" that we could have a small pullback (like in July to September of 1999... percentage wise I mean) and make the bearish cross, but continue high into early 2018 before topping. But there was no point at which the MACD's turned back bullish until the crash was over with in late 2002.
Now when we look at the bearish cross on October of 2007 we see that the top was also put in as well at the same time. Then the bearish cross again did not turn bullish until after the crash end and the market turned back up strongly (June of 2009). This tells me that whenever we finally get a bearish cross on the monthly MACD's there's strong odds that a top is either already put in or will be so within 6 months of the turn, and that we've entered the next bear market. All of this information suggest too me that we are ready for a correction to start but 50/50 on whether we've entered a bear market. We'll have to see the depth of the correction and what it does to the month MACD's. If they cross then we know the bull market is likely ended or within 6 months of ending. For today though, I'm guessing it's going to be another "keep your fingers and toes in the damn holes Janet" day... meaning the Fed's don't look ready to let this correction start yet. Maybe tomorrow, but my bet is next week it starts. Inching into some shorts here today and over the next several days might be a good idea.

