
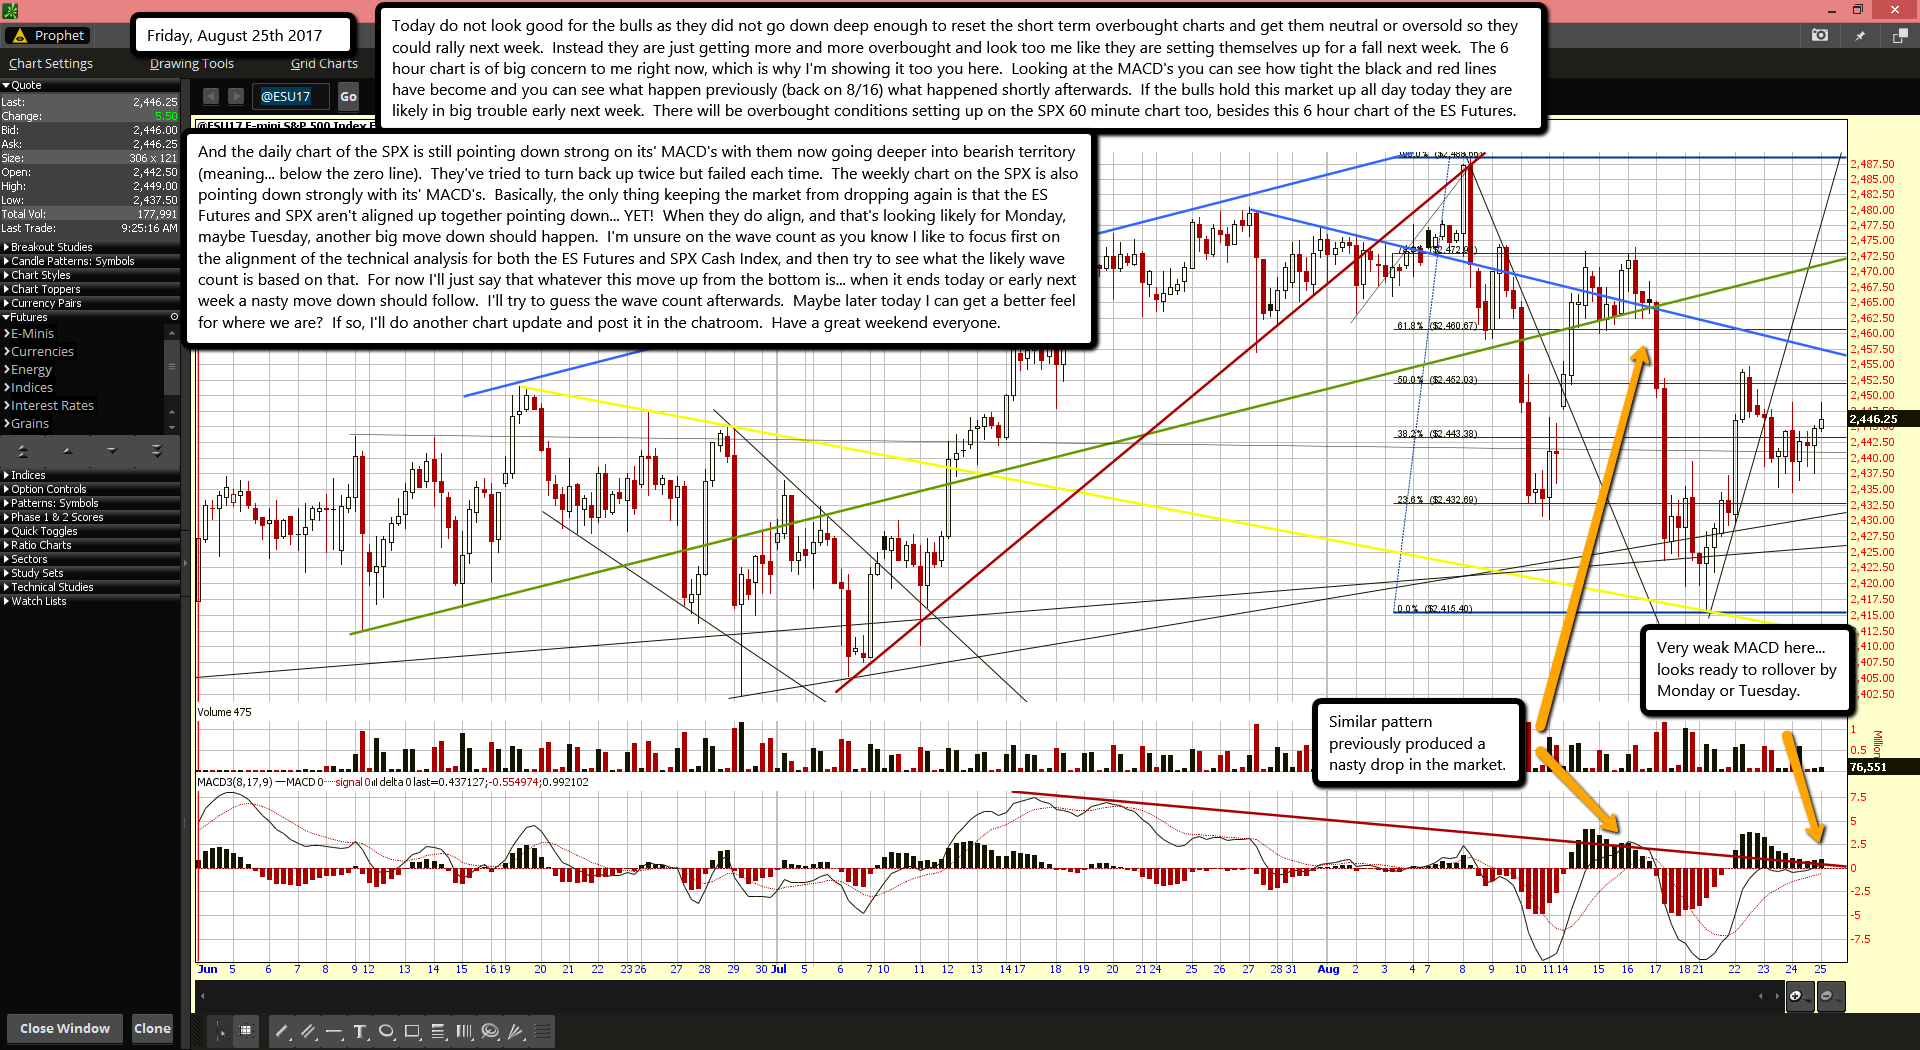
Today do not look good for the bulls as they did not go down deep enough to reset the short term overbought charts and get them neutral or oversold so they could rally next week. Instead they are just getting more and more overbought and look too me like they are setting themselves up for a fall next week. The 6 hour chart is of big concern to me right now, which is why I'm showing it too you here. Looking at the MACD's you can see how tight the black and red lines have become and you can see what happen previously (back on 8/16) what happened shortly afterwards. If the bulls hold this market up all day today they are likely in big trouble early next week. There will be overbought conditions setting up on the SPX 60 minute chart too, besides this 6 hour chart of the ES Futures.
And the daily chart of the SPX is still pointing down strong on its' MACD's with them now going deeper into bearish territory (meaning... below the zero line). They've tried to turn back up twice but failed each time. The weekly chart on the SPX is also pointing down strongly with its' MACD's. Basically, the only thing keeping the market from dropping again is that the ES Futures and SPX aren't aligned up together pointing down... YET! When they do align, and that's looking likely for Monday, maybe Tuesday, another big move down should happen. I'm unsure on the wave count as you know I like to focus first on the alignment of the technical analysis for both the ES Futures and SPX Cash Index, and then try to see what the likely wave count is based on that. For now I'll just say that whatever this move up from the bottom is... when it ends today or early next week a nasty move down should follow. I'll try to guess the wave count afterwards. Maybe later today I can get a better feel for where we are? If so, I'll do another chart update and post it in the chatroom. Have a great weekend everyone.

