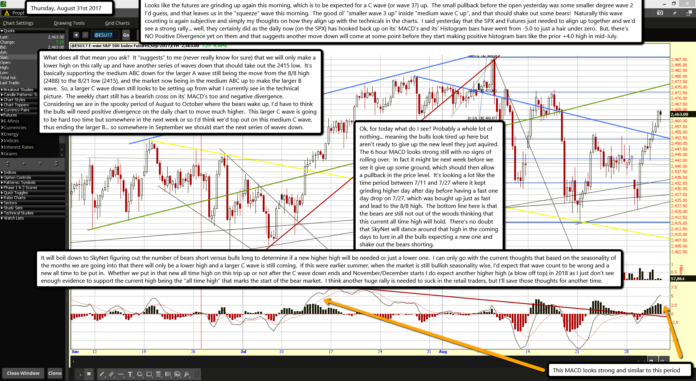
Looks like the futures are grinding up again this morning, which is to be expected for a C wave (or wave 3?) up. The small pullback before the open yesterday was some smaller degree wave 2 I'd guess, and that leaves us in the "squeeze" wave this morning. The good ol' "smaller wave 3 up" inside "medium wave C up", and that should shake out some bears! Naturally this wave counting is again subjective and simply my thoughts on how they align up with the technicals in the charts. I said yesterday that the SPX and Futures just needed to align up together and we'd see a strong rally... well, they certainly did as the daily now (on the SPX) has hooked back up on its' MACD's and its' Histogram bars have went from -5.0 to just a hair under zero. But, there's NO Positive Divergence yet on them and that suggests another move down will come at some point before they start making positive histogram bars like the prior +4.0 high in mid-July.
What does all that mean you ask? It "suggests" to me (never really know for sure) that we will only make a lower high on this rally up and have another series of waves down that should take out the 2415 low. It's basically supporting the medium ABC down for the larger A wave still being the move from the 8/8 high (2488) to the 8/21 low (2415), and the market now being in the medium ABC up to make the larger B wave. So, a larger C wave down still looks to be setting up from what I currently see in the technical picture. The weekly chart still has a bearish cross on its' MACD's too and negative divergence. Considering we are in the spooky period of August to October where the bears wake up, I'd have to think the bulls will need positive divergence on the daily chart to move much higher. This larger C wave is going to be hard too time but somewhere in the next week or so I'd think we'd top out on this medium C wave, thus ending the larger B... so somewhere in September we should start the next series of waves down.
Ok, for today what do I see? Probably a whole lot of nothing... meaning the bulls look tired up here but aren't ready to give up the new level they just aquired. The 6 hour MACD looks strong still with no signs of rolling over. In fact it might be next week before we see it give up some ground, which should then allow a pullback in the price level. It's looking a lot like the time period between 7/11 and 7/27 where it kept grinding higher day after day before having a fast one day drop on 7/27, which was bought up just as fast and lead to the 8/8 high. The bottom line here is that the bears are still not out of the woods thinking that this current all time high will hold. There's no doubt that SkyNet will dance around that high in the coming days to lure in all the bulls expecting a new one and shake out the bears shorting.
It will boil down to SkyNet figuring out the number of bears short versus bulls long to determine if a new higher high will be needed or just a lower one. I can only go with the current thoughts that based on the seasonality of the months we are going into that there will only be a lower high and a larger C wave is still coming. If this were earlier summer, when the market is still bullish seasonality wise, I'd expect that wave count to be wrong and a new all time to be put in. Whether we put in that new all time high on this trip up or not after the C wave down ends and November/December starts I do expect another higher high (a blow off top) in 2018 as I just don't see enough evidence to support the current high being the "all time high" that marks the start of the bear market. I think another huge rally is needed to suck in the retail traders, but I'll save those thoughts for another time.


