
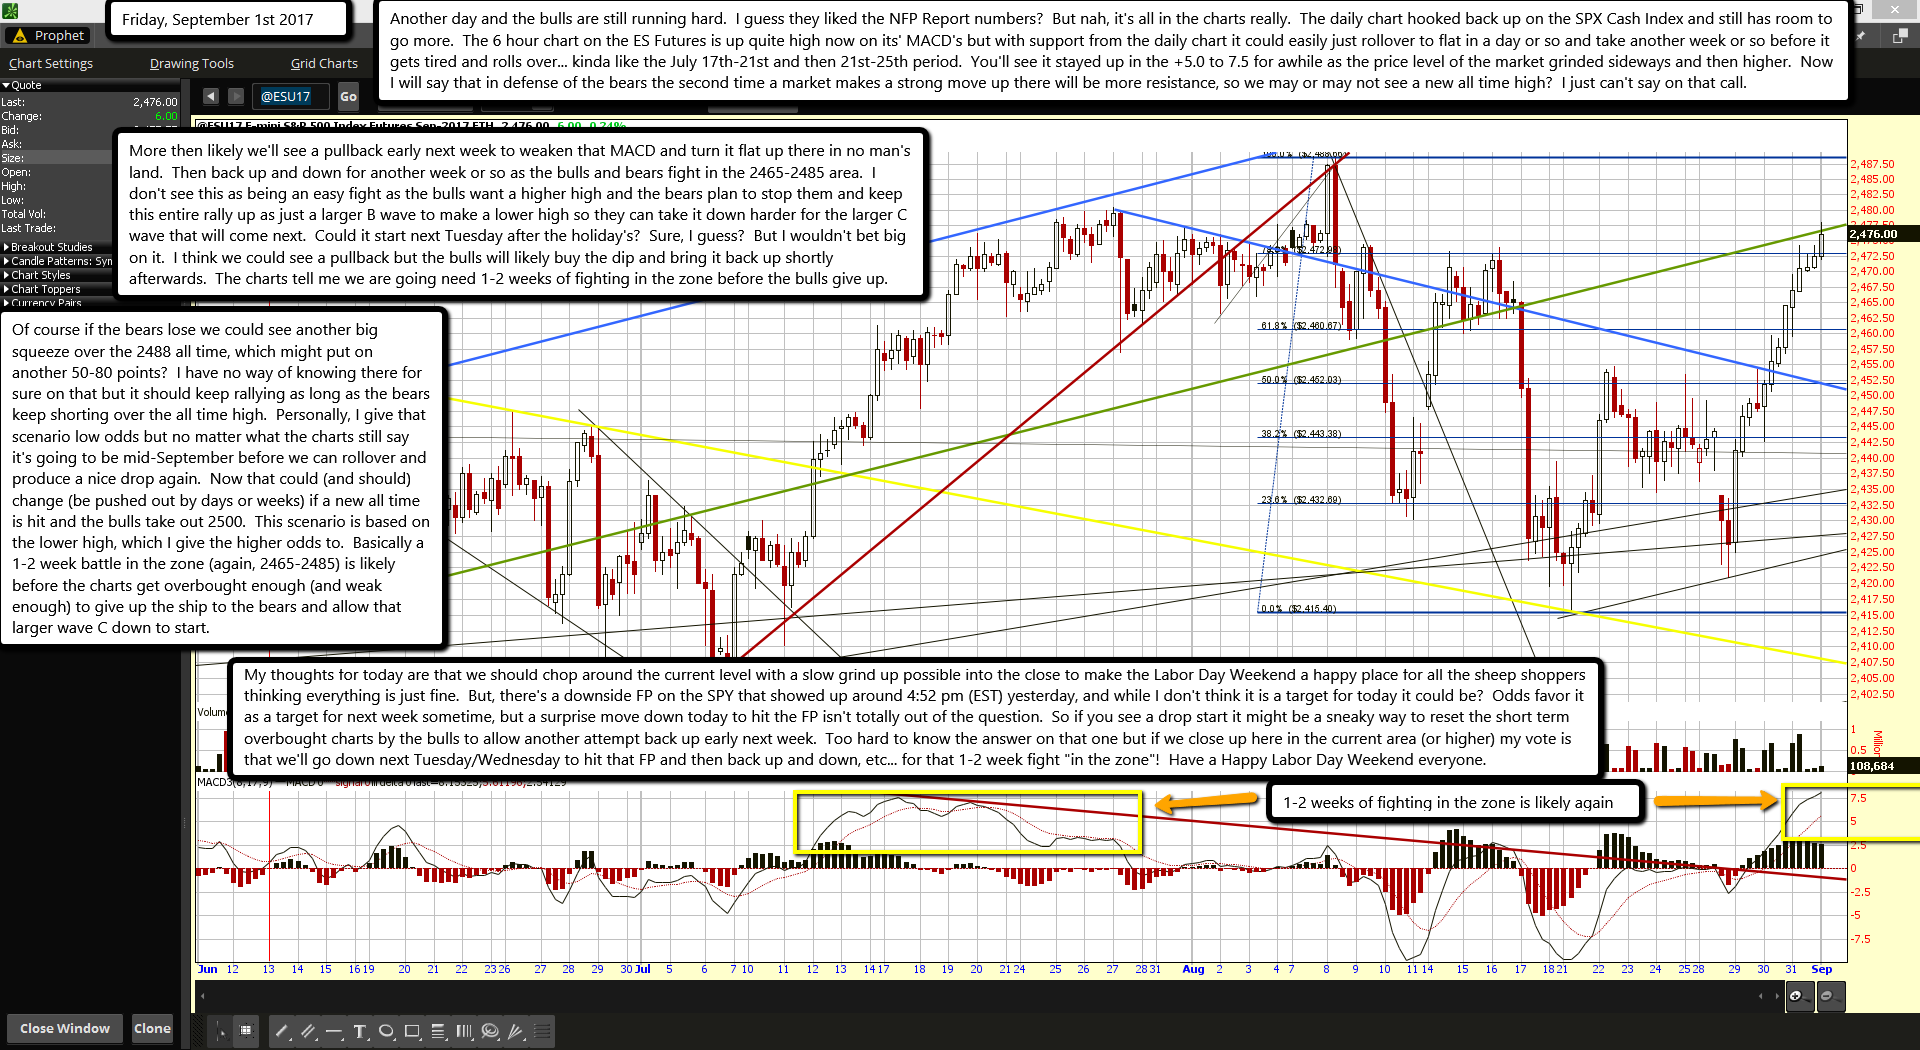
Another day and the bulls are still running hard. I guess they liked the NFP Report numbers? But nah, it's all in the charts really. The daily chart hooked back up on the SPX Cash Index and still has room to go more. The 6 hour chart on the ES Futures is up quite high now on its' MACD's but with support from the daily chart it could easily just rollover to flat in a day or so and take another week or so before it gets tired and rolls over... kinda like the July 17th-21st and then 21st-25th period. You'll see it stayed up in the +5.0 to 7.5 for awhile as the price level of the market grinded sideways and then higher. Now I will say that in defense of the bears the second time a market makes a strong move up there will be more resistance, so we may or may not see a new all time high? I just can't say on that call.
More then likely we'll see a pullback early next week to weaken that MACD and turn it flat up there in no man's land. Then back up and down for another week or so as the bulls and bears fight in the 2465-2485 area. I don't see this as being an easy fight as the bulls want a higher high and the bears plan to stop them and keep this entire rally up as just a larger B wave to make a lower high so they can take it down harder for the larger C wave that will come next. Could it start next Tuesday after the holiday's? Sure, I guess? But I wouldn't bet big on it. I think we could see a pullback but the bulls will likely buy the dip and bring it back up shortly afterwards. The charts tell me we are going need 1-2 weeks of fighting in the zone before the bulls give up.
Of course if the bears lose we could see another big squeeze over the 2488 all time, which might put on another 50-80 points? I have no way of knowing there for sure on that but it should keep rallying as long as the bears keep shorting over the all time high. Personally, I give that scenario low odds but no matter what the charts still say it's going to be mid-September before we can rollover and produce a nice drop again. Now that could (and should) change (be pushed out by days or weeks) if a new all time is hit and the bulls take out 2500. This scenario is based on the lower high, which I give the higher odds to. Basically a 1-2 week battle in the zone (again, 2465-2485) is likely before the charts get overbought enough (and weak enough) to give up the ship to the bears and allow that larger wave C down to start.
My thoughts for today are that we should chop around the current level with a slow grind up possible into the close to make the Labor Day Weekend a happy place for all the sheep shoppers thinking everything is just fine. But, there's a downside FP on the SPY that showed up around 4:52 pm (EST) yesterday, and while I don't think it is a target for today it could be? Odds favor it as a target for next week sometime, but a surprise move down today to hit the FP isn't totally out of the question. So if you see a drop start it might be a sneaky way to reset the short term overbought charts by the bulls to allow another attempt back up early next week. Too hard to know the answer on that one but if we close up here in the current area (or higher) my vote is that we'll go down next Tuesday/Wednesday to hit that FP and then back up and down, etc... for that 1-2 week fight "in the zone"! Have a Happy Labor Day Weekend everyone.

