
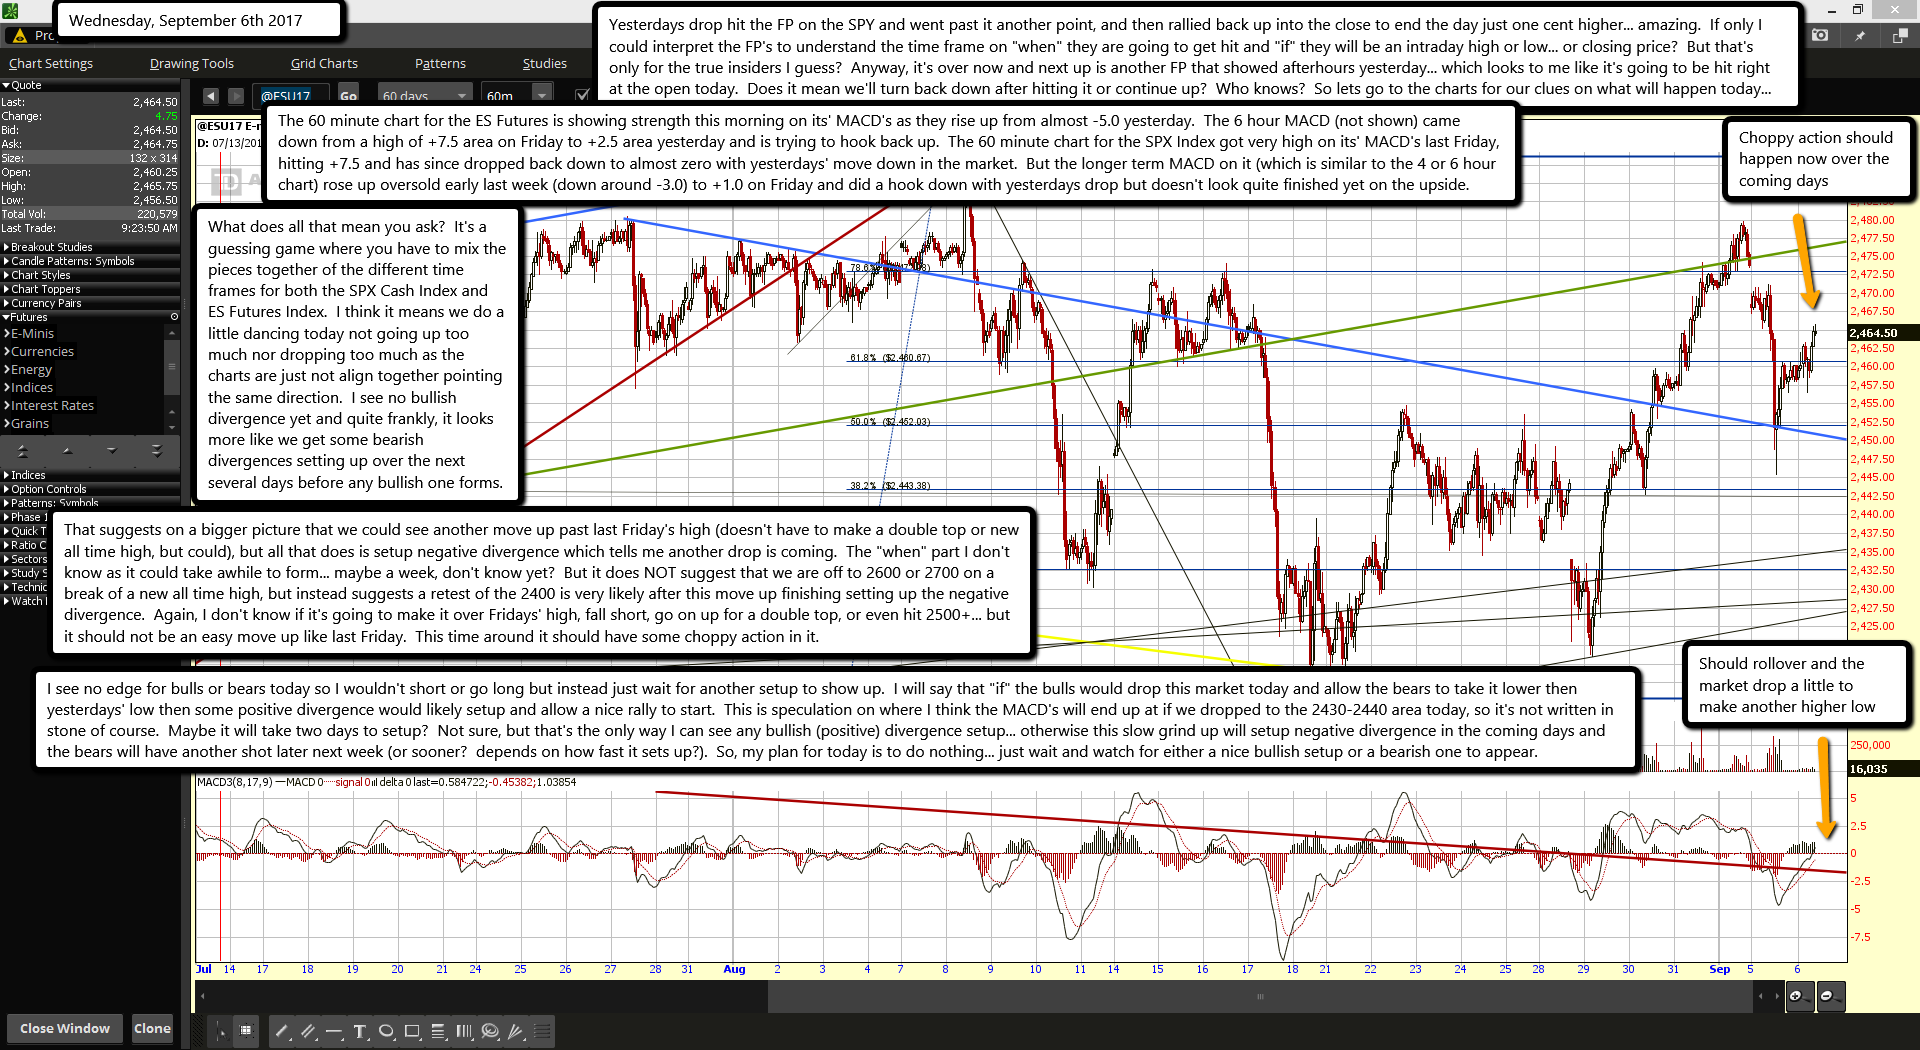
Yesterdays drop hit the FP on the SPY and went past it another point, and then rallied back up into the close to end the day just one cent higher... amazing. If only I could interpret the FP's to understand the time frame on "when" they are going to get hit and "if" they will be an intraday high or low... or closing price? But that's only for the true insiders I guess? Anyway, it's over now and next up is another FP that showed afterhours yesterday... which looks to me like it's going to be hit right at the open today. Does it mean we'll turn back down after hitting it or continue up? Who knows? So lets go to the charts for our clues on what will happen today...
The 60 minute chart for the ES Futures is showing strength this morning on its' MACD's as they rise up from almost -5.0 yesterday. The 6 hour MACD (not shown) came down from a high of +7.5 area on Friday to +2.5 area yesterday and is trying to hook back up. The 60 minute chart for the SPX Index got very high on its' MACD's last Friday, hitting +7.5 and has since dropped back down to almost zero with yesterdays' move down in the market. But the longer term MACD on it (which is similar to the 4 or 6 hour chart) rose up oversold early last week (down around -3.0) to +1.0 on Friday and did a hook down with yesterdays drop but doesn't look quite finished yet on the upside.
What does all that mean you ask? It's a guessing game where you have to mix the pieces together of the different time frames for both the SPX Cash Index and ES Futures Index. I think it means we do a little dancing today not going up too much nor dropping too much as the charts are just not align together pointing the same direction. I see no bullish divergence yet and quite frankly, it looks more like we get some bearish divergences setting up over the next several days before any bullish one forms.
That suggests on a bigger picture that we could see another move up past last Friday's high (doesn't have to make a double top or new all time high, but could), but all that does is setup negative divergence which tells me another drop is coming. The "when" part I don't know as it could take awhile to form... maybe a week, don't know yet? But it does NOT suggest that we are off to 2600 or 2700 on a break of a new all time high, but instead suggests a retest of the 2400 is very likely after this move up finishing setting up the negative divergence. Again, I don't know if it's going to make it over Fridays' high, fall short, go on up for a double top, or even hit 2500+... but it should not be an easy move up like last Friday. This time around it should have some choppy action in it.
I see no edge for bulls or bears today so I wouldn't short or go long but instead just wait for another setup to show up. I will say that "if" the bulls would drop this market today and allow the bears to take it lower then yesterdays' low then some positive divergence would likely setup and allow a nice rally to start. This is speculation on where I think the MACD's will end up at if we dropped to the 2430-2440 area today, so it's not written in stone of course. Maybe it will take two days to setup? Not sure, but that's the only way I can see any bullish (positive) divergence setup... otherwise this slow grind up will setup negative divergence in the coming days and the bears will have another shot later next week (or sooner? depends on how fast it sets up?). So, my plan for today is to do nothing... just wait and watch for either a nice bullish setup or a bearish one to appear.

