
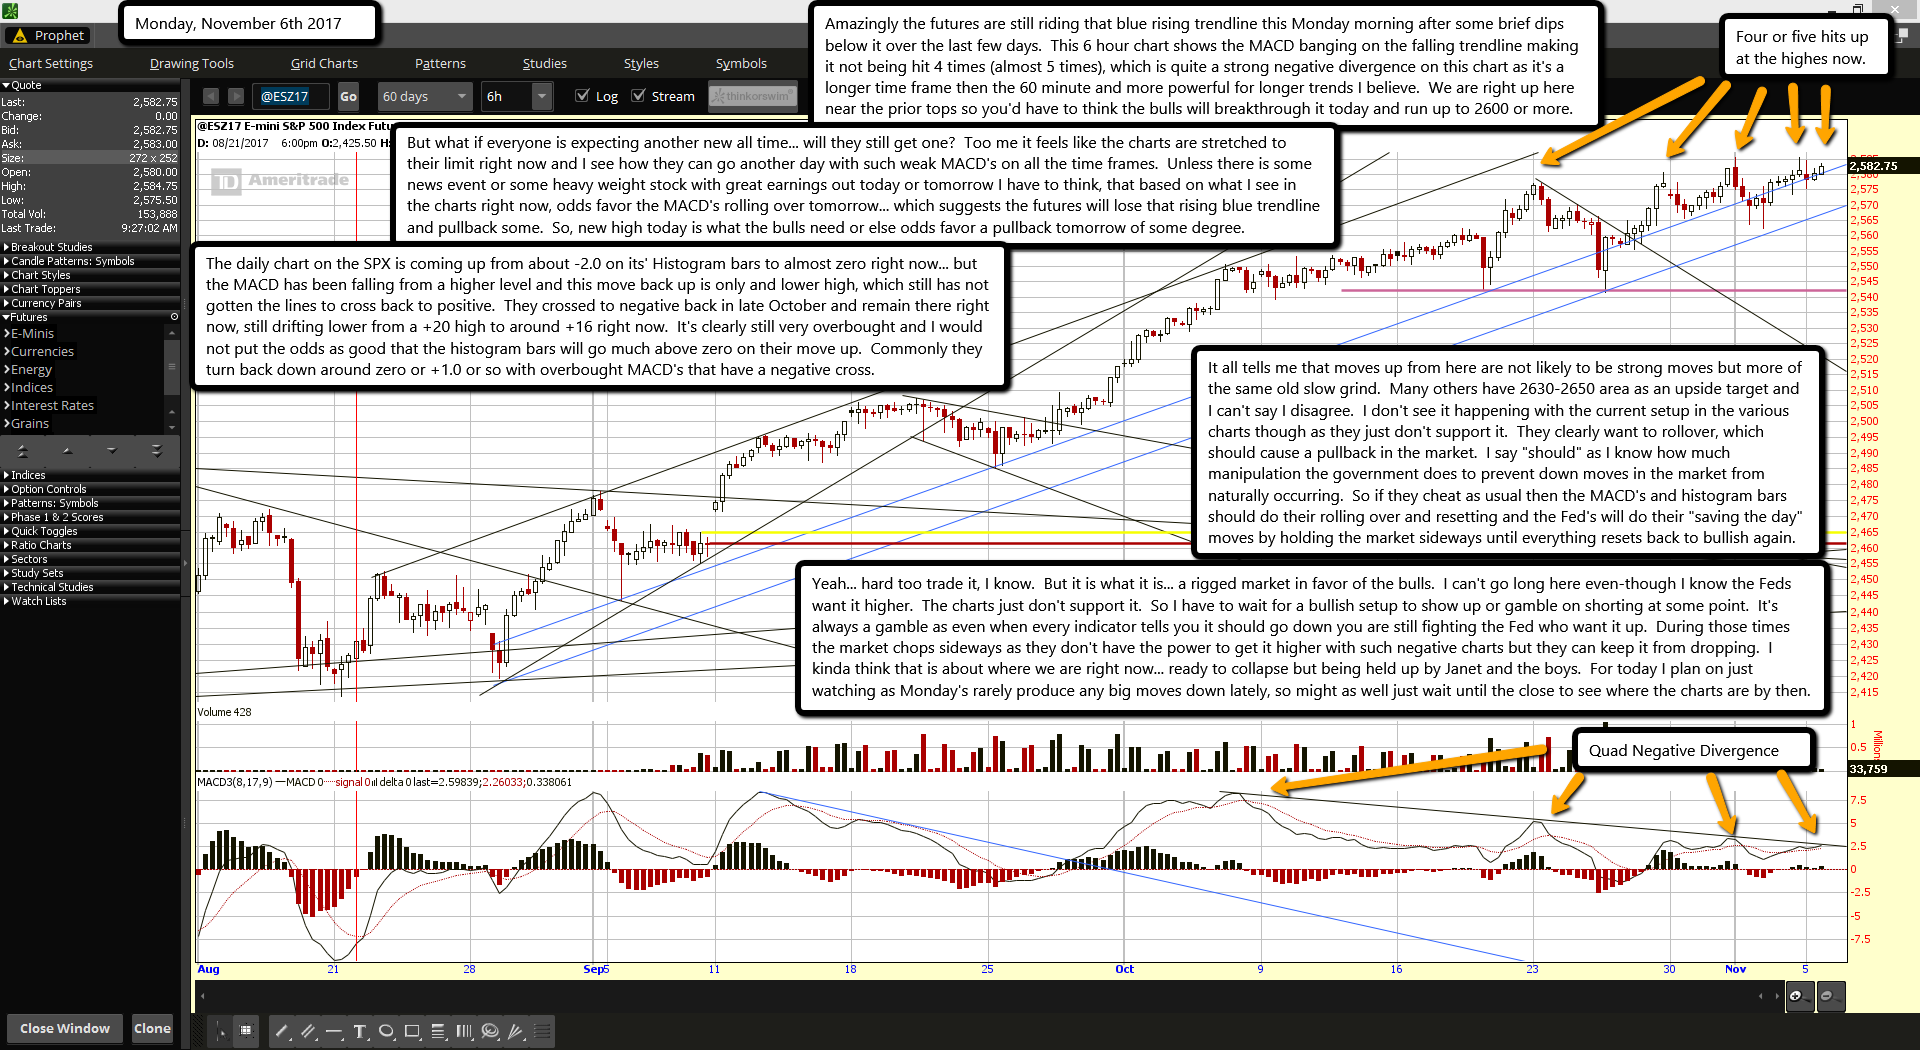
Amazingly the futures are still riding that blue rising trendline this Monday morning after some brief dips below it over the last few days. This 6 hour chart shows the MACD banging on the falling trendline making it not being hit 4 times (almost 5 times), which is quite a strong negative divergence on this chart as it's a longer time frame then the 60 minute and more powerful for longer trends I believe. We are right up here near the prior tops so you'd have to think the bulls will breakthrough it today and run up to 2600 or more.
But what if everyone is expecting another new all time... will they still get one? Too me it feels like the charts are stretched to their limit right now and I see how they can go another day with such weak MACD's on all the time frames. Unless there is some news event or some heavy weight stock with great earnings out today or tomorrow I have to think, that based on what I see in the charts right now, odds favor the MACD's rolling over tomorrow... which suggests the futures will lose that rising blue trendline and pullback some. So, new high today is what the bulls need or else odds favor a pullback tomorrow of some degree.
The daily chart on the SPX is coming up from about -2.0 on its' Histogram bars to almost zero right now... but the MACD has been falling from a higher level and this move back up is only and lower high, which still has not gotten the lines to cross back to positive. They crossed to negative back in late October and remain there right now, still drifting lower from a +20 high to around +16 right now. It's clearly still very overbought and I would not put the odds as good that the histogram bars will go much above zero on their move up. Commonly they turn back down around zero or +1.0 or so with overbought MACD's that have a negative cross.
It all tells me that moves up from here are not likely to be strong moves but more of the same old slow grind. Many others have 2630-2650 area as an upside target and I can't say I disagree. I don't see it happening with the current setup in the various charts though as they just don't support it. They clearly want to rollover, which should cause a pullback in the market. I say "should" as I know how much manipulation the government does to prevent down moves in the market from naturally occurring. So if they cheat as usual then the MACD's and histogram bars should do their rolling over and resetting and the Fed's will do their "saving the day" moves by holding the market sideways until everything resets back to bullish again.
Yeah... hard too trade it, I know. But it is what it is... a rigged market in favor of the bulls. I can't go long here even-though I know the Feds want it higher. The charts just don't support it. So I have to wait for a bullish setup to show up or gamble on shorting at some point. It's always a gamble as even when every indicator tells you it should go down you are still fighting the Fed who want it up. During those times the market chops sideways as they don't have the power to get it higher with such negative charts but they can keep it from dropping. I kinda think that is about where we are right now... ready to collapse but being held up by Janet and the boys. For today I plan on just watching as Monday's rarely produce any big moves down lately, so might as well just wait until the close to see where the charts are by then.

