
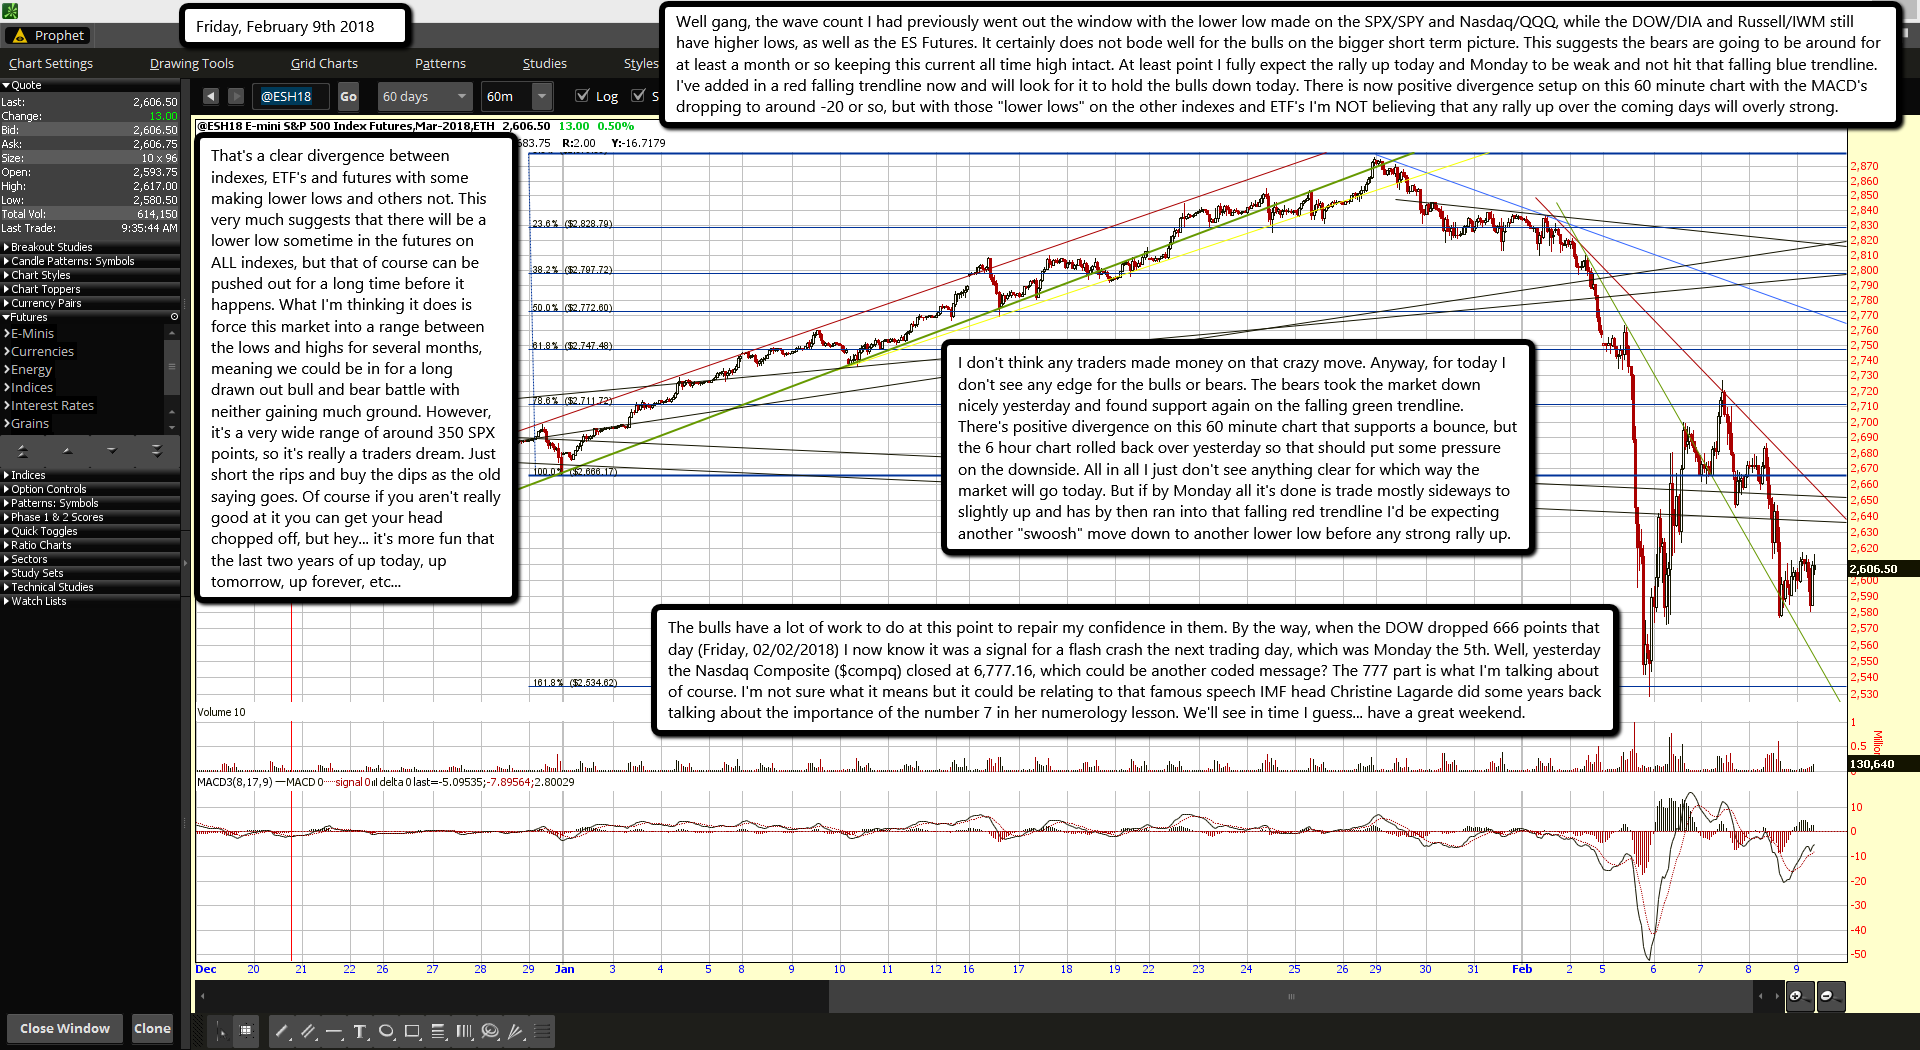
Well gang, the wave count I had previously went out the window with the lower low made on the SPX/SPY and Nasdaq/QQQ, while the DOW/DIA and Russell/IWM still have higher lows, as well as the ES Futures. It certainly does not bode well for the bulls on the bigger short term picture. This suggests the bears are going to be around for at least a month or so keeping this current all time high intact. At least point I fully expect the rally up today and Monday to be weak and not hit that falling blue trendline. I've added in a red falling trendline now and will look for it to hold the bulls down today. There is now positive divergence setup on this 60 minute chart with the MACD's dropping to around -20 or so, but with those "lower lows" on the other indexes and ETF's I'm NOT believing that any rally up over the coming days will overly strong.
That's a clear divergence between indexes, ETF's and futures with some making lower lows and others not. This very much suggests that there will be a lower low sometime in the futures on ALL indexes, but that of course can be pushed out for a long time before it happens. What I'm thinking it does is force this market into a range between the lows and highs for several months, meaning we could be in for a long drawn out bull and bear battle with neither gaining much ground. However, it's a very wide range of around 350 SPX points, so it's really a traders dream. Just short the rips and buy the dips as the old saying goes. Of course if you aren't really good at it you can get your head chopped off, but hey... it's more fun that the last two years of up today, up tomorrow, up forever, etc...
I don't think any traders made money on that crazy move. Anyway, for today I don't see any edge for the bulls or bears. The bears took the market down nicely yesterday and found support again on the falling green trendline. There's positive divergence on this 60 minute chart that supports a bounce, but the 6 hour chart rolled back over yesterday so that should put some pressure on the downside. All in all I just don't see anything clear for which way the market will go today. But if by Monday all it's done is trade mostly sideways to slightly up and has by then ran into that falling red trendline I'd be expecting another "swoosh" move down to another lower low before any strong rally up.
The bulls have a lot of work to do at this point to repair my confidence in them. By the way, when the DOW dropped 666 points that day (Friday, 02/02/2018) I now know it was a signal for a flash crash the next trading day, which was Monday the 5th. Well, yesterday the Nasdaq Composite ($compq) closed at 6,777.16, which could be another coded message? The 777 part is what I'm talking about of course. I'm not sure what it means but it could be relating to that famous speech IMF head Christine Lagarde did some years back talking about the importance of the number 7 in her numerology lesson. We'll see in time I guess... have a great weekend.

