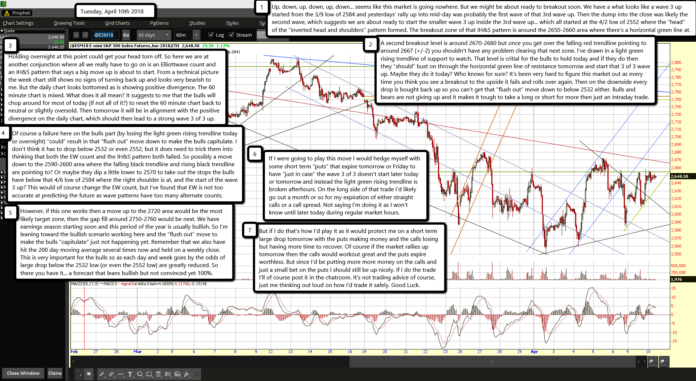
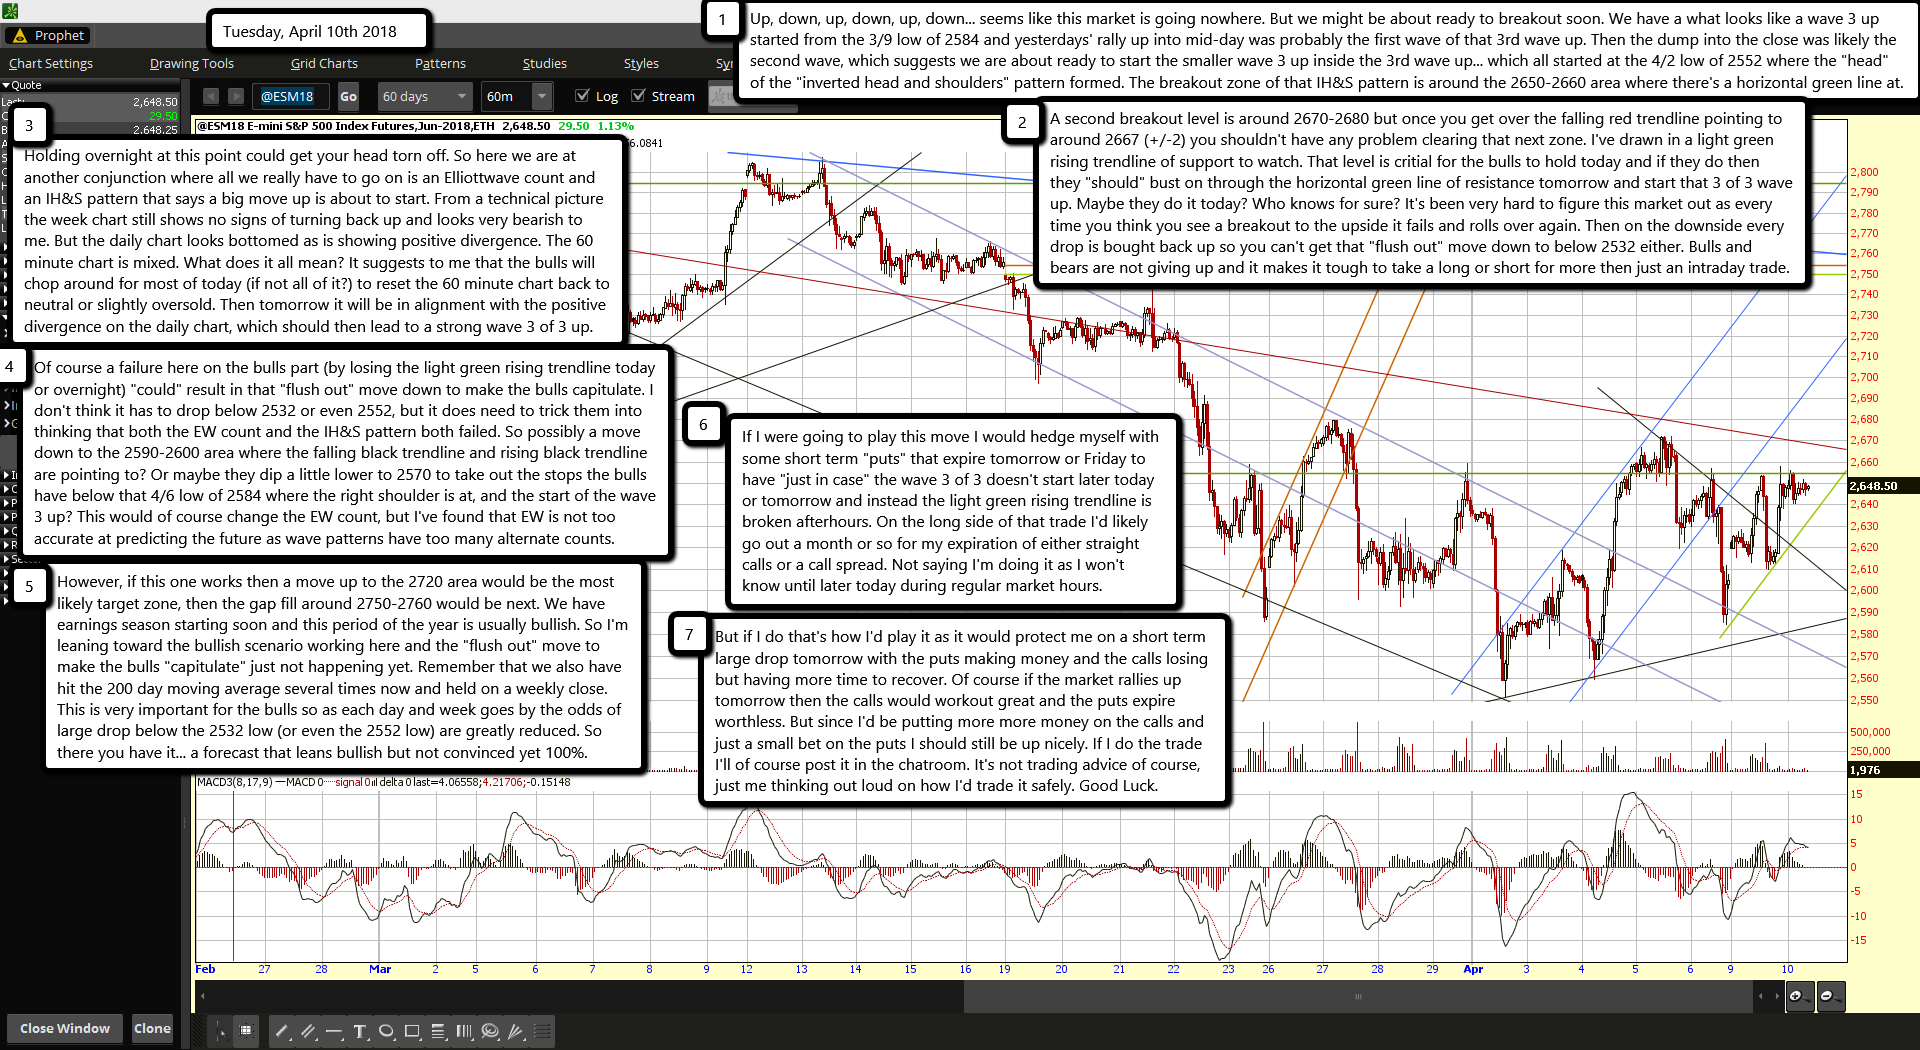
Up, down, up, down, up, down... seems like this market is going nowhere. But we might be about ready to breakout soon. We have a what looks like a wave 3 up started from the 3/9 low of 2584 and yesterdays' rally up into mid-day was probably the first wave of that 3rd wave up. Then the dump into the close was likely the second wave, which suggests we are about ready to start the smaller wave 3 up inside the 3rd wave up... which all started at the 4/2 low of 2552 where the "head" of the "inverted head and shoulders" pattern formed. The breakout zone of that IH&S pattern is around the 2650-2660 area where there's a horizontal green line at.
A second breakout level is around 2670-2680 but once you get over the falling red trendline pointing to around 2667 (+/-2) you shouldn't have any problem clearing that next zone. I've drawn in a light green rising trendline of support to watch. That level is critial for the bulls to hold today and if they do then they "should" bust on through the horizontal green line of resistance tomorrow and start that 3 of 3 wave up. Maybe they do it today? Who knows for sure? It's been very hard to figure this market out as every time you think you see a breakout to the upside it fails and rolls over again. Then on the downside every drop is bought back up so you can't get that "flush out" move down to below 2532 either. Bulls and bears are not giving up and it makes it tough to take a long or short for more then just an intraday trade.
Holding overnight at this point could get your head torn off. So here we are at another conjunction where all we really have to go on is an Elliottwave count and an IH&S pattern that says a big move up is about to start. From a technical picture the week chart still shows no signs of turning back up and looks very bearish to me. But the daily chart looks bottomed as is showing positive divergence. The 60 minute chart is mixed. What does it all mean? It suggests to me that the bulls will chop around for most of today (if not all of it?) to reset the 60 minute chart back to neutral or slightly oversold. Then tomorrow it will be in alignment with the positive divergence on the daily chart, which should then lead to a strong wave 3 of 3 up.
Of course a failure here on the bulls part (by losing the light green rising trendline today or overnight) "could" result in that "flush out" move down to make the bulls capitulate. I don't think it has to drop below 2532 or even 2552, but it does need to trick them into thinking that both the EW count and the IH&S pattern both failed. So possibly a move down to the 2590-2600 area where the falling black trendline and rising black trendline are pointing to? Or maybe they dip a little lower to 2570 to take out the stops the bulls have below that 4/6 low of 2584 where the right shoulder is at, and the start of the wave 3 up? This would of course change the EW count, but I've found that EW is not too accurate at predicting the future as wave patterns have too many alternate counts.
However, if this one works then a move up to the 2720 area would be the most likely target zone, then the gap fill around 2750-2760 would be next. We have earnings season starting soon and this period of the year is usually bullish. So I'm leaning toward the bullish scenario working here and the "flush out" move to make the bulls "capitulate" just not happening yet. Remember that we also have hit the 200 day moving average several times now and held on a weekly close. This is very important for the bulls so as each day and week goes by the odds of large drop below the 2532 low (or even the 2552 low) are greatly reduced. So there you have it... a forecast that leans bullish but not convinced yet 100%.
If I were going to play this move I would hedge myself with some short term "puts" that expire tomorrow or Friday to have "just in case" the wave 3 of 3 doesn't start later today or tomorrow and instead the light green rising trendline is broken afterhours. On the long side of that trade I'd likely go out a month or so for my expiration of either straight calls or a call spread. Not saying I'm doing it as I won't know until later today during regular market hours.
But if I do that's how I'd play it as it would protect me on a short term large drop tomorrow with the puts making money and the calls losing but having more time to recover. Of course if the market rallies up tomorrow then the calls would workout great and the puts expire worthless. But since I'd be putting more more money on the calls and just a small bet on the puts I should still be up nicely. If I do the trade I'll of course post it in the chatroom. It's not trading advice of course, just me thinking out loud on how I'd trade it safely. Good Luck.


