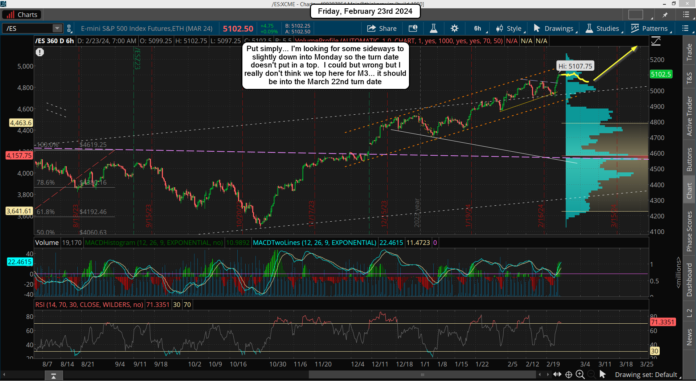
The market continued to squeeze higher yesterday putting in a 100+ point move and making a new all time high. Looking back at different wave counts I've done I think the one that we are most likely on right now is the Extended Alternative Bullish Wave Count - February 18th 2024.
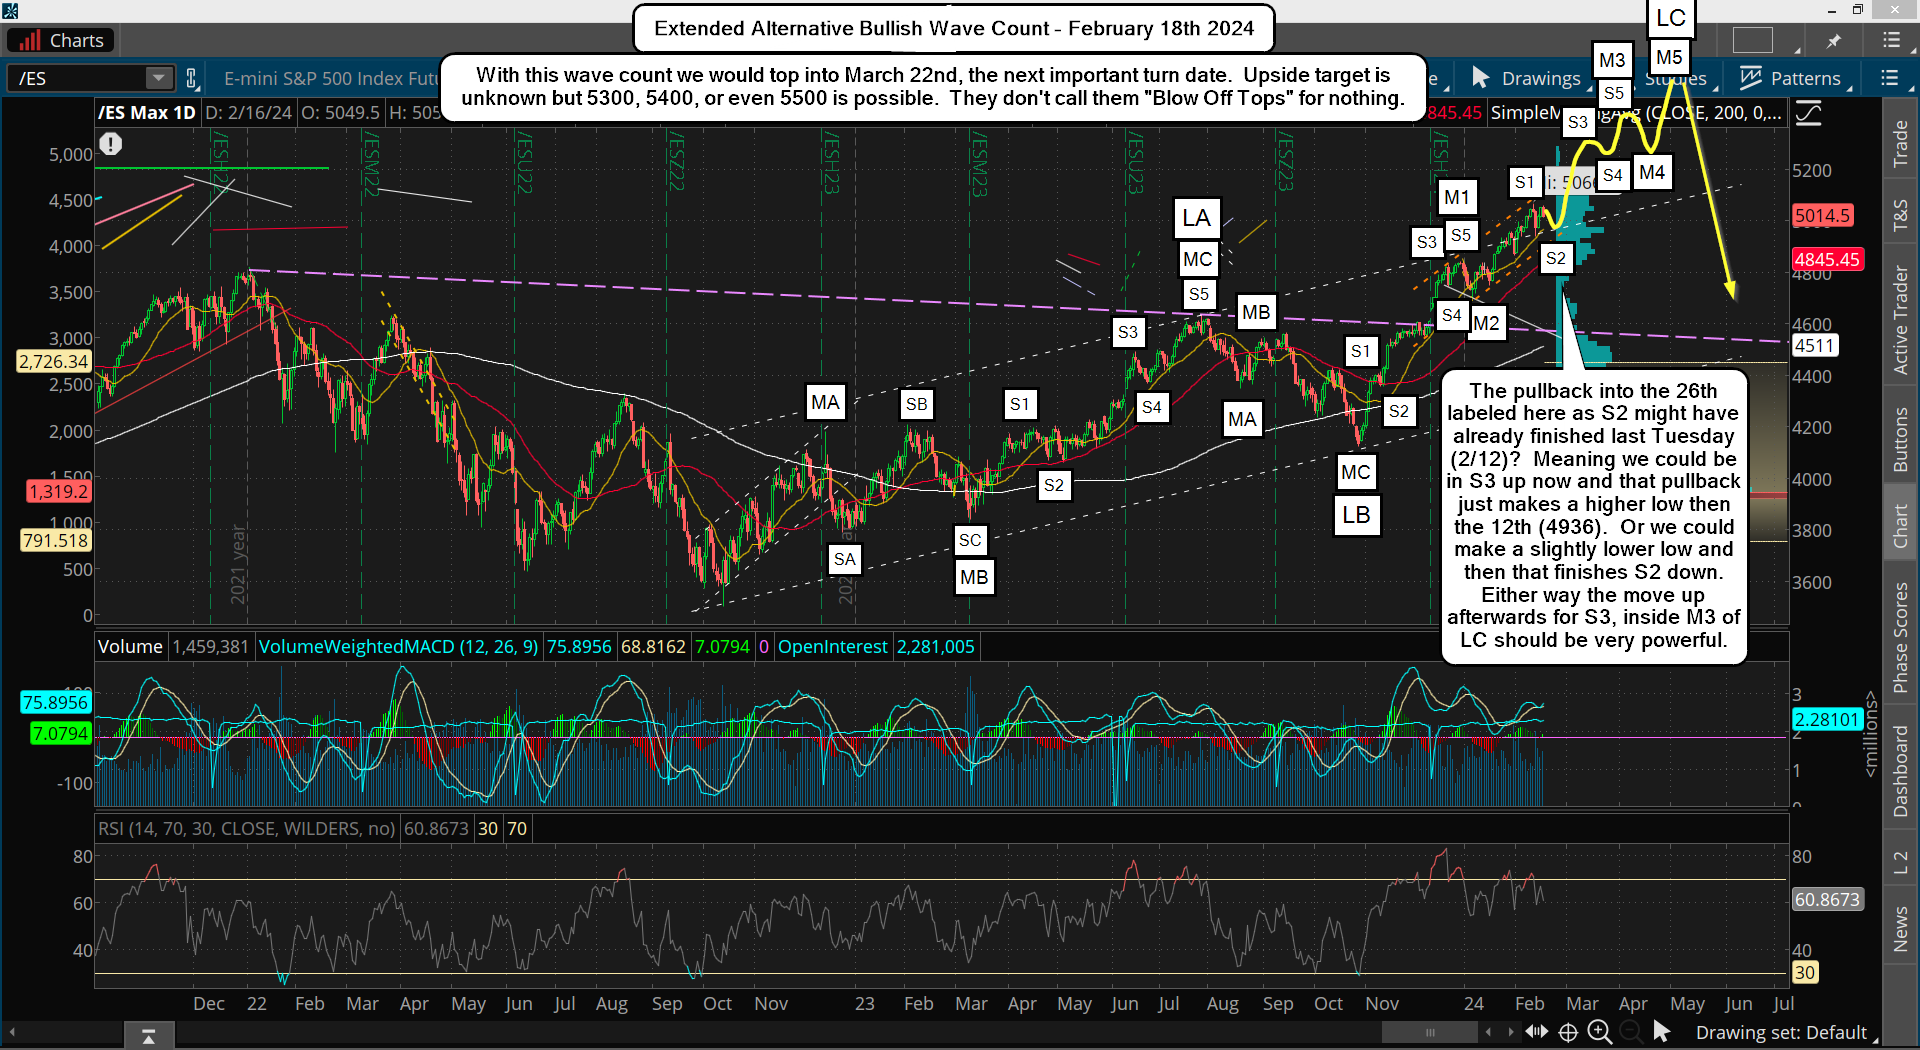
On that chart I have Medium Wave 1 topping on 12/29 at 4841, then M2 bottoming on 1/5 at 4702, which puts us inside a Medium Wave 3 up from that low. Small Wave 1 up ended on 2/12 at the 5066 high, and that's where an ABC pullback happened into yesterdays low of 4959. That means we are inside Small Wave 3 up right now. Below is that chart that I did on February 18th.
If I'm right on that count then we will likely subdivide into 5 Tiny Waves inside Small Wave 3 up, which we probably completed Tiny Wave 1 up at yesterdays high. Meaning that we should pullback small (20-40 points?) today and into Monday for Tiny Wave 2, which would be perfect for the turn date on the 25th/26th as then it would indeed put in a low (higher low, but a low never the less).
This would setup the rest of next week for Tiny Wave 3 up, inside Small Wave 3 up, inside Medium Wave 3 up, inside Large Wave C up... to continue the rally higher into March 22nd, the next important turn date. Below is a close up of that chart...
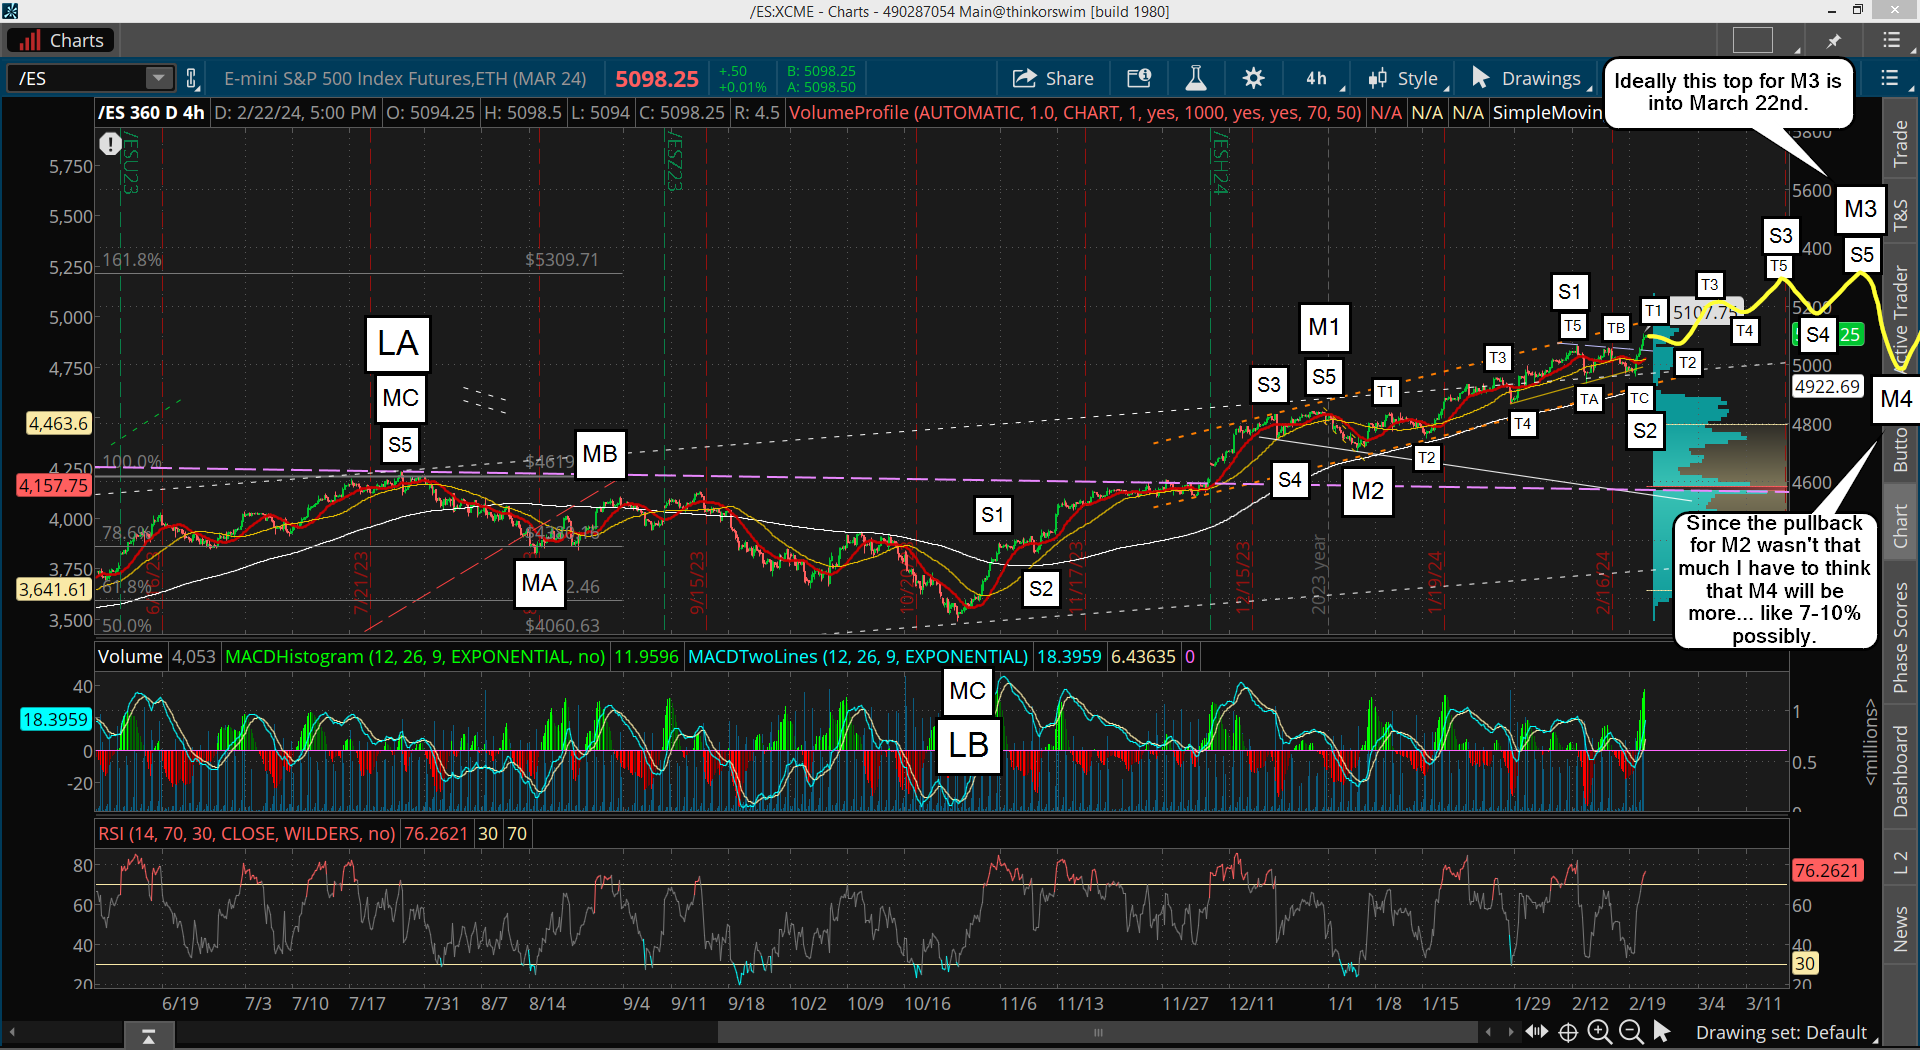
As you can see on that chart I'm not looking for a lot for Tiny Wave 2 into next Monday. From there (if this all plays out as it's always a "best guess") we should grind higher in a Tiny Wave 3 up, then 4 down and 5 up to complete Small Wave 3 up. A pullback for Tiny Wave 4 should follow and then more slightly higher high for Small Wave 5, which will complete Medium Wave 3 up.
This should look a lot like all the prior patterns going back in time that I covered on my "Weekend Update – A Study Of The 161.8 Fibonacci Extension" post, which commonly shows a high for the 161.8% getting "almost" hit, then a pullback, and a final higher high that pierces through it. That will be the S3 high, S4 pullback and Small Wave 5 pierce. Then a good pullback will follow.
I did a projection for the target high using that 161.8% method and it points to 5309, which was created from the 3502 low to the 4619 high. That points to 5309, but I also decide to do another one from the 4122 low (MC of LB) to the 4841 high (S5 of M1), and that projects 5286... so somewhere in that zone is where the top for M3 should appear.
Moving on... after the close we got a FP of 505.76 on the SPY, which I think will be the pullback low for Tiny Wave 2 today, or Monday.
Have a great weekend.


