

Last Friday played out pretty much as expected, which was a follow through to the upside in the morning and fade back to flat by the close. I said last week that if this happened we would have completed Tiny Wave 1 up inside Small Wave 3, inside Medium Wave 3. It's always a "best guess" on the smaller degree waves, so I'm going to re-adjust them a little because of how much time is left before the next major turn date on March 22nd (which obviously isn't very much).
I think that early this week we should pullback to around 5050 on the ES. And since this entire week is normally a bearish period according to the Seasonality Chart, we could see a full week of range-bound moves to shake out both bulls and bears before we start the next trend move up.
Many subdividing waves might be the plan inside these Tiny Waves while the short term overbought charts reset. So even if we put in a low of say 5050 on Monday it could be revisited later in the week to make a higher low of a few points, which would be (again) to shake out bulls and lure in bears. It's the first week of March that is bullish, so that should be where the market starts another squeeze higher I think. Here's the wave count with the new adjustments...
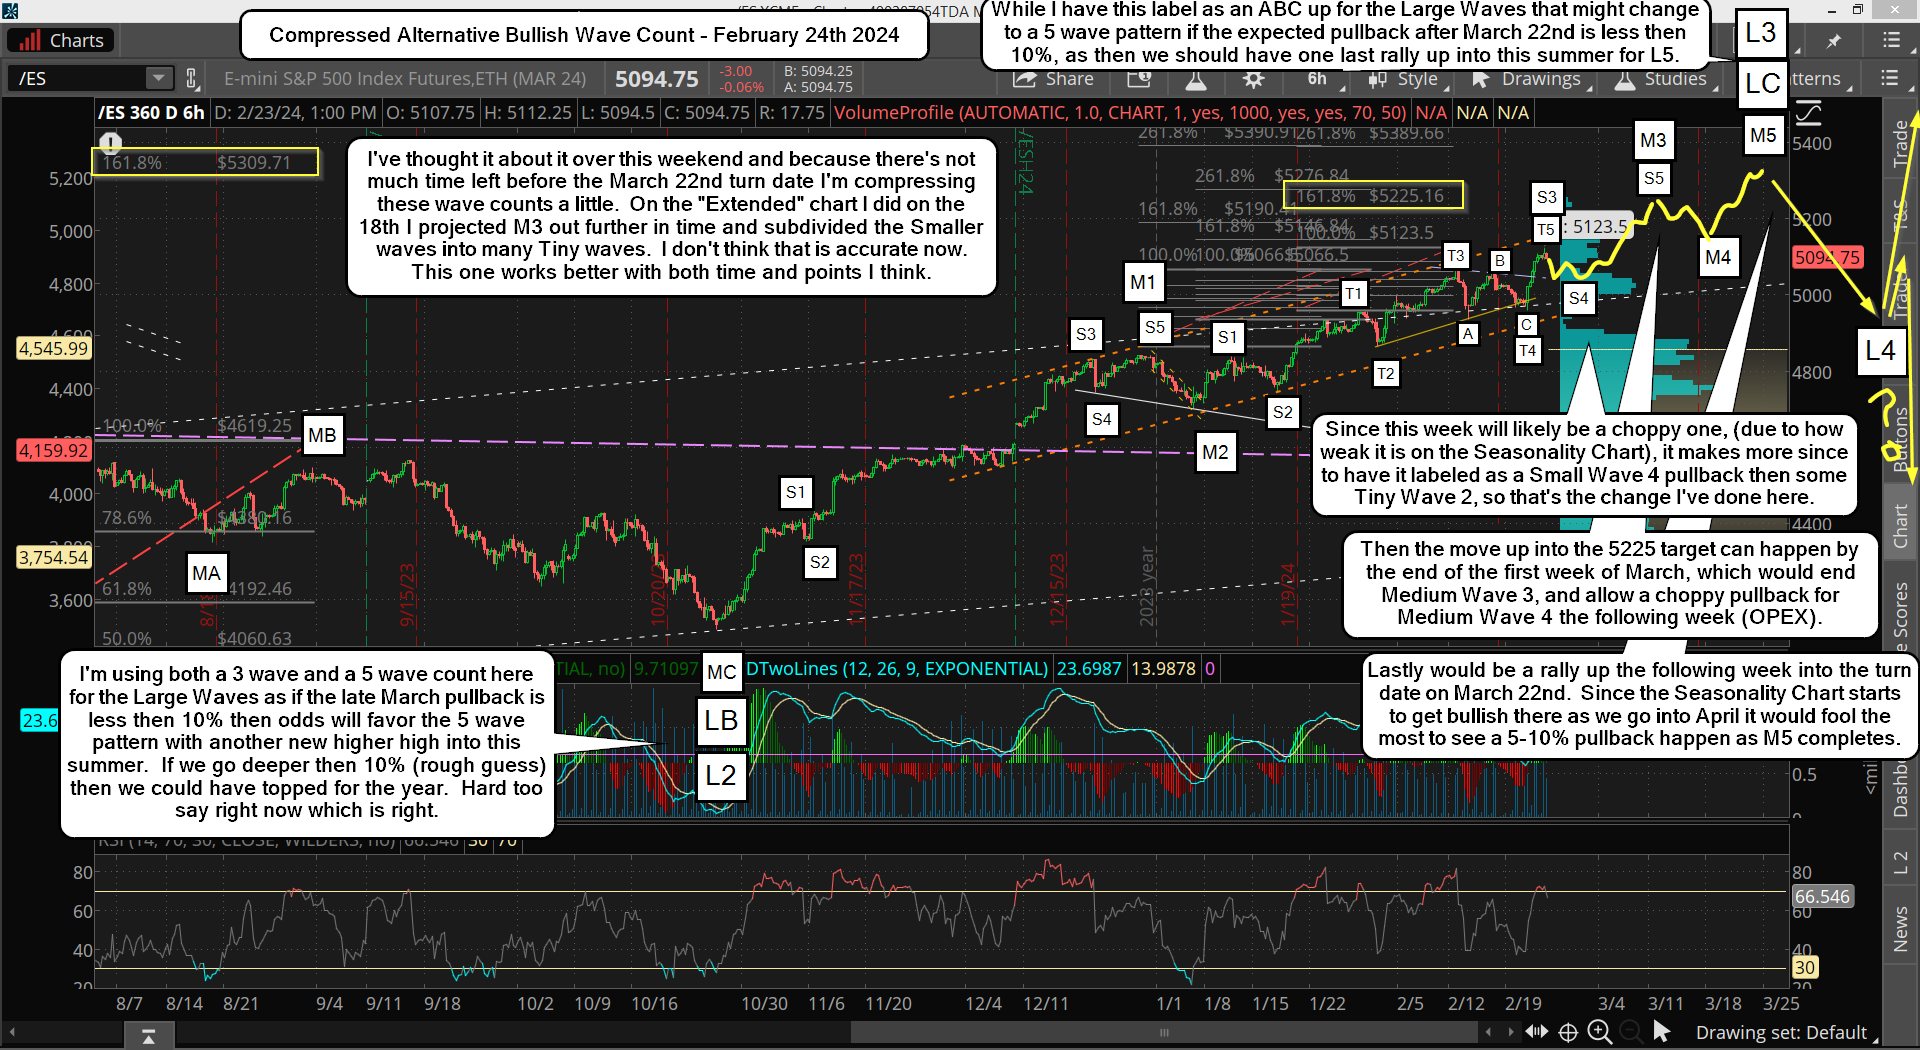
My short term upside target is around 5225, which is based off my 161.8% system, whereas I'm assuming we'll pullback to 5050 this week to allow me to get a projection from the 4959 low on 2/21 up to the 5123 high on 2/23 that would make "the A leg" part of the ABC pattern, which I covered on my weekend update post about the 161.8% extension last weekend.
These "legs" are not my Elliottwave count, but I had to give them some kind of name, so I'm calling them A, B, and C legs to make and complete a pattern. Here's that chart below...
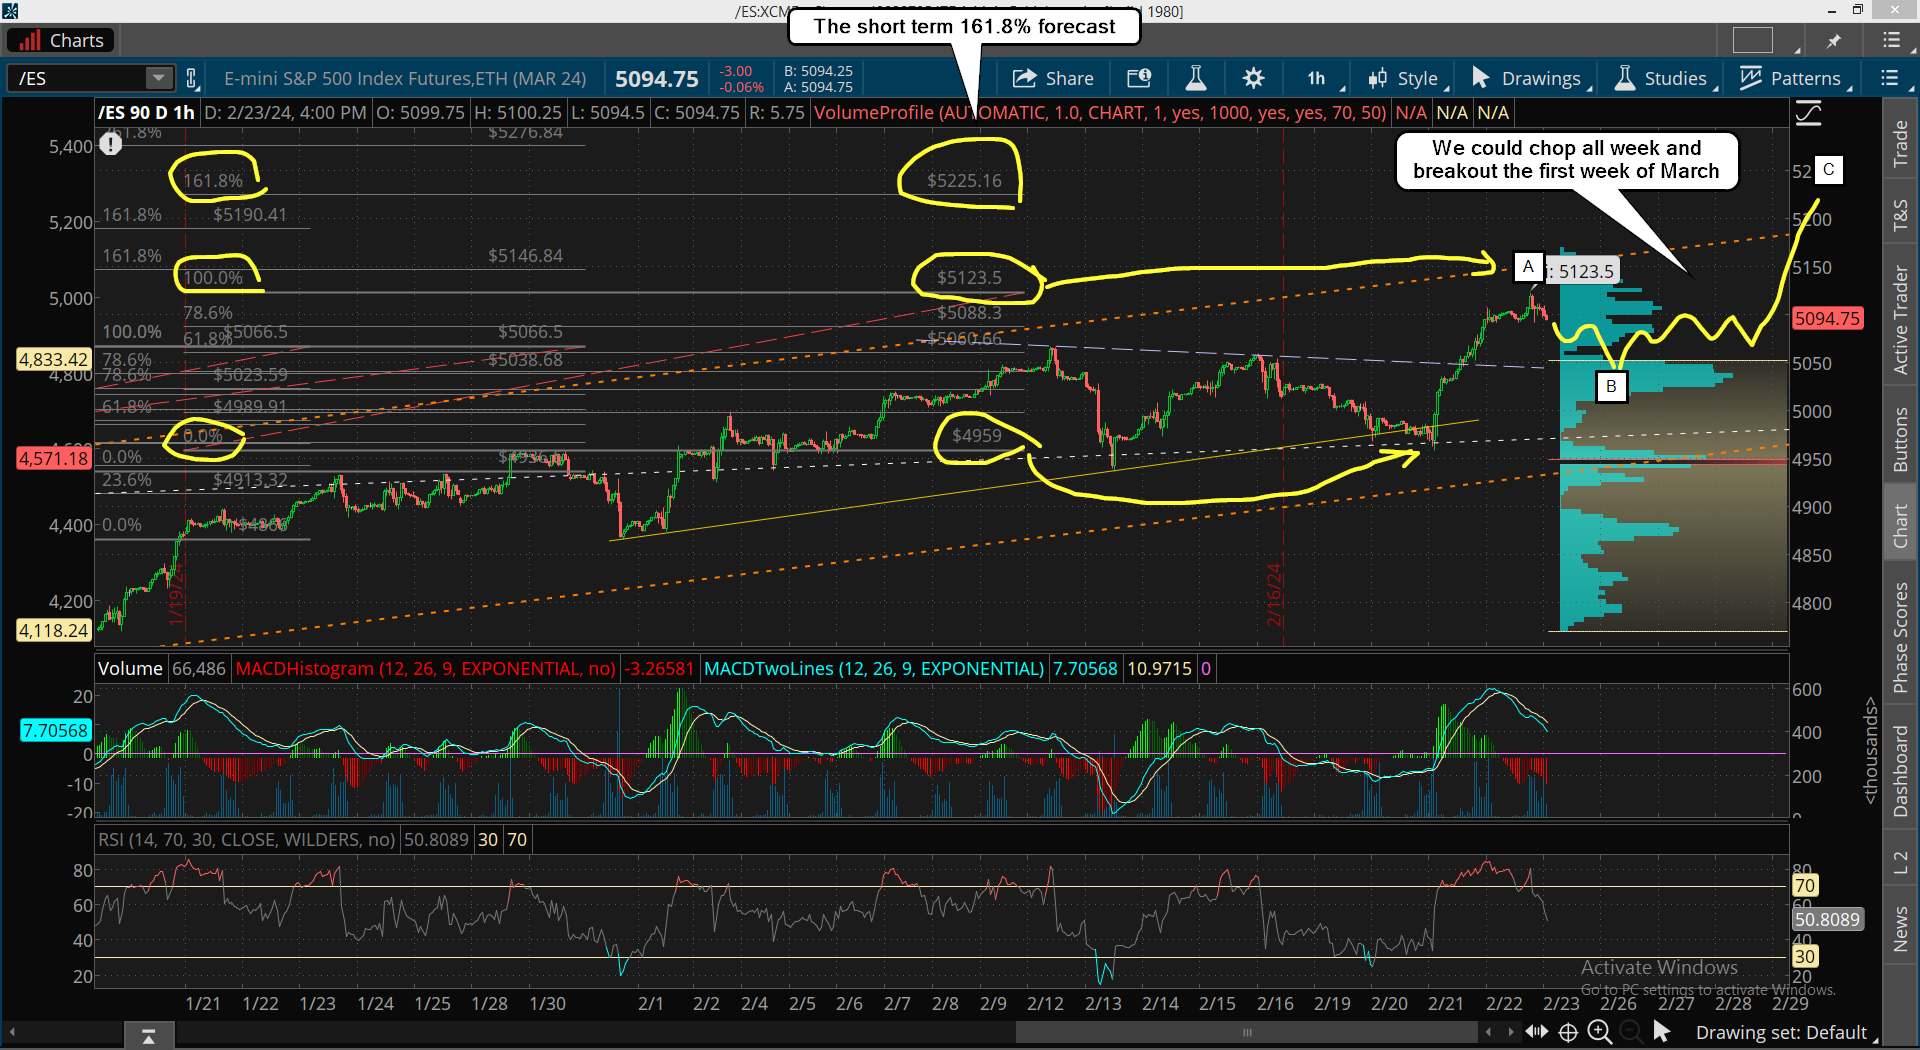
Again, that's not a wave count. It's just a short term target (probably the first week of March) that once hit will complete a 161.8% pattern. This pattern can repeat over and over until the end of the multi-month or year rally ends. When that happens we'll get a big selloff of course, that flips us from a bull market to a bear market... meaning the 200 SMA is lost.
That's not happened yet, so currently I will continue to look for this pattern to give higher highs. The "shot across the bow" will be when we get 5-9% pullback, like all of those in the past that I covered on that Fibonacci Extension post, as over the past 20 years pullbacks of that percentage usually produced just one more higher high before the market flipped from the bull market rally to a bear market correction.
In conclusion I'm looking for this week to have a choppy downward bias with 5050 as support. And next week I'm expecting another rally up toward my 5225 target.
Have a blessed day.

