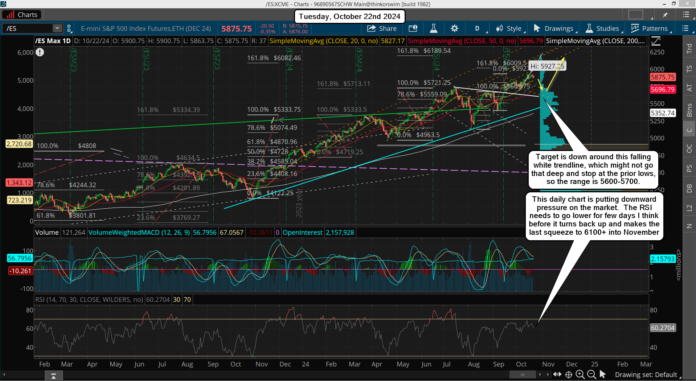
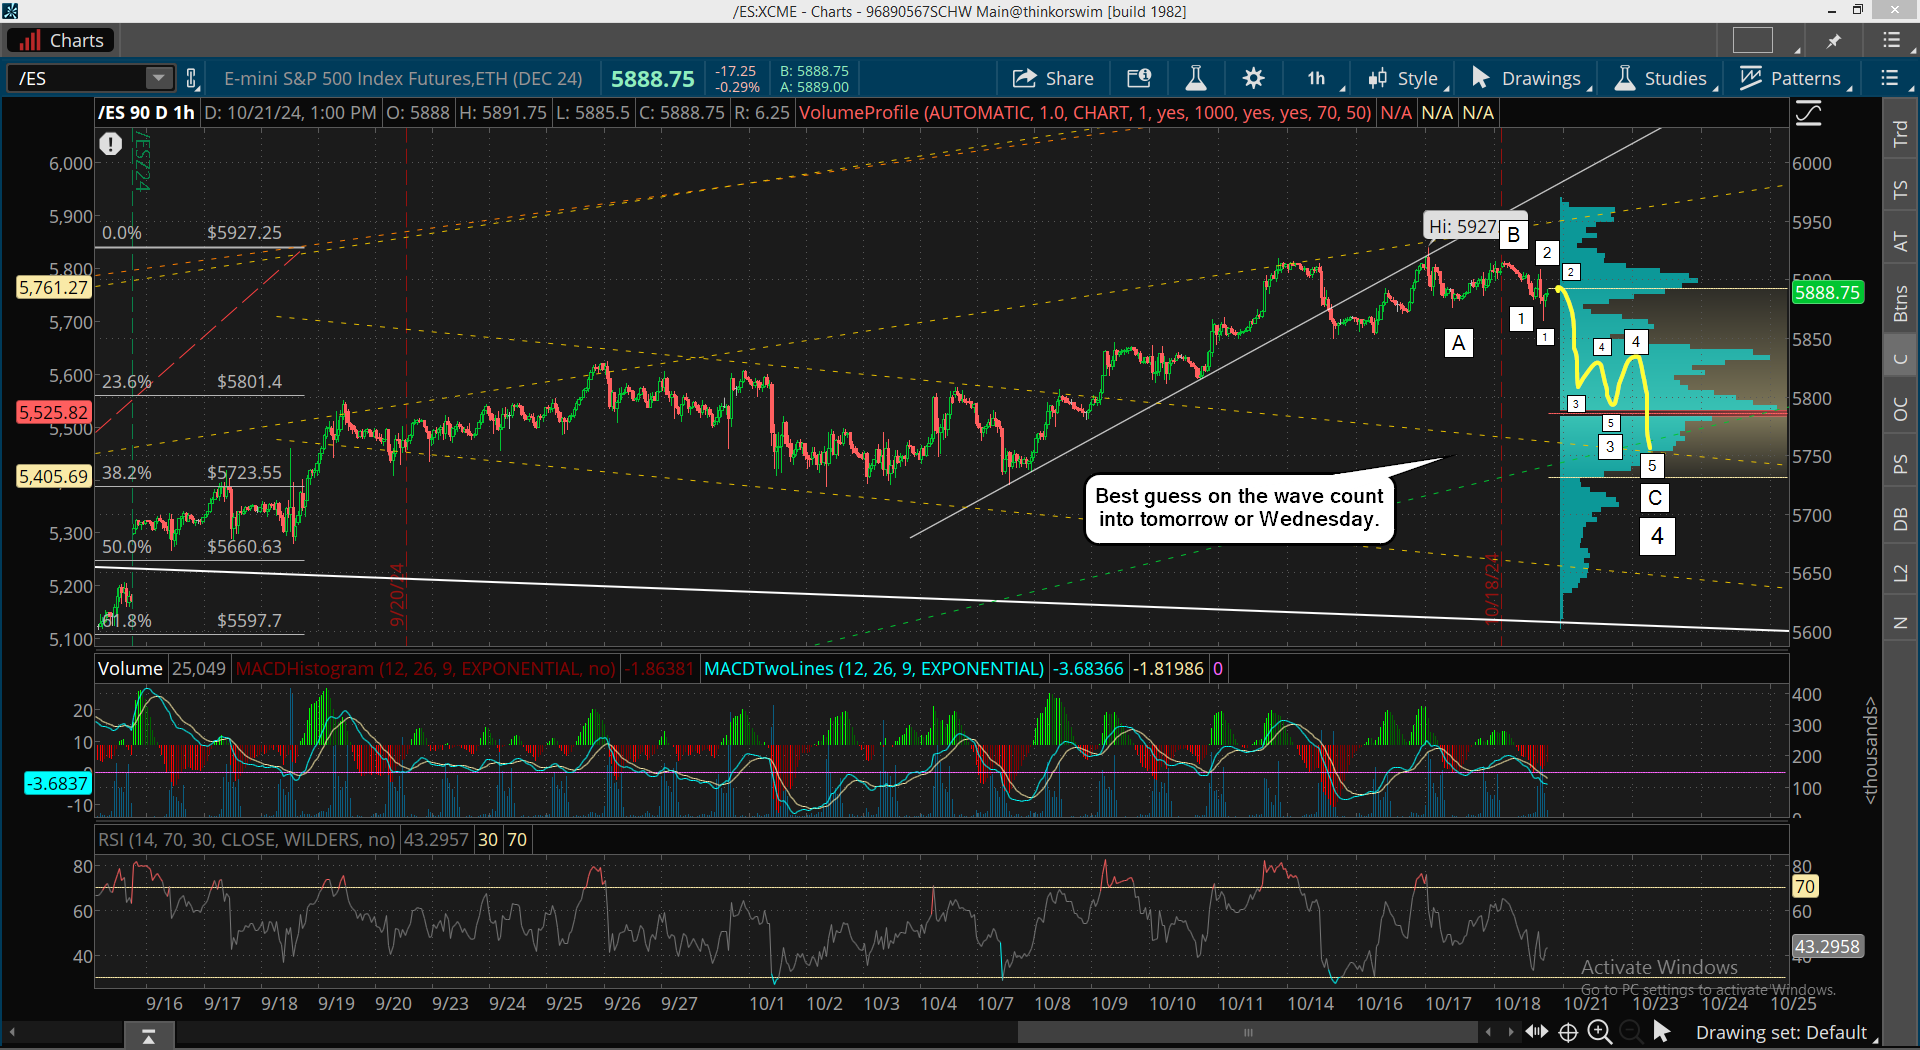
A very stubborn market it seems as it continues to stay in a tight range, but a breakdown is very near and could last into the 28th-31st window where "turns" are most common. I posted the follow chart yesterday on Twitter, which "might" be the path?
But there's also a chance we could make one more high to hit some stops overhead first, and then start a nice pullback to the falling white trendline of support. The very short term chart do support an up move but the 6hr and daily do not, so it's anyone's guess here on whether we do that first or just go down from here. Either way though a pullback is coming before the big squeeze to 6100+ into some date in November.
Have a blessed day.


That freefall signal triggered. I still think there needs to be one more thrust higher.
The SP500 is putting in a box formation similar to mid March before the late March high. The Nasdaq and NVDA are quietly getting stronger.
I did notice the SP500 have a similarity to February 2000 Nasdaq. This time the move is slower and less parabolic. The exhaustion indicator should time that peak but it isn’t there yet. But a reversal from a high could happen quick and at any time. I thought GOOG and Apple earnings reports could spike the markets but they don’t happen until next week.
I have a FP on NVDA of 160.22, which should mark the final high before we drop to the 483 FP’s on the SPY… but I don’t think it will be hit until late November, like going into Thanksgiving. The market is not going to make it easy to just short after the election. No… it’s going to have wild swings up and down for several weeks and then when everything looks calmed down (Trump victory) we’ll see that last rally up.
Then December will be a BIG surprise as that’s when no one will be looking for any move down, but we’ll have that big drop into Christmas like 2018 did. It won’t be seen by many, but once that NVDA FP is hit the high will be in for the market and we will drop hard.