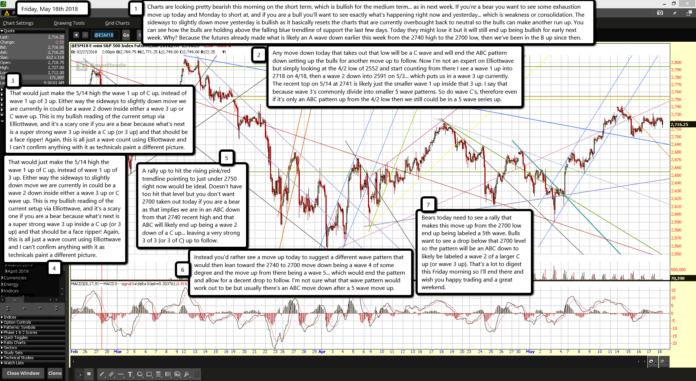
Charts are looking pretty bearish this morning on the short term, which is bullish for the medium term... as in next week. If you're a bear you want to see some exhaustion move up today and Monday to short at, and if you are a bull you'll want to see exactly what's happening right now and yesterday... which is weakness or consolidation. The sideways to slightly down move yesterday is bullish as it basically resets the charts that are currently overbought back to neutral so the bulls can make another run up. You can see how the bulls are holding above the falling blue trendline of support the last few days. Today they might lose it but it will still end up being bullish for early next week. Why? Because the futures already made what is likely an A wave down earlier this week from the 2740 high to the 2700 low, then we've been in the B up since then.
Any move down today that takes out that low will be a C wave and will end the ABC pattern down setting up the bulls for another move up to follow. Now I'm not an expert on Elliottwave but simply looking at the 4/2 low of 2552 and start counting from there I see a wave 1 up into 2718 on 4/18, then a wave 2 down into 2591 on 5/3... which puts us in a wave 3 up currently. The recent top on 5/14 at 2741 is likely just the smaller wave 1 up inside that 3 up. I say that because wave 3's commonly divide into smaller 5 wave patterns. So do wave C's, therefore even if it's only an ABC pattern up from the 4/2 low then we still could be in a 5 wave series up.
That would just make the 5/14 high the wave 1 up of C up, instead of wave 1 up of 3 up. Either way the sideways to slightly down move we are currently in could be a wave 2 down inside either a wave 3 up or C wave up. This is my bullish reading of the current setup via Elliottwave, and it's a scary one if you are a bear because what's next is a super strong wave 3 up inside a C up (or 3 up) and that should be a face ripper! Again, this is all just a wave count using Elliottwave and I can't confirm anything with it as technicals paint a different picture.
They show an overbought daily chart (on the SPX) with Stochastic's up in the high 80's that are rolling over, histogram bars with lower peaks (negative divergence), and the price level up at the top range of the bollinger bands. Usually that means a pullback to the middle is coming to normalize the price zone. The MACD's however are only around positive 10, which isn't too high as many prior peaks were up between 20 and 30. Anyway, from a bears point of view you'll want more overbought charts on more time frames and for that we'll need an up day today and Monday to get it overbought enough in my opinion for a nice drop to follow.
A rally up to hit the rising pink/red trendline pointing to just under 2750 right now would be ideal. Doesn't have too hit that level but you don't want 2700 taken out today if you are a bear as that implies we are in an ABC down from that 2740 recent high and that ABC will likely end up being a wave 2 down of a C up... leaving a very strong 3 of 3 (or 3 of C) up to follow.
Instead you'd rather see a move up today to suggest a different wave pattern that would then lean toward the 2740 to 2700 move down being a wave 4 of some degree and the move up from there being a wave 5... which would end the pattern and allow for a decent drop to follow. I'm not sure what that wave pattern would work out to be but usually there's an ABC move down after a 5 wave move up.
Bears today need to see a rally that makes this move up from the 2700 low end up being labeled a 5th wave. Bulls want to see a drop below that 2700 level so the pattern will be an ABC down to likely be labeled a wave 2 of a larger C up (or wave 3 up). That's a lot to digest this Friday morning so I'll end there and wish you happy trading and a great weekend.


