

(Note: I've changed the degree of the waves some in this update as I was wrong on them the last several weeks. I was labeling expected Small Wave 4 down as Medium Wave 4, which is now corrected on new charts).
At this point I'm starting to think that we will NOT get any pullback until either right before the election or right after it. Meaning they are going to chop everyone to death in a tight range (a hundred or so points?) until at least the end of this month, which is where we might drop into the election for Small Wave 4 down.
Or we wait until the day after and that's where we get the drop, which will be very fast and end by the middle of the month. Then we rip to 6000+ into the end of the year to reach one or more of my Fibonacci Extension Targets, which all of them are above 6000.
So, will the market reach 6000 before the coming pullback? I personally don't think it will because it's too obvious of a magnet. I think it falls short of it and does the drop first... then the year end rally takes us to 6000+ for the final blow off top. Between now and the election we should chop with some fake out drops that last a day, then reverse back up to the same level.
The 1 Hour Chart...
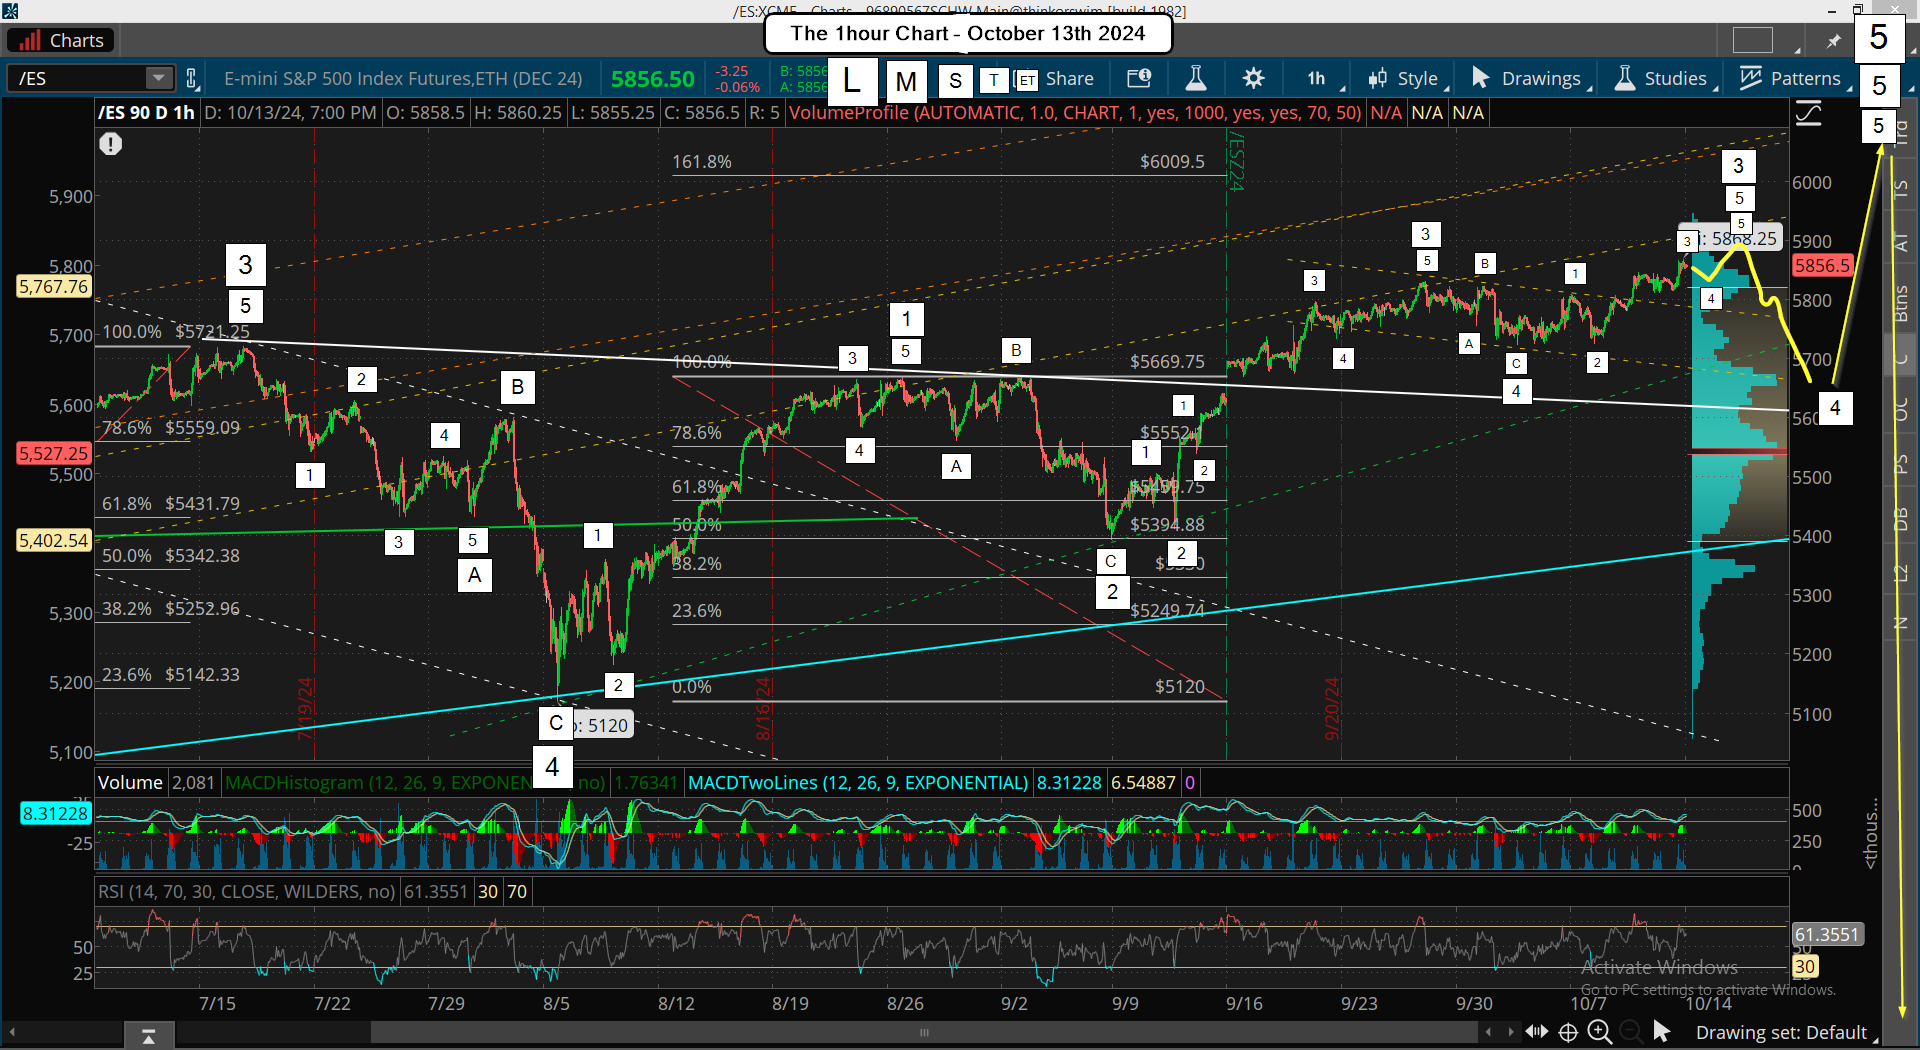
Then at some point, which I think will be right before the election, we'll get the drop for Small Wave 4 down. I think it will be a higher low then the September low (around 5400). Usually wave 2's and 4's of ALL degrees are some Fibonacci Level (23.6% or 38.2% are common and sometimes 50%) and they are simply calculated from different points based on their degree.
Meaning that the pullback for that Small Wave 2 down was calculated from the August low, which is Medium Wave 4, up to the first high inside Medium Wave 5 for Small Wave 1... which was the early September high. The pullback there was about 50% for Small Wave 2 down and from that low we've been in Small Wave 3 up ever since.
The 6 Hour Chart...
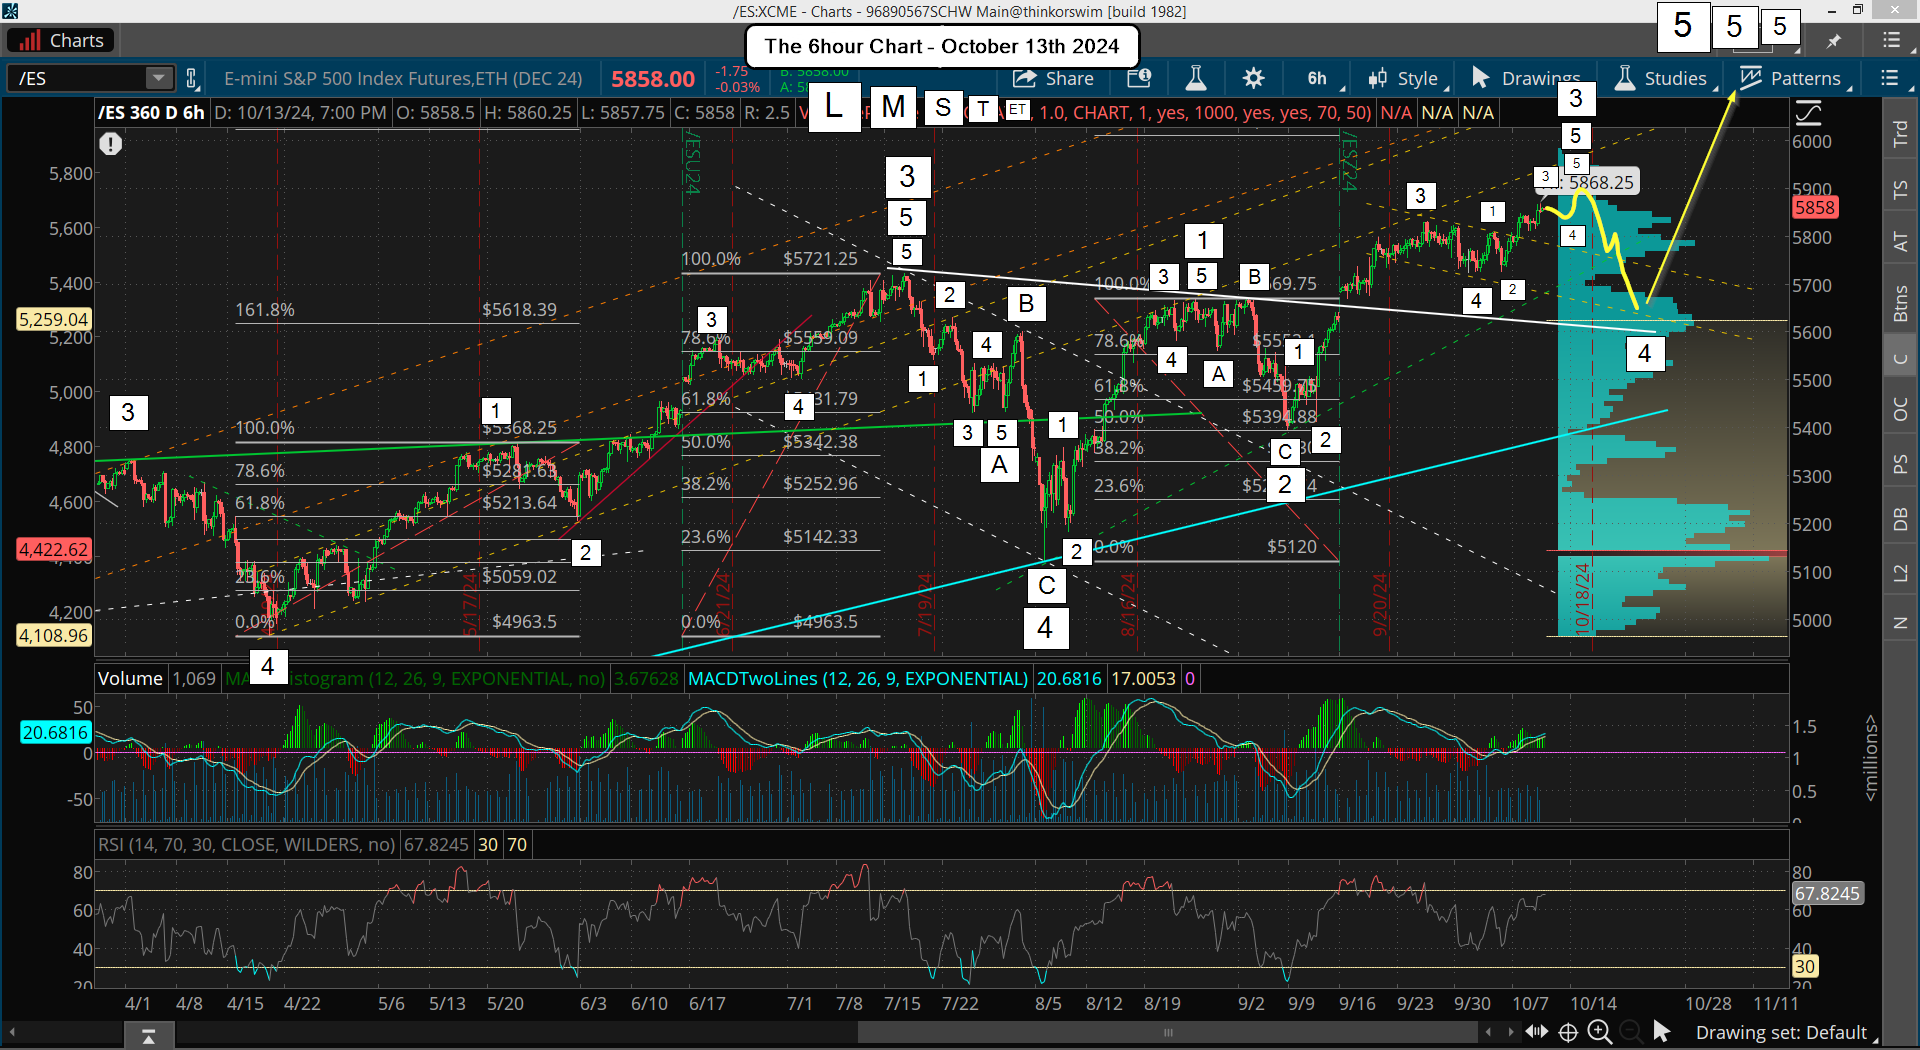
Once Small Wave 3 up finishes, which should be before the end of this month I think (maybe this week?), or it could drag out right into the election, (I doubt it though as that's too obvious as it's a repeat of election day in 2016), we should see Small Wave 4 down happen. It should be some Fibonacci Level retracement from the start of Medium Wave 5 up, which is at the August low of 5120.
If for example we top at 5920 in the next few weeks that's an 800 point rally up, so at most we could see 400 points down for the pullback if it's a 50% retracement, or less if it's only 38.2%, and even less if only 23.6%... which is not even 200 points down. It's certainly possible that we see only a small amount of points, but I think we'll at least take out any stops below the lows of the last several weeks. That's roughly the 5700 level, so I think the target is somewhere between 5500 and 5700 for the coming pullback of Small Wave 4 down.
After it's finished we should rally hard and fast to reach much higher levels above 6000 as you know they won't stop right at that obvious target. I don't know how long that will take though as it depends on when we get the pullback for Small Wave 4 down.
If it comes this week then the big last squeeze up could go right into the election, who knows for sure? I'm just focused on seeing that pullback for Small Wave 4 at some point soon and then Small Wave 5 up is the blow off top that will last as long as it last. It might drag into the end of the year and nothing much happen around the election? I doubt it though as it's super important and should cause the market some kind of volatility.
Now this thought is a "wildcard" one but what if we get the pullback for Small Wave 4 this week and rally up to 6000+ into the election to complete Small Wave 5, Medium Wave 5 and Large Wave 5? That would setup the election as the big top before a very large drop, which could very well be down to the two FP's on the SPY from earlier this year? But the rally up afterwards would only be for a lower high into early January and NOT the start of another bull market run that lasted for several years after election day in 2016. So it would be different afterall. Remember that it was not even a one day drop back then as it was in the futures market basically. If we drop to the 483 level that will take a week or two to happen as it will be from 6000+ and that kind of a move down can not happen in one day.
Ok, that's my thoughts going forward into the end of this year. It's subject to change of course as it's always just a best guess. I'll add one more thing that could happen, which is more of a "big picture" scenario. While everyone is expecting a recession (or depression) in 2025 I think they could all be wrong and right but be tricked on how it unfolds.
The Daily Chart...
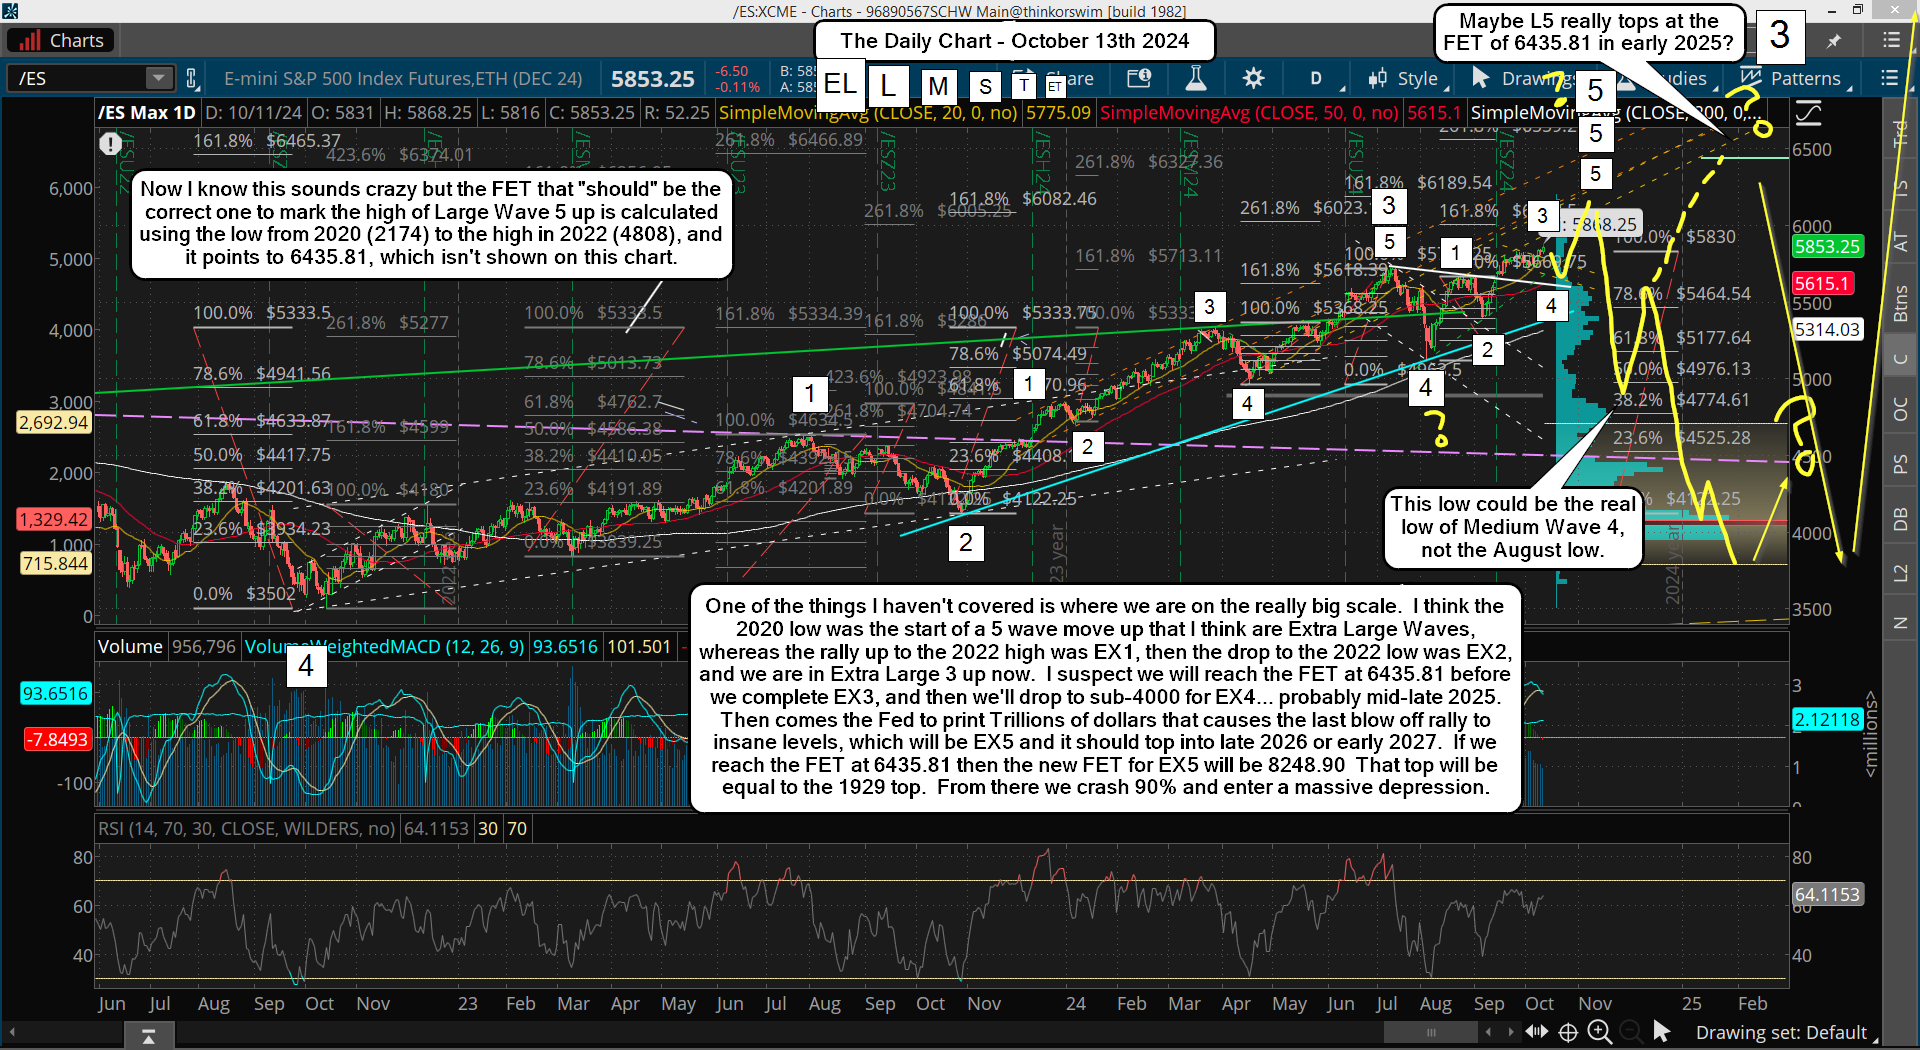
I've drawn some alternative paths that could happen into the end of this year and early 2025, which not many will see coming. If we drop to the FP on the SPY of 483 after the election then everyone will short the rally back up. But if we haven't hit the FET of 6435 before that drop (and I don't think we will) then we could squeeze into early 2025 to reach that level, and then drop to sub-4000 the next half of the year.
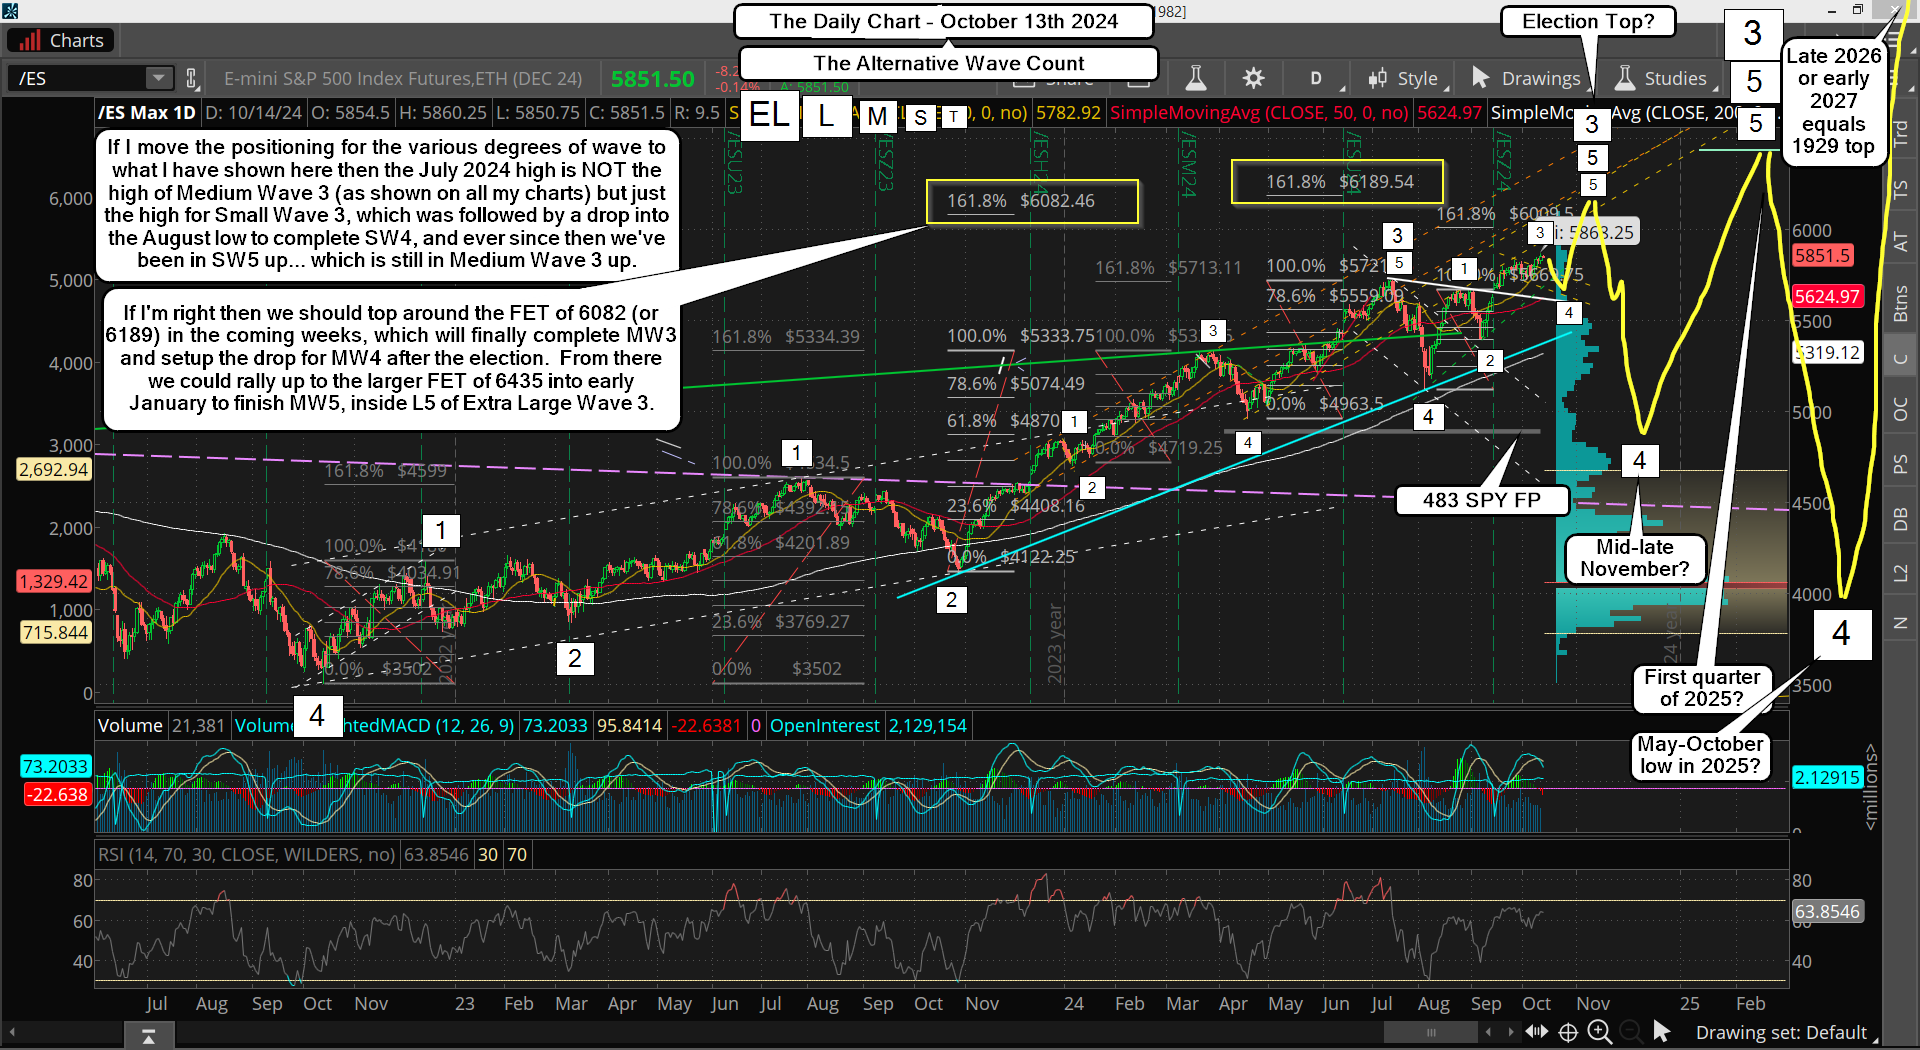
That would fool a ton of people as if you get close to the 2022 low of 3502 everyone will think it's going to be taken out. But if I'm right we should bottom before that level for Extra Large Wave 4 and then have one more 2 year rally for Extra Large Wave 5, which might reach 8248.90 (a new calculated FET if 6435 is hit). This is all just more "food for thought" but it's very possible that it plays out something like this, and the chart below shows the alternative wave count.
The Alternative Wave Count...
Have a blessed day.


I thought the 17th was a Friday so a high could extend into the 18th. We still need a minor 4 and a minor 5 and RSI divergences on shorter term frames.
Pearl Harbor astrology starts next week so beware of that. The 17 year cycle extends back to the 1990 Iraq Invasion and the 1973 Yom Kippur War and to 1939, start of World War 2. But the Revolutionary War, Civil War, World War 2 cycle is a different cycle. Someone explained the astrology of it online and Pearl Harbor occurred just before the start of this cycle.
If crude oil shoots above its 200 week average, then be very wary. Its weekly Bollinger Band is flattening so one last drop to it can occur.
We will get a wave 4 pullback at some point but we might go higher before we see it.