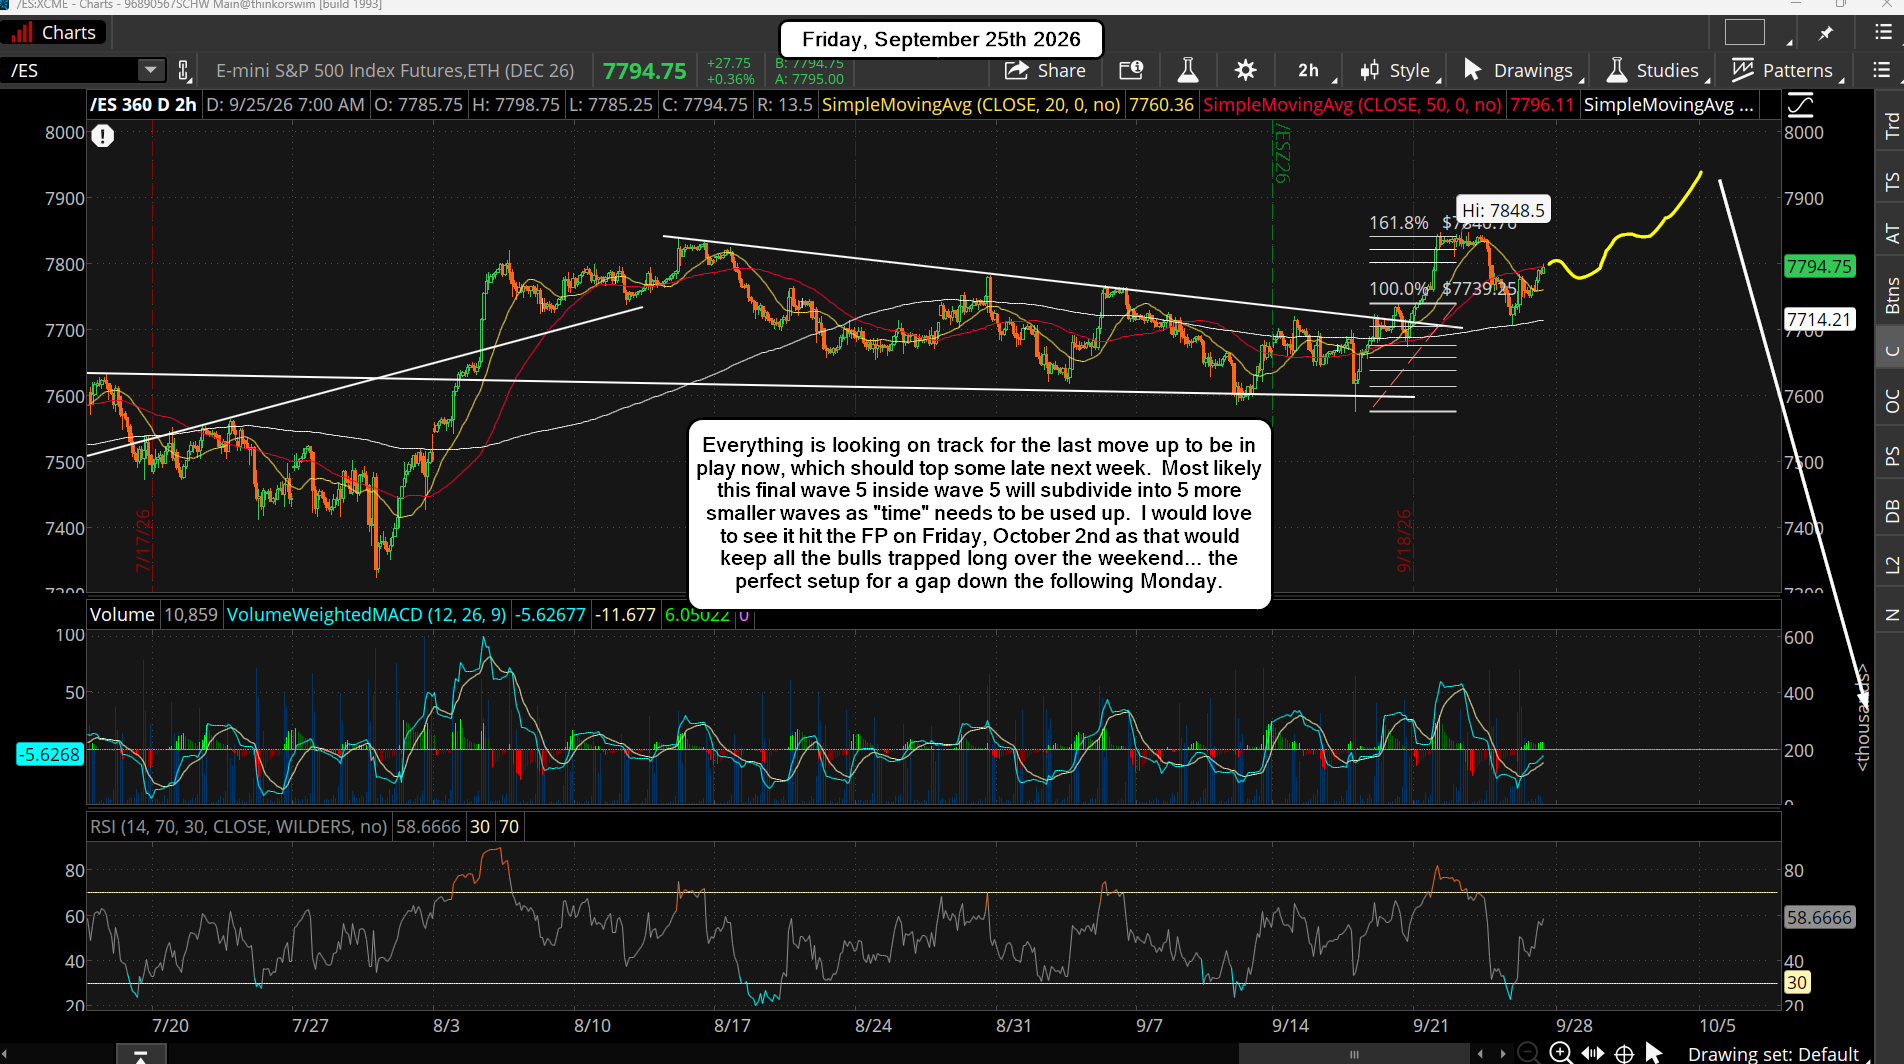
The market is playing out as forecasted with the wave 3 of 5 up finishing Monday and the wave 4 of 5 pullback starting afterwards and is still in play. It has retraced about half the move up from the September 16th bottom where this all started from. I suspect that it is finished now with the premarket low Thursday (or will finish soon with one more push down) and that next week we will see the final wave 5 of 5 unfold.
It will likely subdivide into 5 smaller waves as "time" will need to be burnt off so it's not likely going to be a fast move. With next Friday being October 2nd, and the weekend afterwards (plus a new month) I would not be surprised to see the squeeze up to the 787.13 FP on the SPY happen that day. It would be the perfect bull trap as everyone would look for 8000 to happen the following week, but that should not appear. Bears will miss the move down too as they won't be short as they too will be looking for 8000 to get hit as well. Then something will happen over the weekend that will cause the following Monday to gap down.
What that news will be is unknown of course, but that's the way the market works. There's always some news to blame a huge rally on, or a huge decline. Predicting the news is impossible, but the cycles in the market do repeat and they now say that the October 2nd-6th window is where the top will occur, and the FP is the price level.
How low will is go is the question I can't "positively" answer. There are two fake prints around the same zone that will end up being about a 10-12% correction if hit from the upside FP. They were mentioned in last weeks post, which again are 714.68 and 716.58, and I'm just going to the lower one as they will both likely be hit on the decline that's coming.
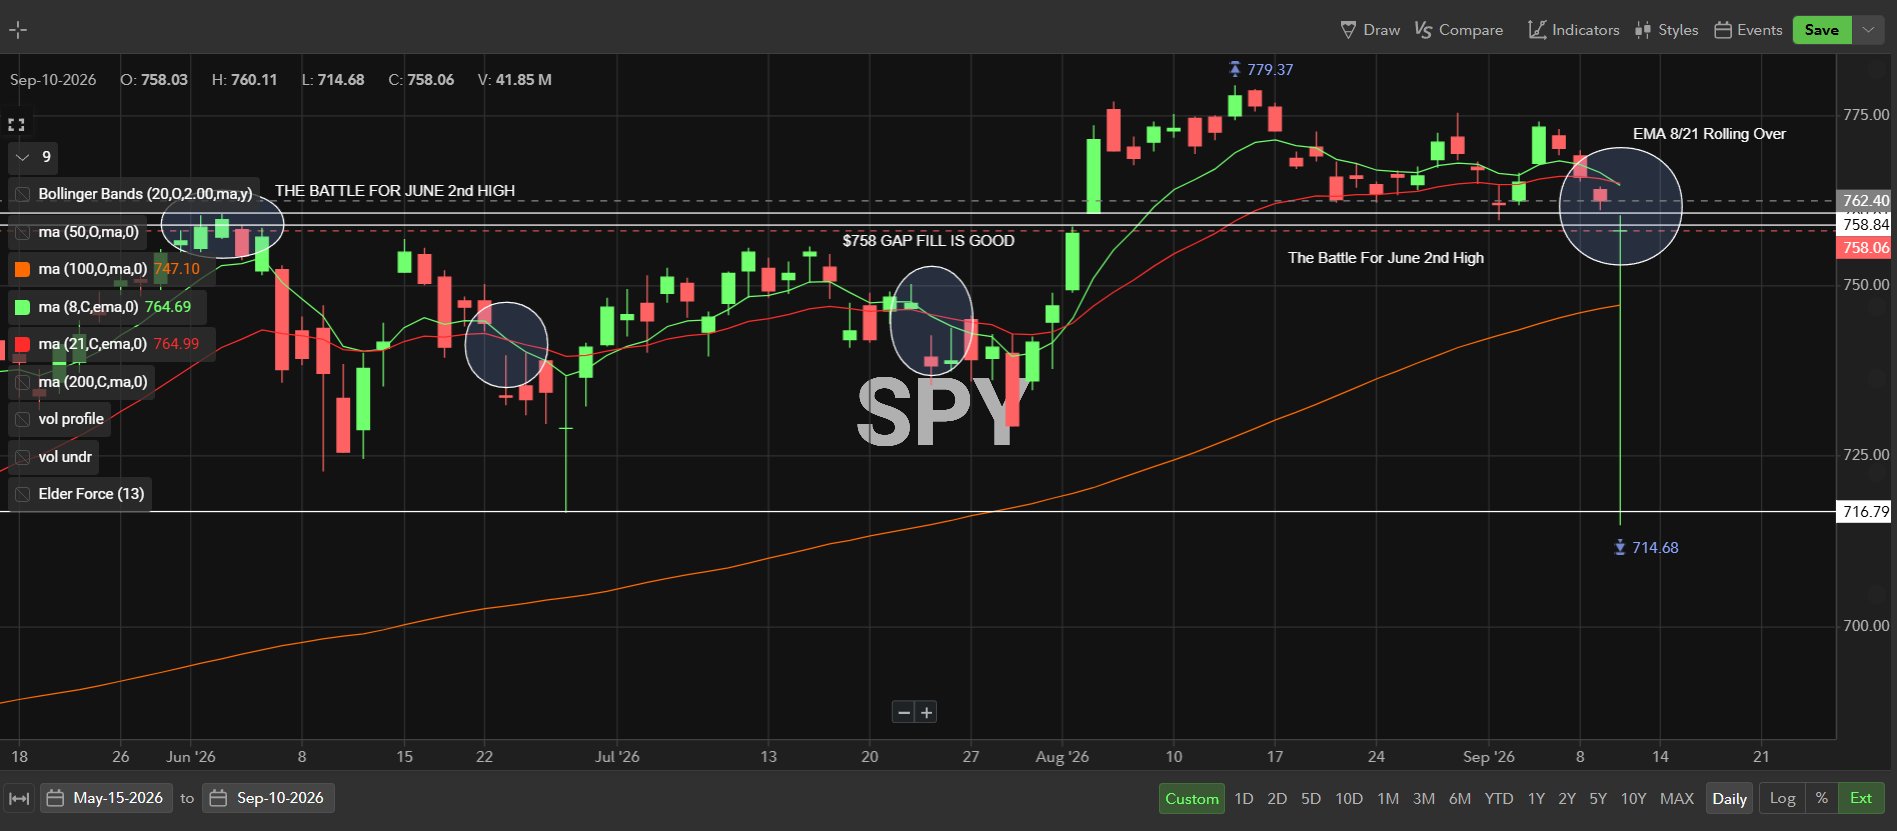
Then there's the 600.14 FP, and that one is of course a much deeper correction (about 22%), and could be the final target into the November election? I mean this market could drop once to the 715 zone and then bounce really hard (a "B wave"), and drop again really hard in a C wave to the 600.14 FP to finish the entire move in a wild and crazy ABC correction.
This kind of move happened in the year 2000 where the market topped on 3/24/2000 (a Friday) and dropped hard into 4/4/2000 for the A wave... which actually recovered the low that very day! It would be like we hit the 714.68 FP (the lower one so both are fulfilled) on some day in early to mid-October, and reversing back up the same day to close only slightly down.
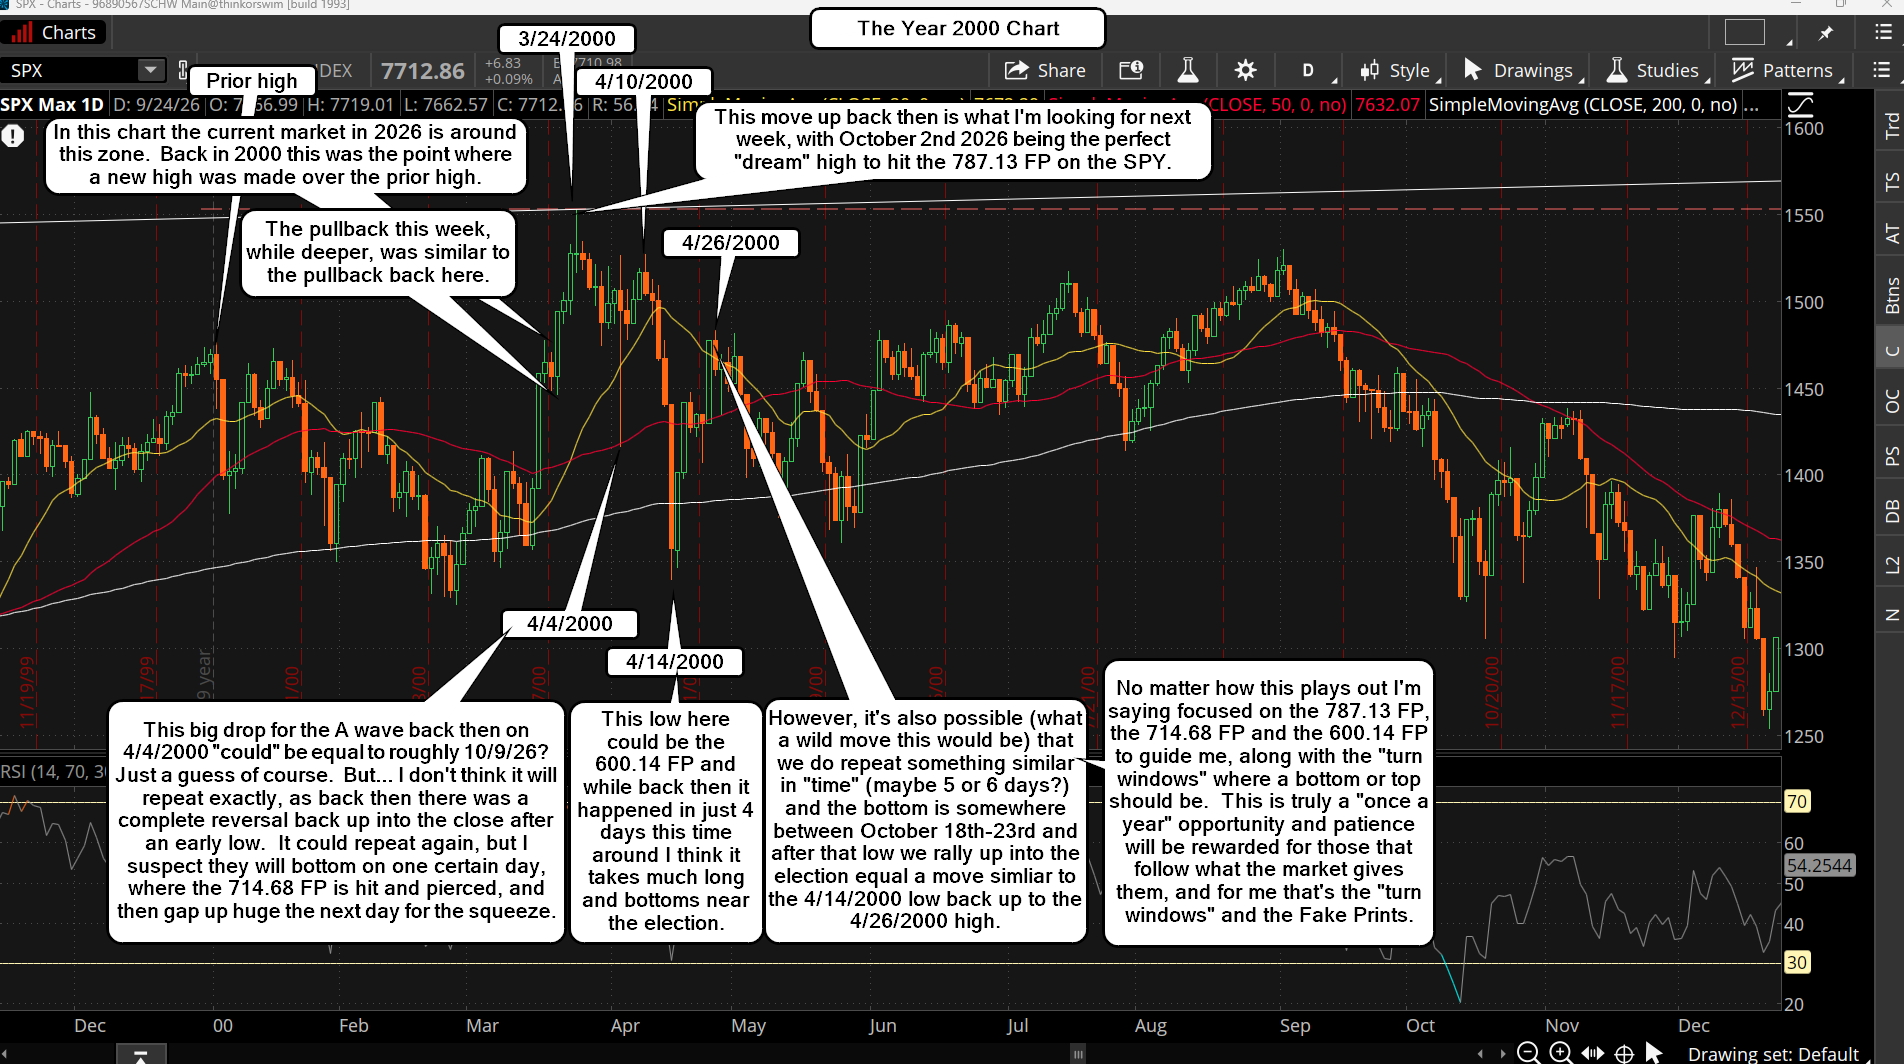
That was a crazy move back then, and that bounce (the "B wave") last into 4/10/2000 before the market fell apart again for a huge 4 day drop into 4/14/2000 where the C wave bottomed at. Now that was the start of a multi-year decline, and I'm not expecting the rest of that chart to repeat as the bigger picture has this market still in a long term bull phase, and back in 2000 that bull phase was ending. Currently the bull phase should last several more years, but the "pattern" the market made back then is exactly what it's repeating now, so be aware and ready to exit all shorts at the hitting and piercing of the 714.68 FP once the decline starts.
There are other patterns from other years that the market is tracking very closely too, and all of them point to a large decline coming in October that ends around the November election. They also "all" have one more high before the drop happens, which currently is the 787.13 FP, and the time window is the 2nd-6th, so next week is the time we have all been patiently waiting for.
It's a massive opportunity for anyone willing to risk some money on a short to make a huge return. The 714.68 FP on the SPY equals around 7167.89 on the SPX, (the ES is 60-70 points higher) and ironically that's around the 200 day simple moving average. It will be a logical place where a strong bounce should happen from as most pierces of it in the past produce a strong bounce from. If the market tops on the 2nd (just a guess) then the entire drop to that level could happen in the following 4-6 days... meaning that the following Friday (the 9th) we could be hitting that fake print. Of course if we do bottom there everyone will be short over that weekend and the following Monday would produce a massive squeeze to start the B wave up.
Again... all speculation but if I were SkyNet I'd do it that way. I'd do a spin on the 4/4/2000 drop and reversal intraday, whereas this time I'd close hitting the 714.68 FP on Friday October 9th and open Monday the 12th with a massive gap up that squeezes all the bears out, and then I'd reverse into the close to go right back down again to start the C wave into late October where the final low will be the 600.14 FP. This would be a nightmare to trade for most people but a dream move for me as I have the FP's as targets and the patterns and turn windows. One thing for sure... October is going to be a wild month. Get your engines starts and get ready to rumble.
Have a great weekend.