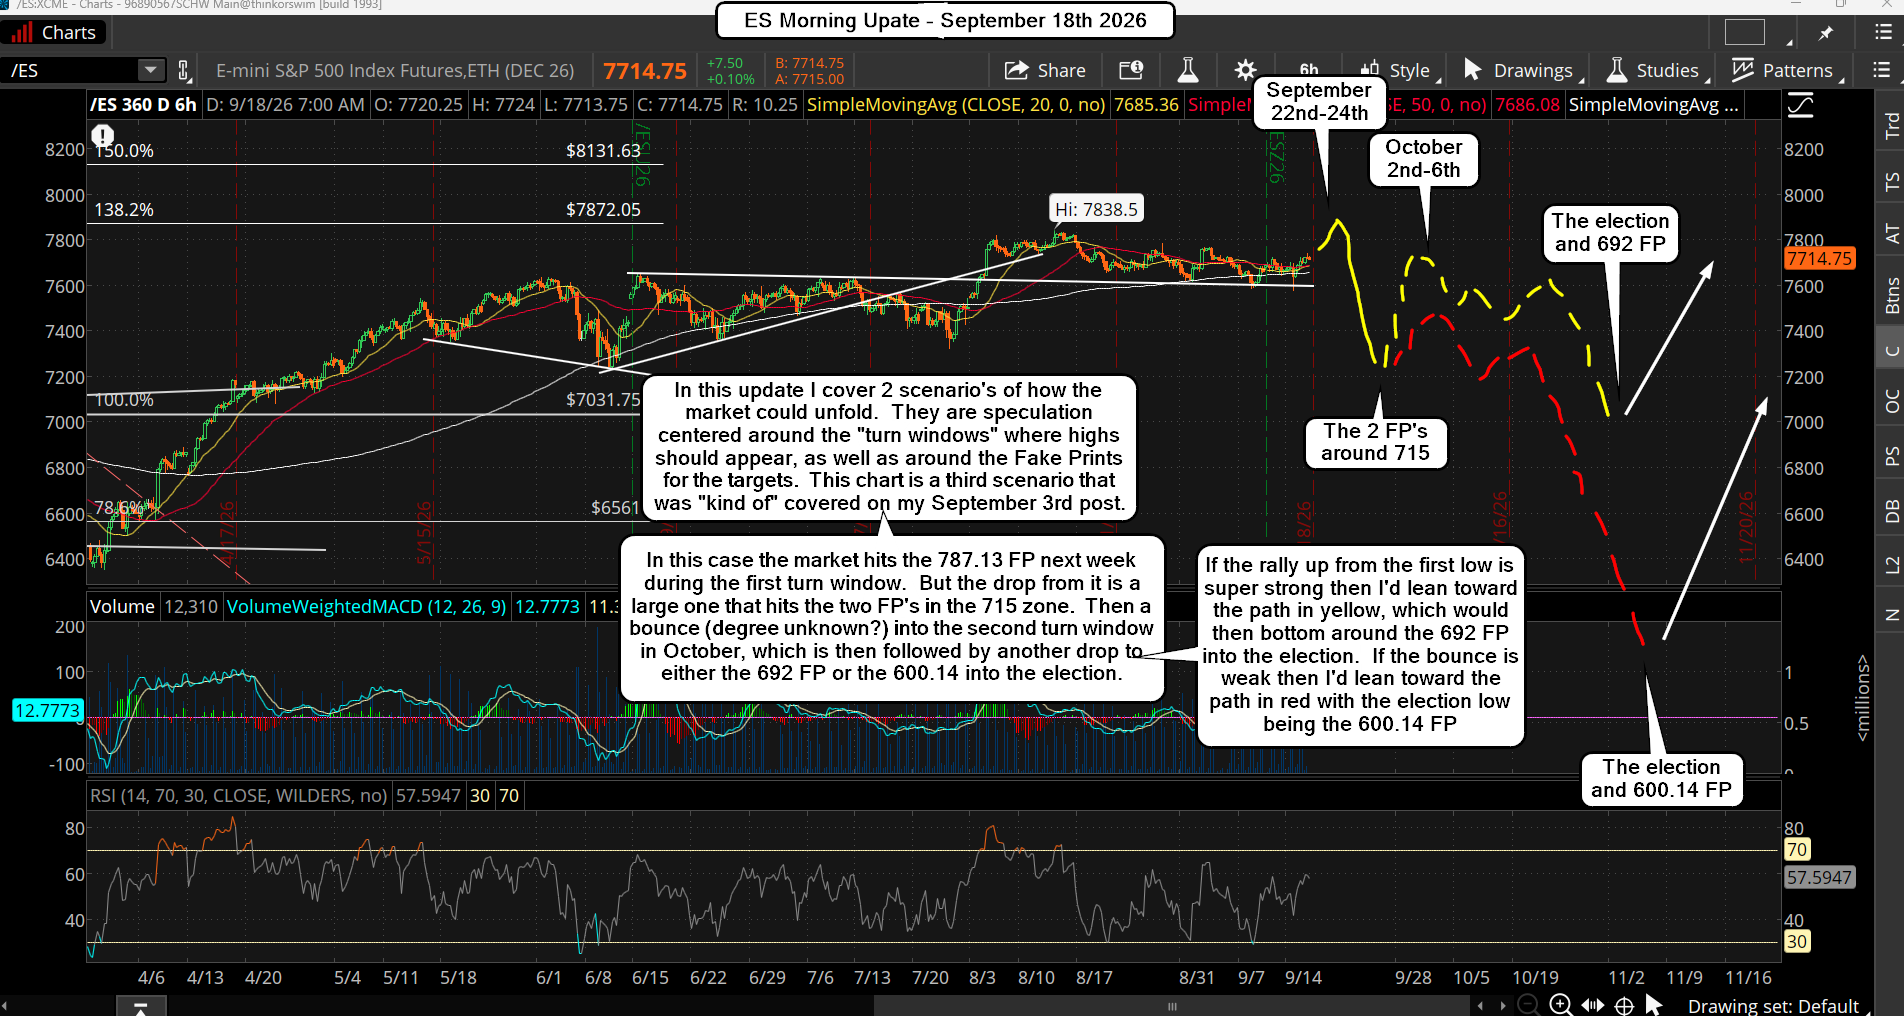
The market appears to have bottomed for now, in what I think was an ABC wave 4, where I can see that the C wave subdivided into 5 waves, and ended at the low on Wednesday. If this is correct we started the wave 1 up that day, which is inside a bigger wave 5. Since this 5th is expected to hit the 787.13 FP on the SPY into either the window of September 22nd-24th, or October 2nd-6th, we should see one of two scenario's unfold.
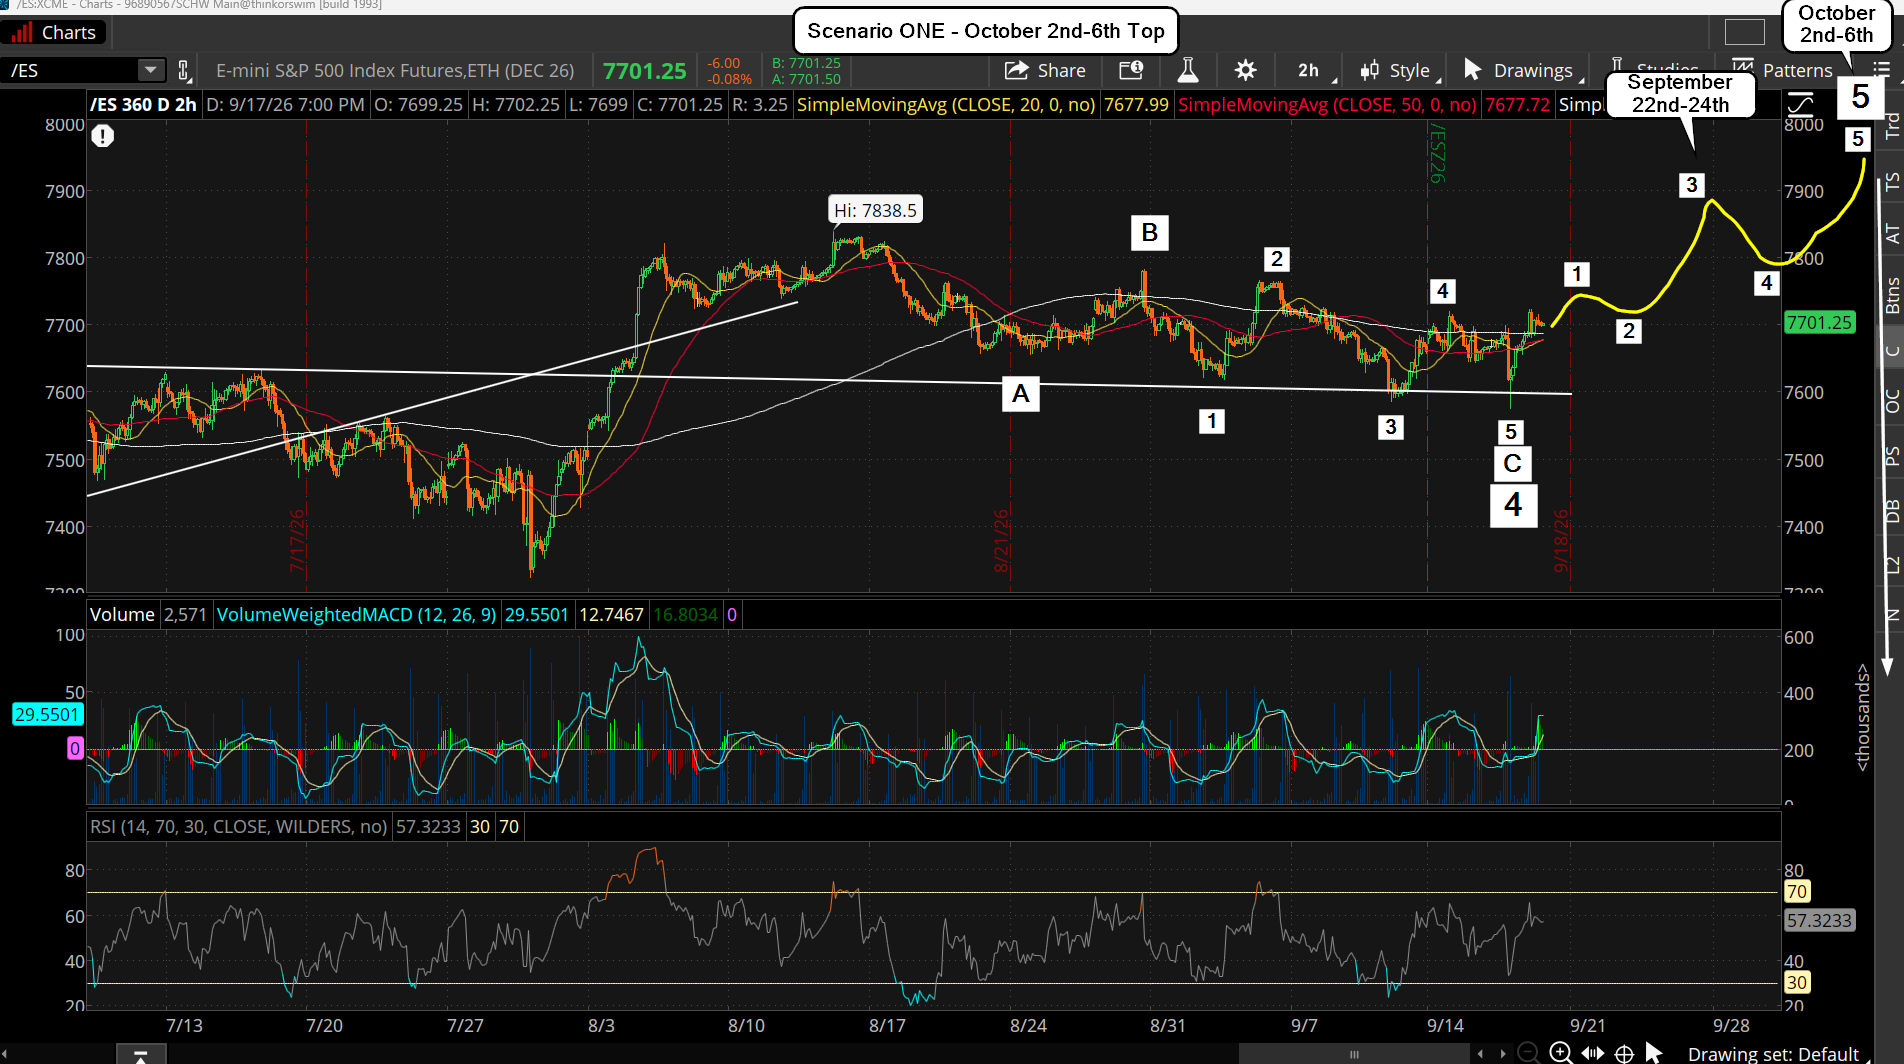
If the market wants to drag out the 5 waves up to finish the 5th wave then it will top around the October 2nd-6th date, and that means more subdividing waves. Since the wave 1 up started at the low on Wednesday the wave 2 pullback should appear soon, and then the wave 3 up should divide into 5 smaller waves so that it tops out between the 22nd-24th. Then a wave 4 pullback that's probably an ABC, and a final wave 5 up into the 2nd-6th, which again could subdivide to drag out more "time".
This pattern would mean that the top of the wave 3 next week should not hit the FP on the SPY but should get close to it. Possibly a slightly higher high on ES (it's on the December contract now and 65 points higher the then SPX), but slight lower on the SPX cash? Then the move up into October 2nd-6th will hit the FP of 787.13, which is now around 7950 or so on the ES. If that happened everyone would say that 8000 is next, but if it just barely pierces the FP there's no reason for the ES to reach the 8000 level and it could just rollover right then and there.
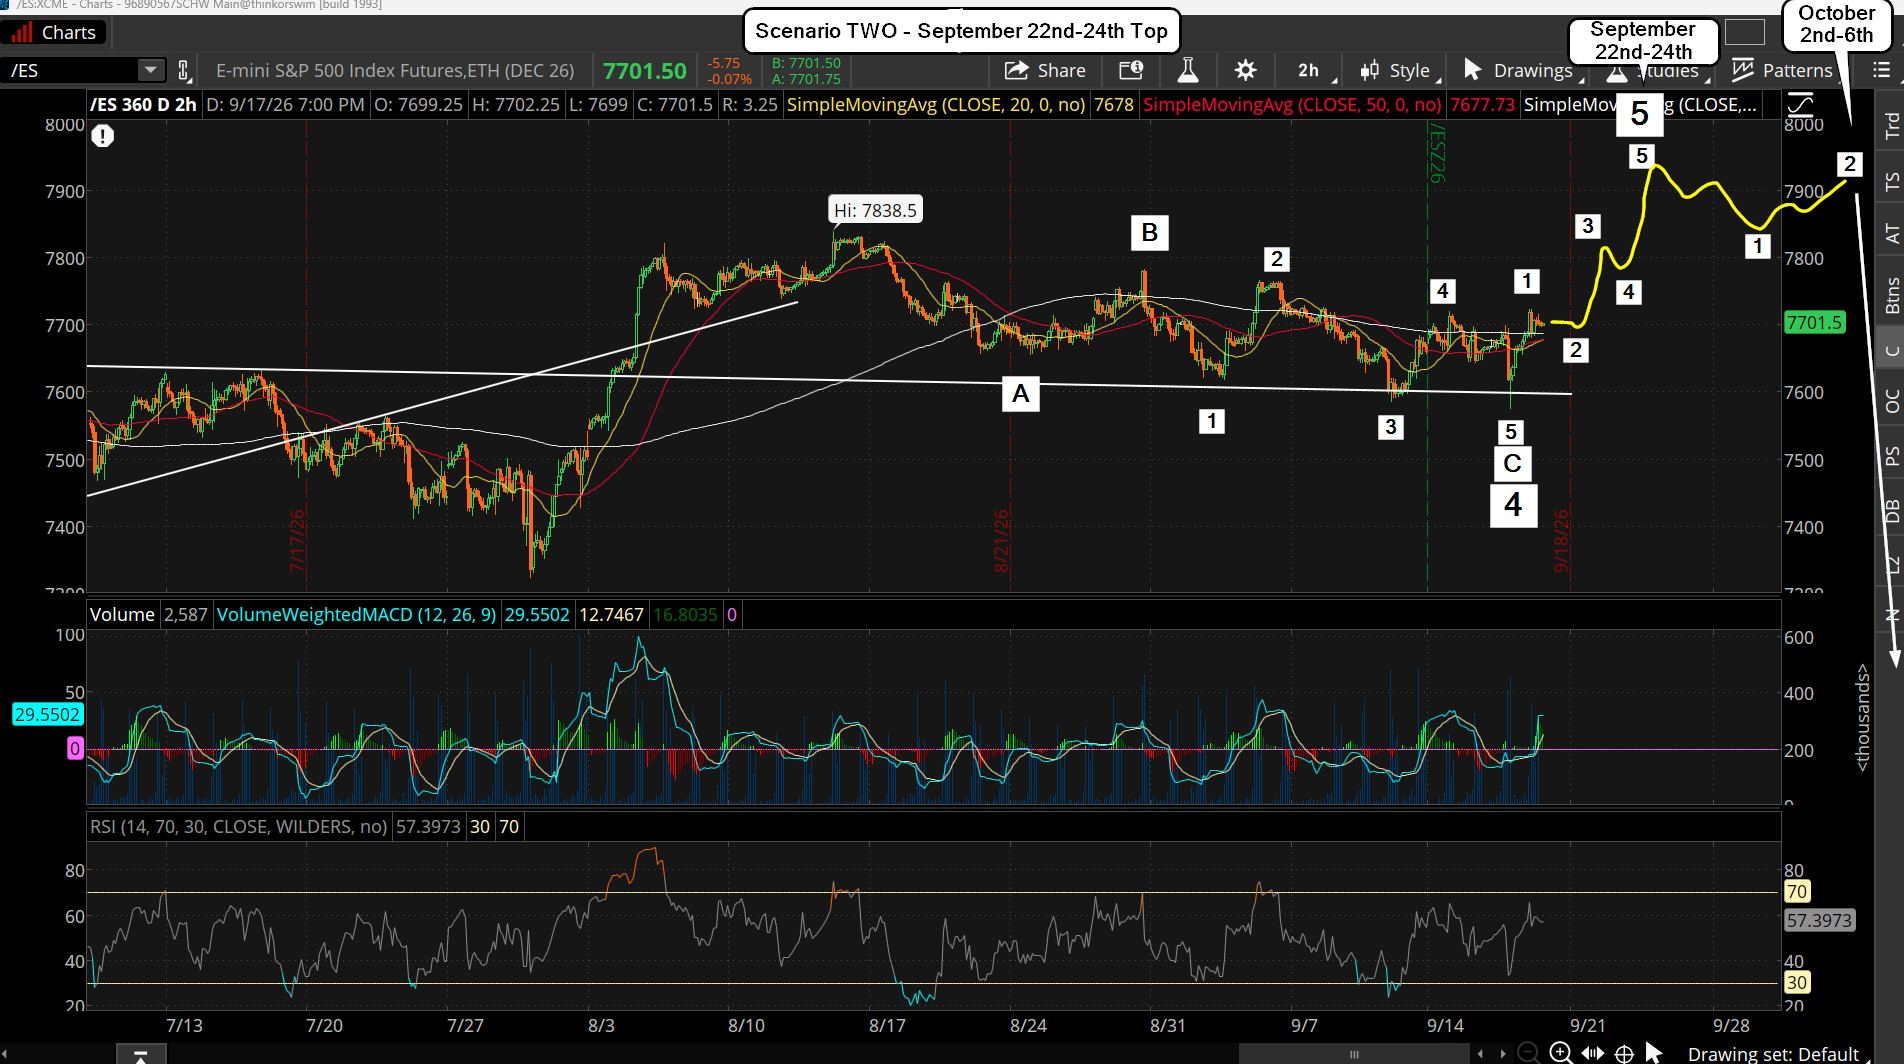
The other scenario is that we see 5 waves up into the 22nd-24th next week to complete the 5th wave and hit the FP then... which would be followed by a pullback of some degree (probably not large) for an A wave (or at least the wave 1 inside the A wave) and the B wave up (or the wave 2 inside the A wave) makes a lower high into October 2nd-6th.
This is just like the 9/21/2018 top and pattern where there was a wave 1 inside an A wave that followed (small pullback) and a wave 2 inside the A down that made a slightly lower high on 10/3/2018. After that the wave 3, 4 and 5 for the A wave followed and that would be the move down the the 692 FP on the SPY. Something else to note is that there are now two FP's that are similar in price that should be added to this story.
There is the "New FP on September 10th 2026 for the SPY at 714.68" and the "New FP on June 26th 2026 for the SPY at 716.58", which are close in price so I'm just going to refer to these fake prints as the 715 one's. It's possible that they will be hit on the wave 3 of the A wave down and the wave 5 will hit the 692 fake print. Then some kind of bounce for a B wave and the C wave then takes the market down to the 600.14 FP into the election. It would be similar to 2018 but sped up in "time" as that one dragged out into Christmas, and I don't think that will happen again.
With the rumors of Trump giving everyone a $5,000 check, which it would be wise to do it right before the election, I have to think that money will be a huge stimulus to the stock market... and if it's right a the 600.14 FP too, look out for the mother of all squeezes!
From X two days ago...
https://x.com/reddragonleo/status/2100192569552404861
Have a great weekend.