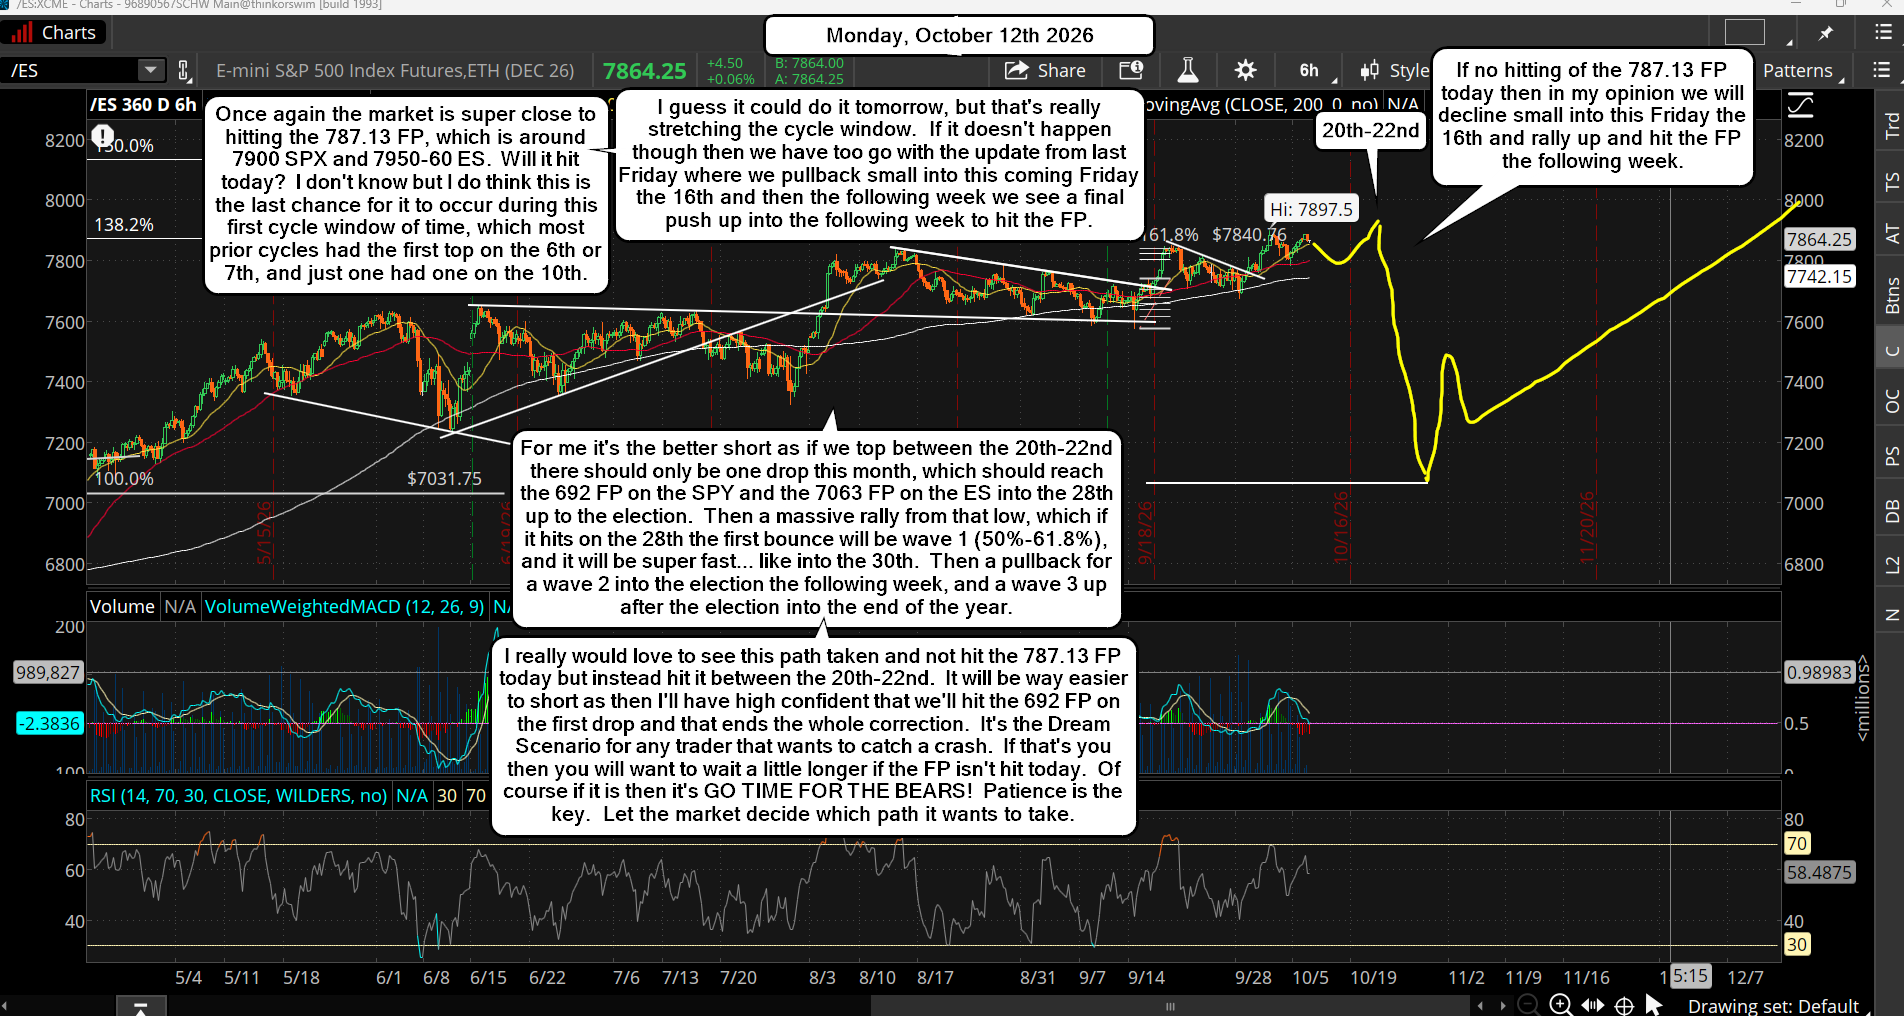
Today is a very important day for "if" we hit the FP of 787.13 on the SPY it's "GO TIME FOR THE BEARS!" as the first drop should at least reach the two FP's in the 715 zone. I've been looking at several past cycles that are in alignment with the current market and most all of them retrace down to the prior major top zones from prior months back, which in today's case would be the 7063 FP on the ES and the 692 FP on the SPY.
They don't stop at the prior lows, like the 6/9/26, 6/26/26 and 7/29/26 lows today. Most of the prior cycles had similar low points that were all higher then the months prior where a topping area formed. For today's market the topping area was built during the month of January to February of this year. Oddly the June 2nd, 2026 FP's on the SPY of 692 and 7063 on the ES were put out on that day which was a high before a pullback.
And the FP of 716.58 was the low on 6/26/26, which is still showing on the daily chart right now. I just don' think that this market is going to stop at that FP and the 714.68 on the next big drop as this drop should have a lot of momentum in it and big very fast. We already have 3 prior lows in that zone so this will be the fourth hit of it, so I don't think it will hold this go around. I'm really leaning toward the 692 FP and the 7063 FP as they seem more "real" and are supported by prior cycles where the major topping zone from prior months were hit and had the big support zone where a 50%+ bounce followed.
If that happens this week then anything is possible for the second drop into the end of the month... meaning it's possible that 600.14 FP could be hit. I know I said that we should make a higher low into the election, and that's certainly possible, but I want to remain open to something crazy happening. I say that because of how important this coming election is and how some crazy event could happen to cause the second drop to become a crash of 22% to the 600.14 FP instead of the higher low that I would normally look for if the 692 FP is hit on the first drop.
It's not going to be easy but after the first drop, and bounce, I think anyone brave enough to short the second drop shouldn't do it on money they can't afford to lose. It could make you a fortune or be a complete loss, so "if" I decide to short it I will just be risking part of the money I made as profit on first drop. Basically there will be a major low coming around the end of the month and that low could be either a typically higher low or a crash low.
Regardless of which one it will be, a super important low where an incredible long can be taken. Of course if the upside FP of 787.13 is not hit today then the odds of two large drops will be slim and the pullback into the 16th should be a mild one and the move back up into the 20th-22nd should then hit the 787.13 FP... and from there we drop to the 692 FP and/or the 7063 ES FP, which when you look back at the highs from the January - February period both FP's are pretty much in that zone. It's going to be a wild month, so get ready for the opportunity of a lifetime. If the upside FP is hit today I'll be shorting it and targeting the 692 FP.
As for the 600.14 FP... because the market should rally back up into the end of this year to hit and pierce 8000, and because the cycles point to a pullback in the first quarter of 2027 that will be bigger then the current pullback coming, I lean toward that FP being hit in February or March of next year. And I think it could be another False Flag that will be created to cause the drop... like COVID 2.0 blamed on an outbreak of the measles or mumps possibly to get more sheep to line up and roll up their sleeves to take another poison shot. Just speculation here on "what" will happen, but I do lean toward that period being the time when the 600.14 FP will be hit.
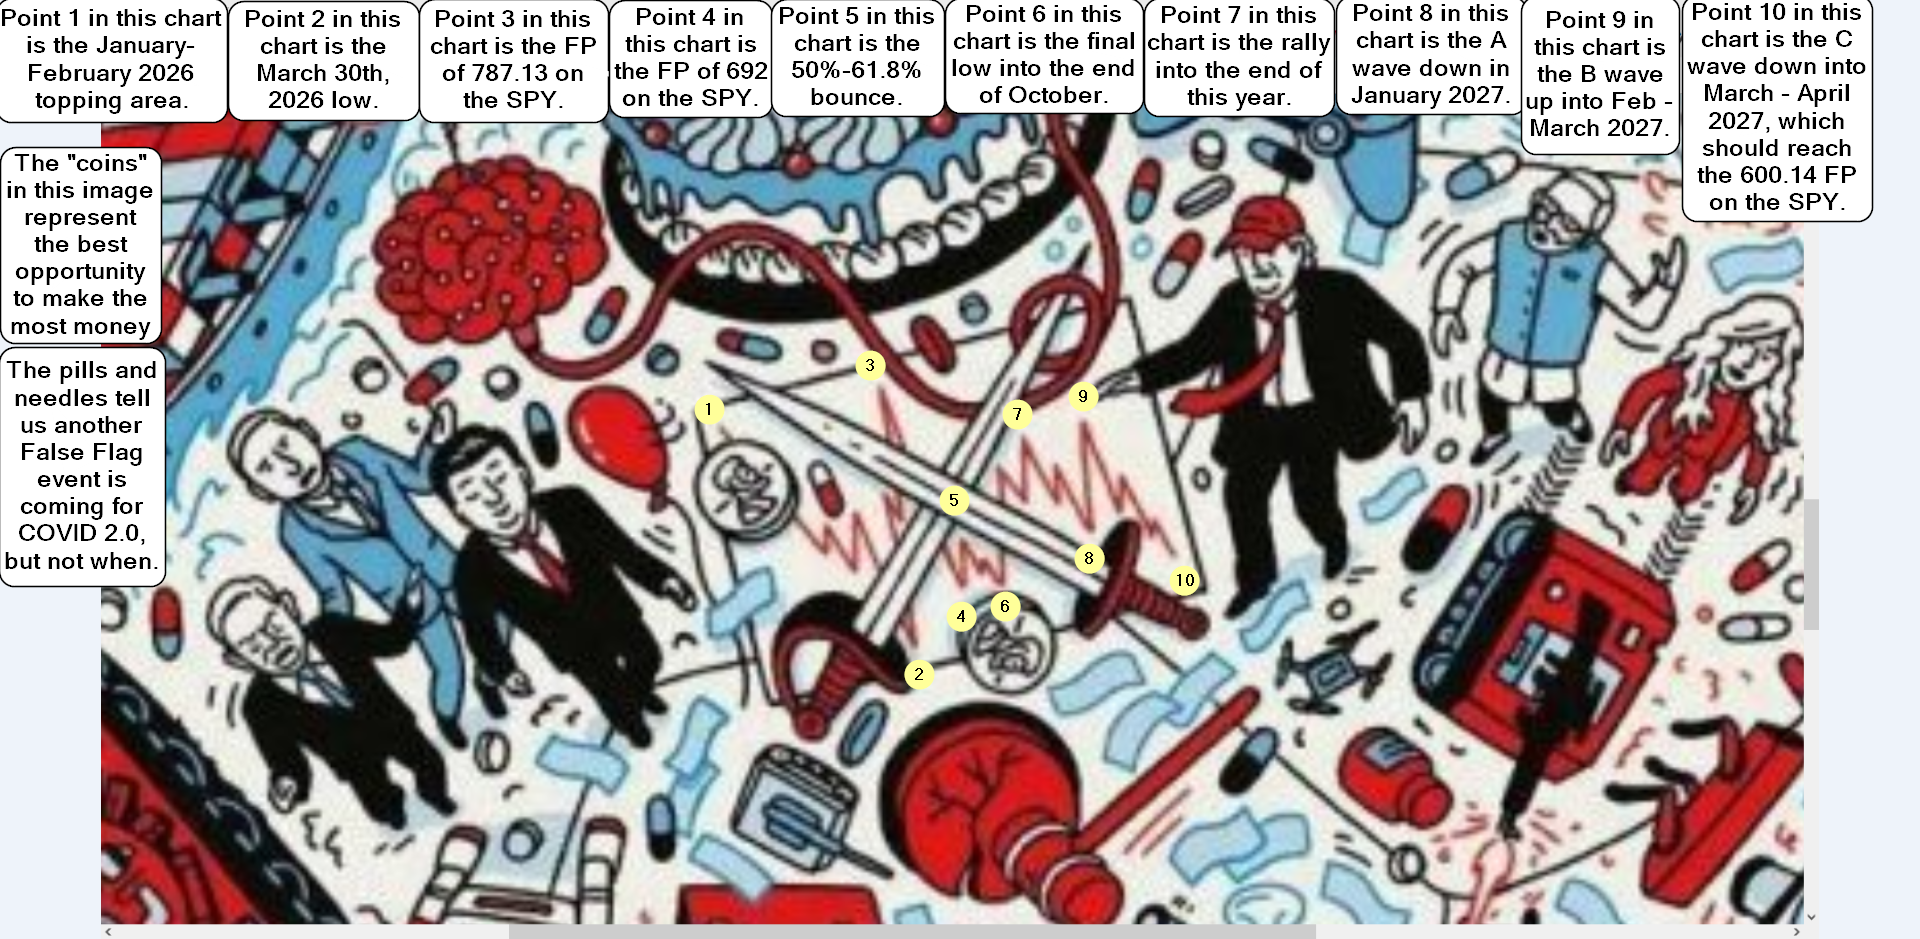
The chart above is what I think is unfolding or will unfold based on The Economist 2026 cover, which I think the stock market chart shown is not just for 2026 but extends into the first quarter of 2027. I don't think the chart reflects the degree of the moves up and down but simply points out the overall pattern that will unfold, but the larger moves do reflect as being important it seems.
Point 7 on the chart makes you think it's a lower high then the coming one today (or into the 20th-22nd window?) but I don't think that's the case. Again, I don't think the chart tells you the degree of the moves. I think we retrace all the coming drop this month into the end of the year and hit and pierce 8000 to make everything look positive for the year.
Good Luck to everyone...
Have an blessed day.