Sunday, August 23, 2026
Home Blog Page 12

ES Morning Update March 10th 2025

4

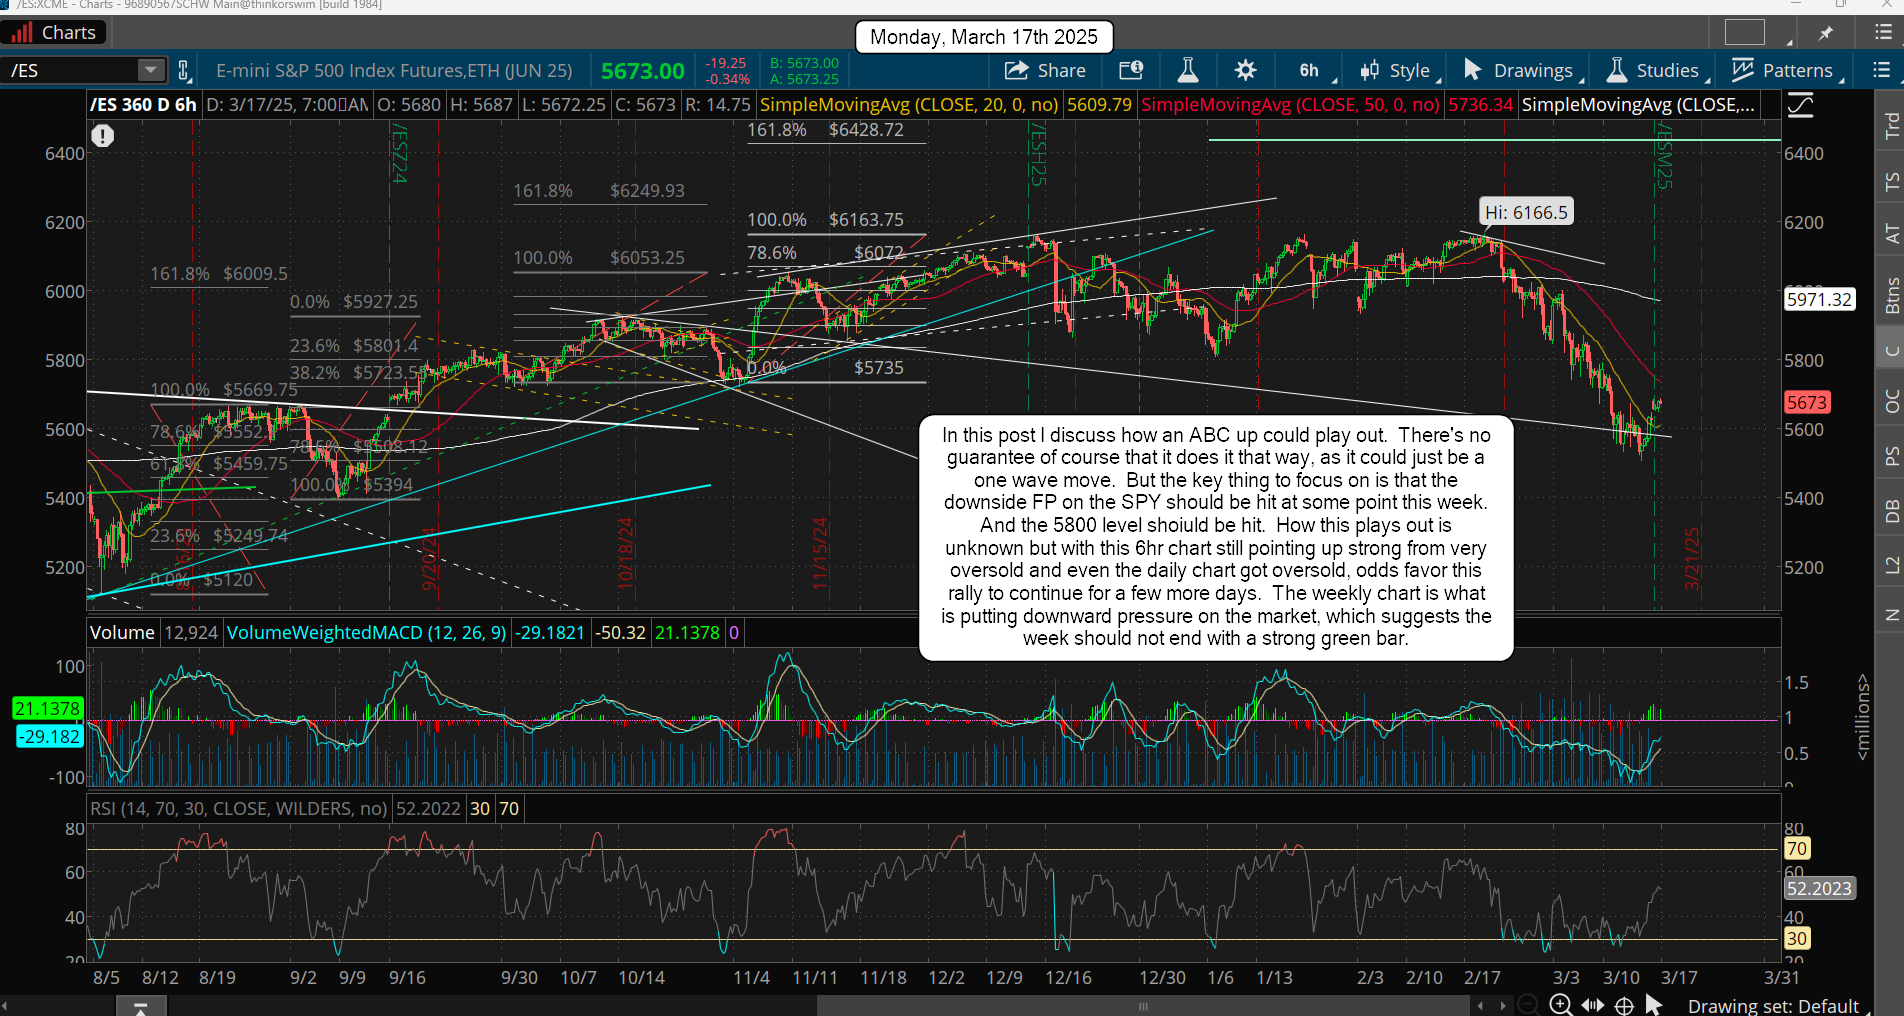
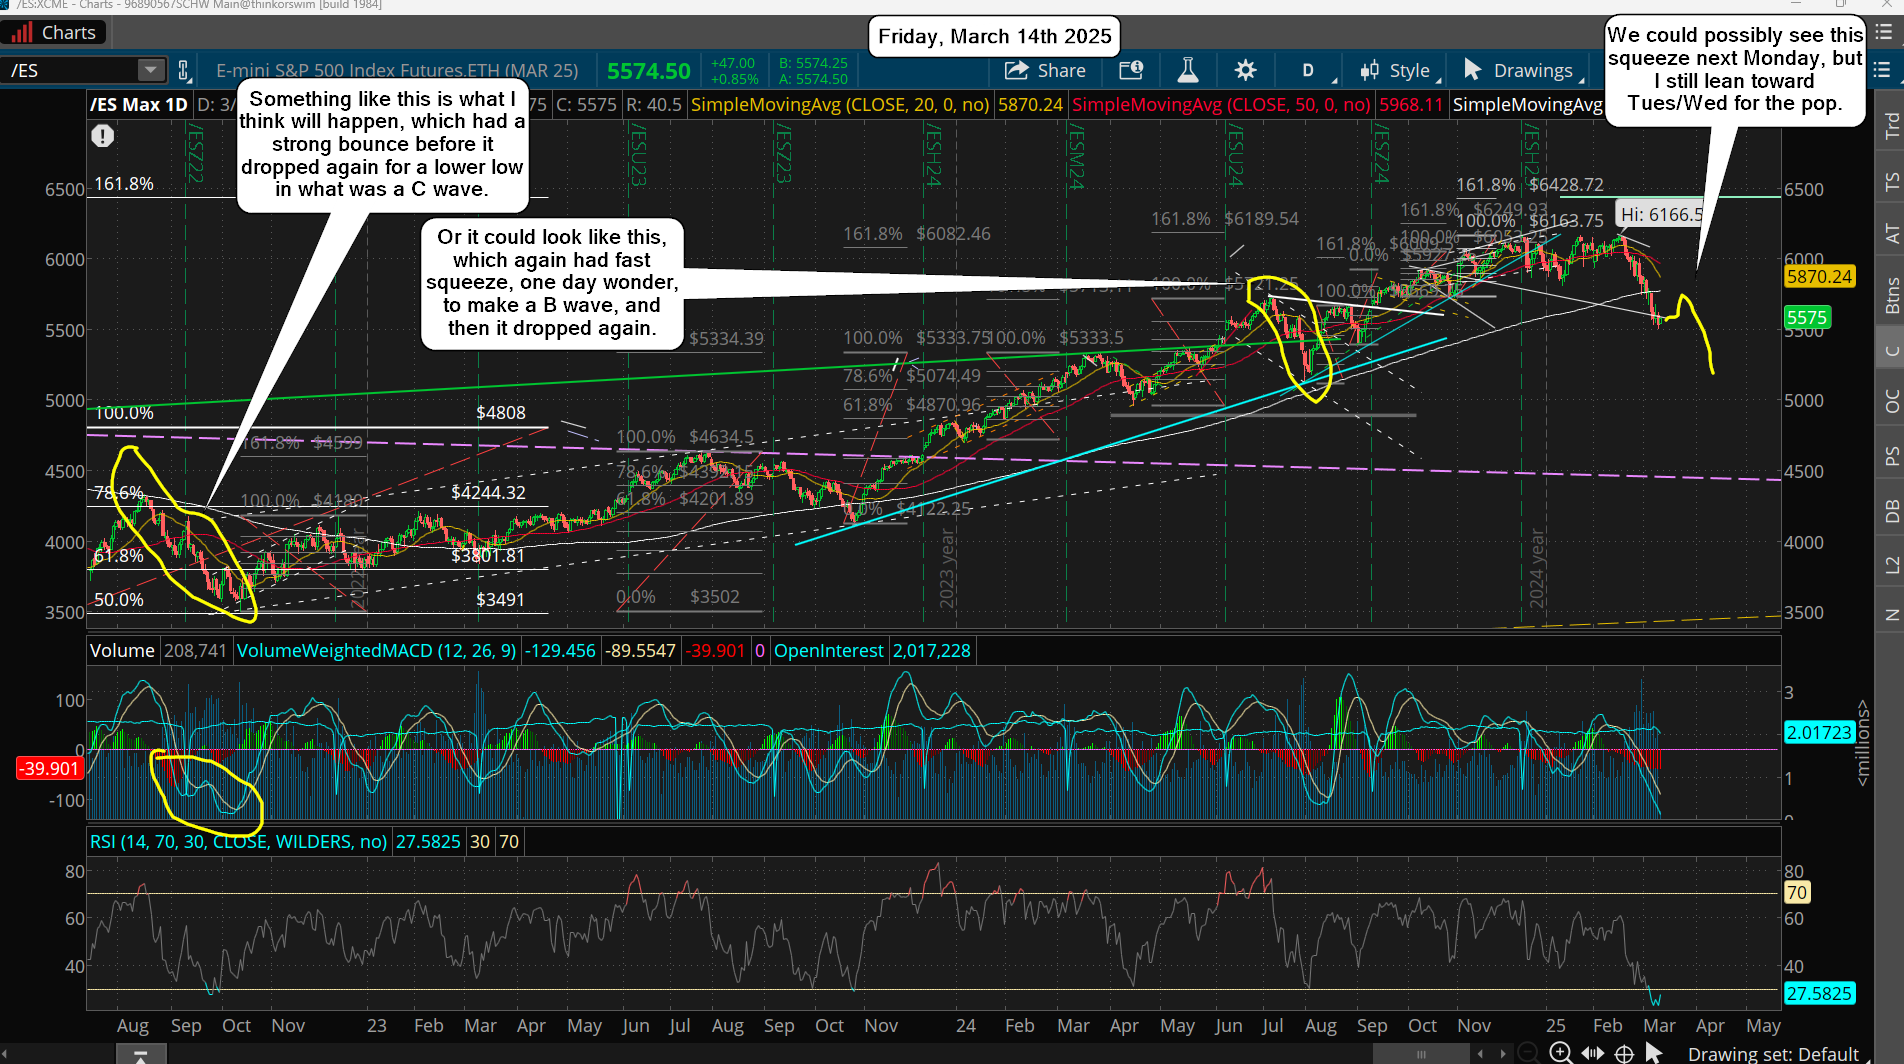
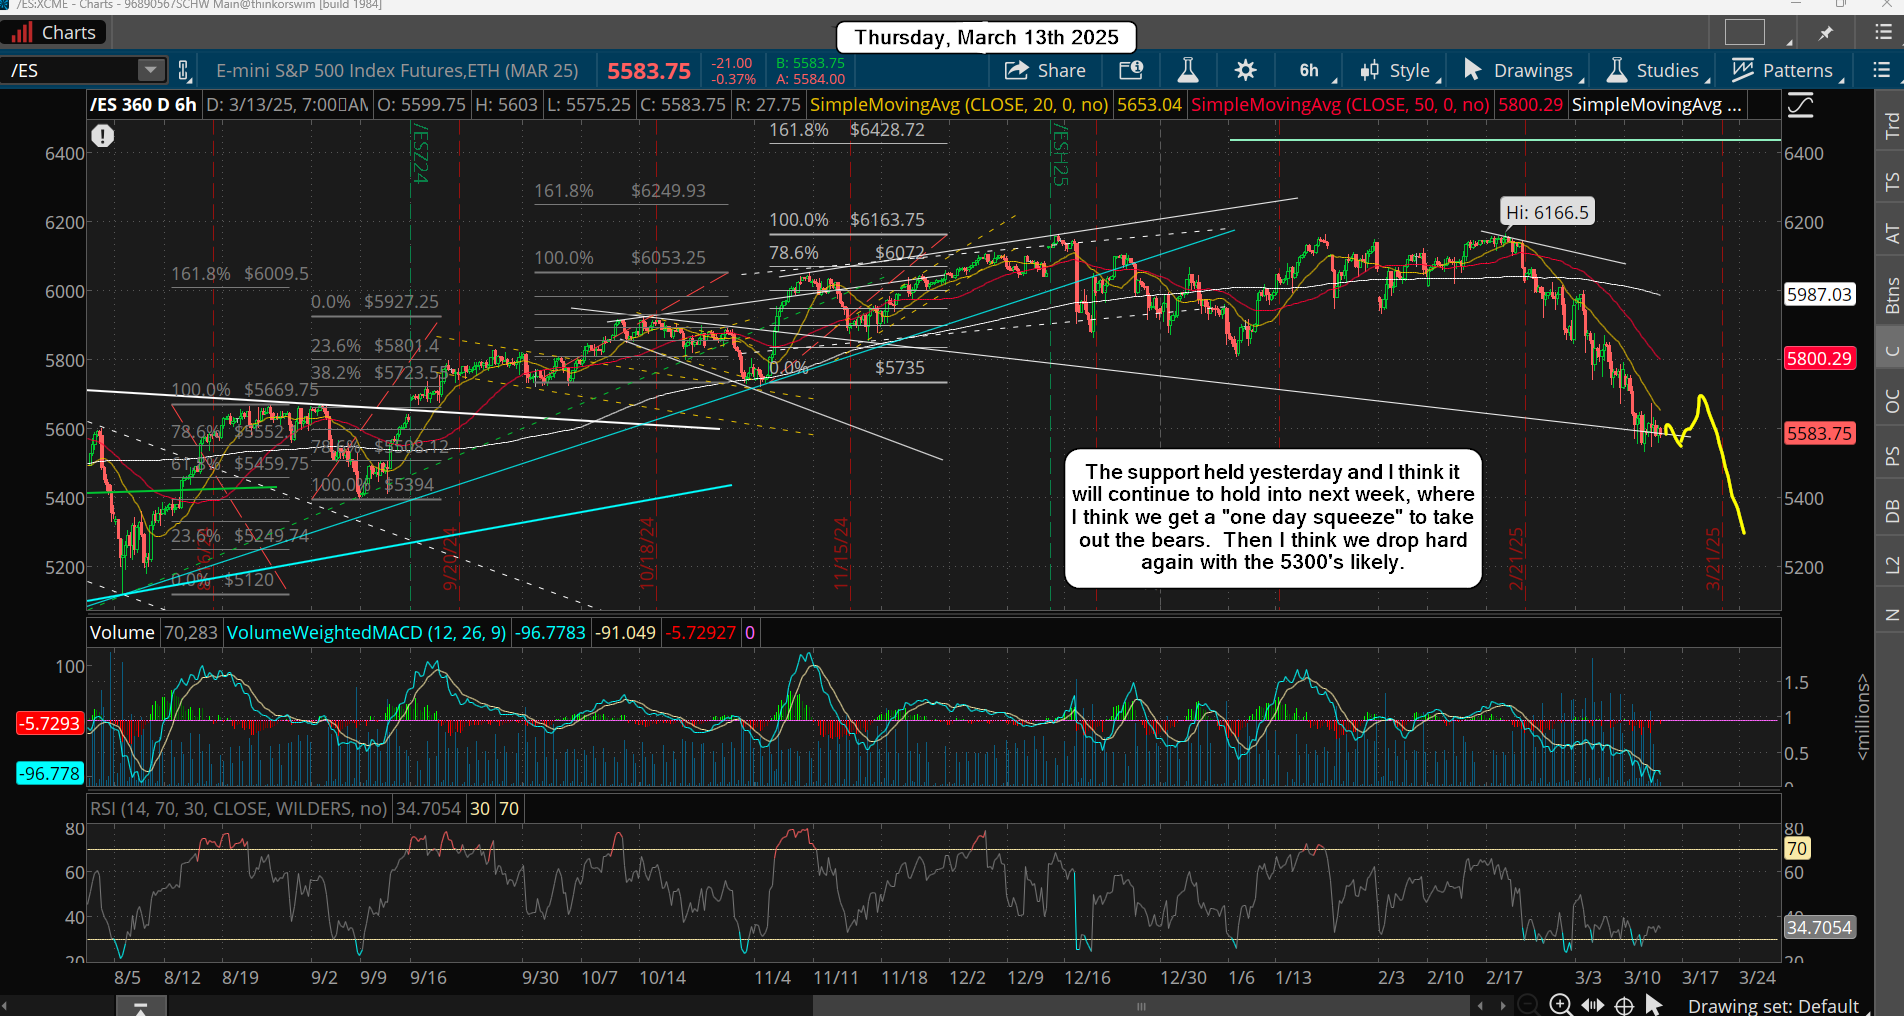
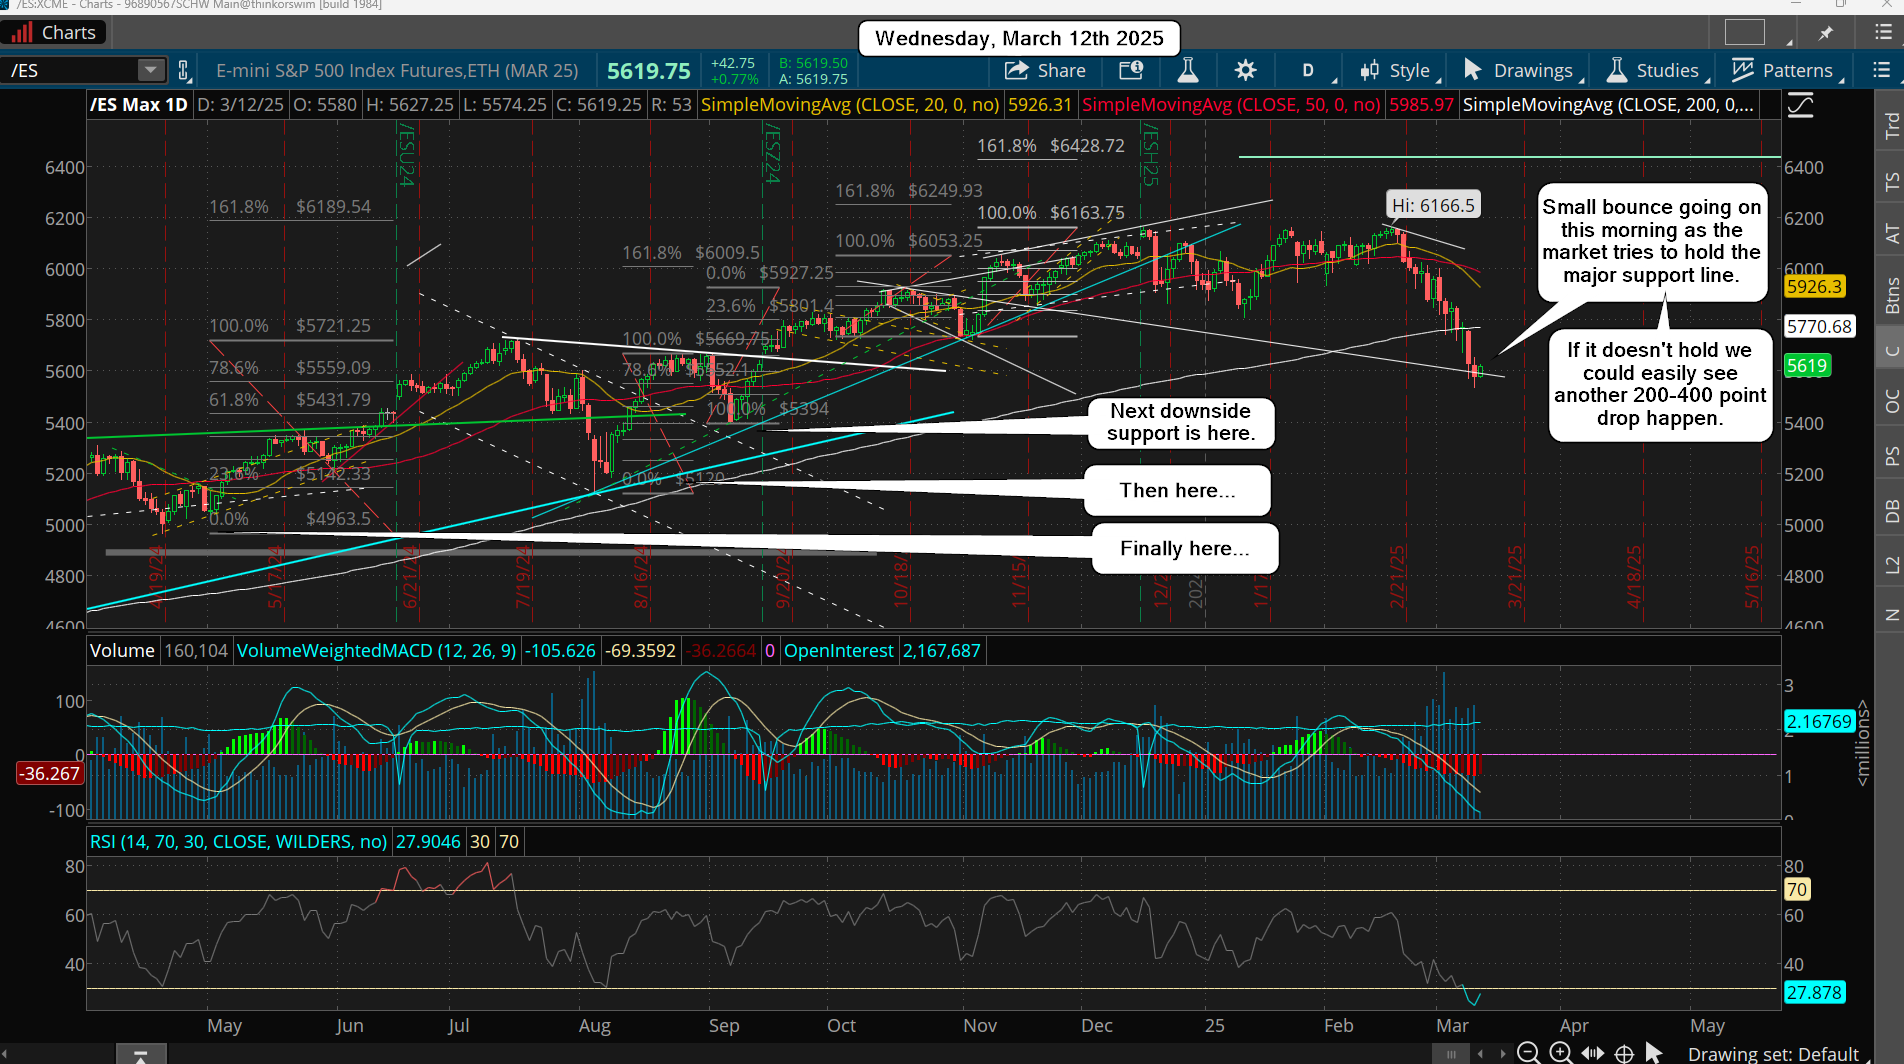
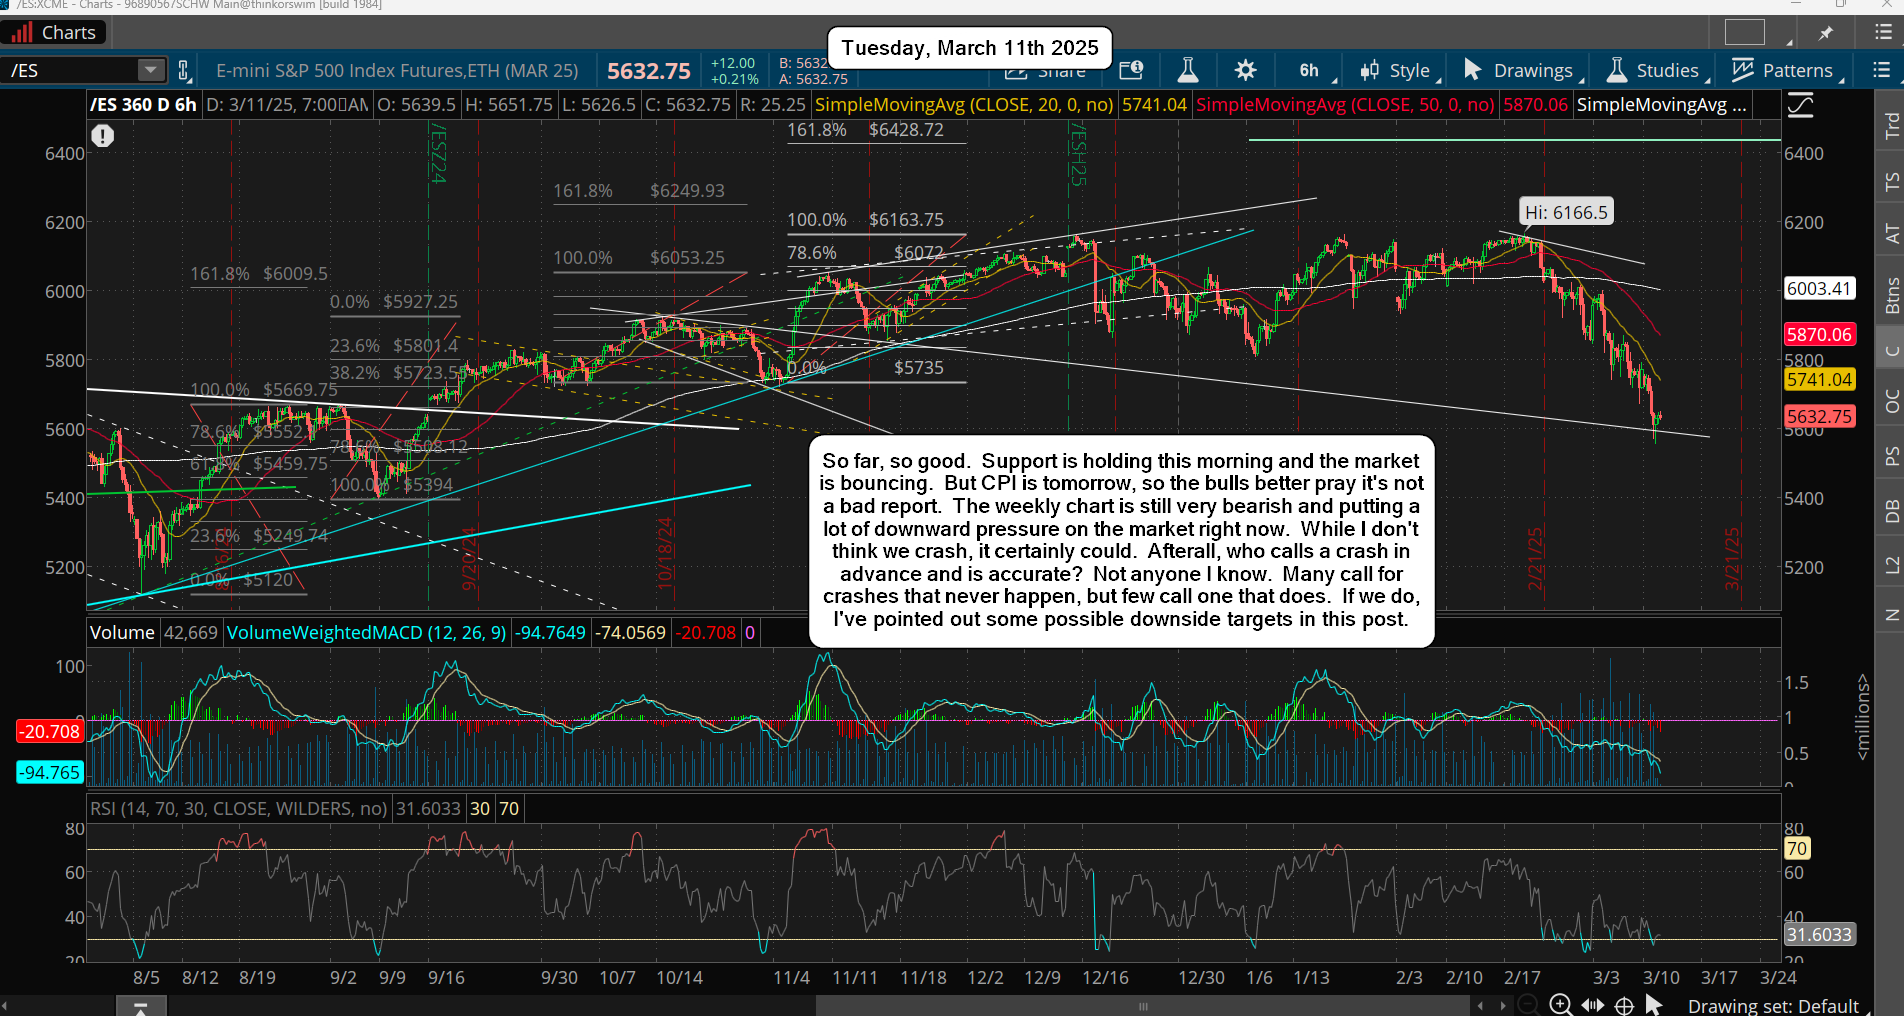
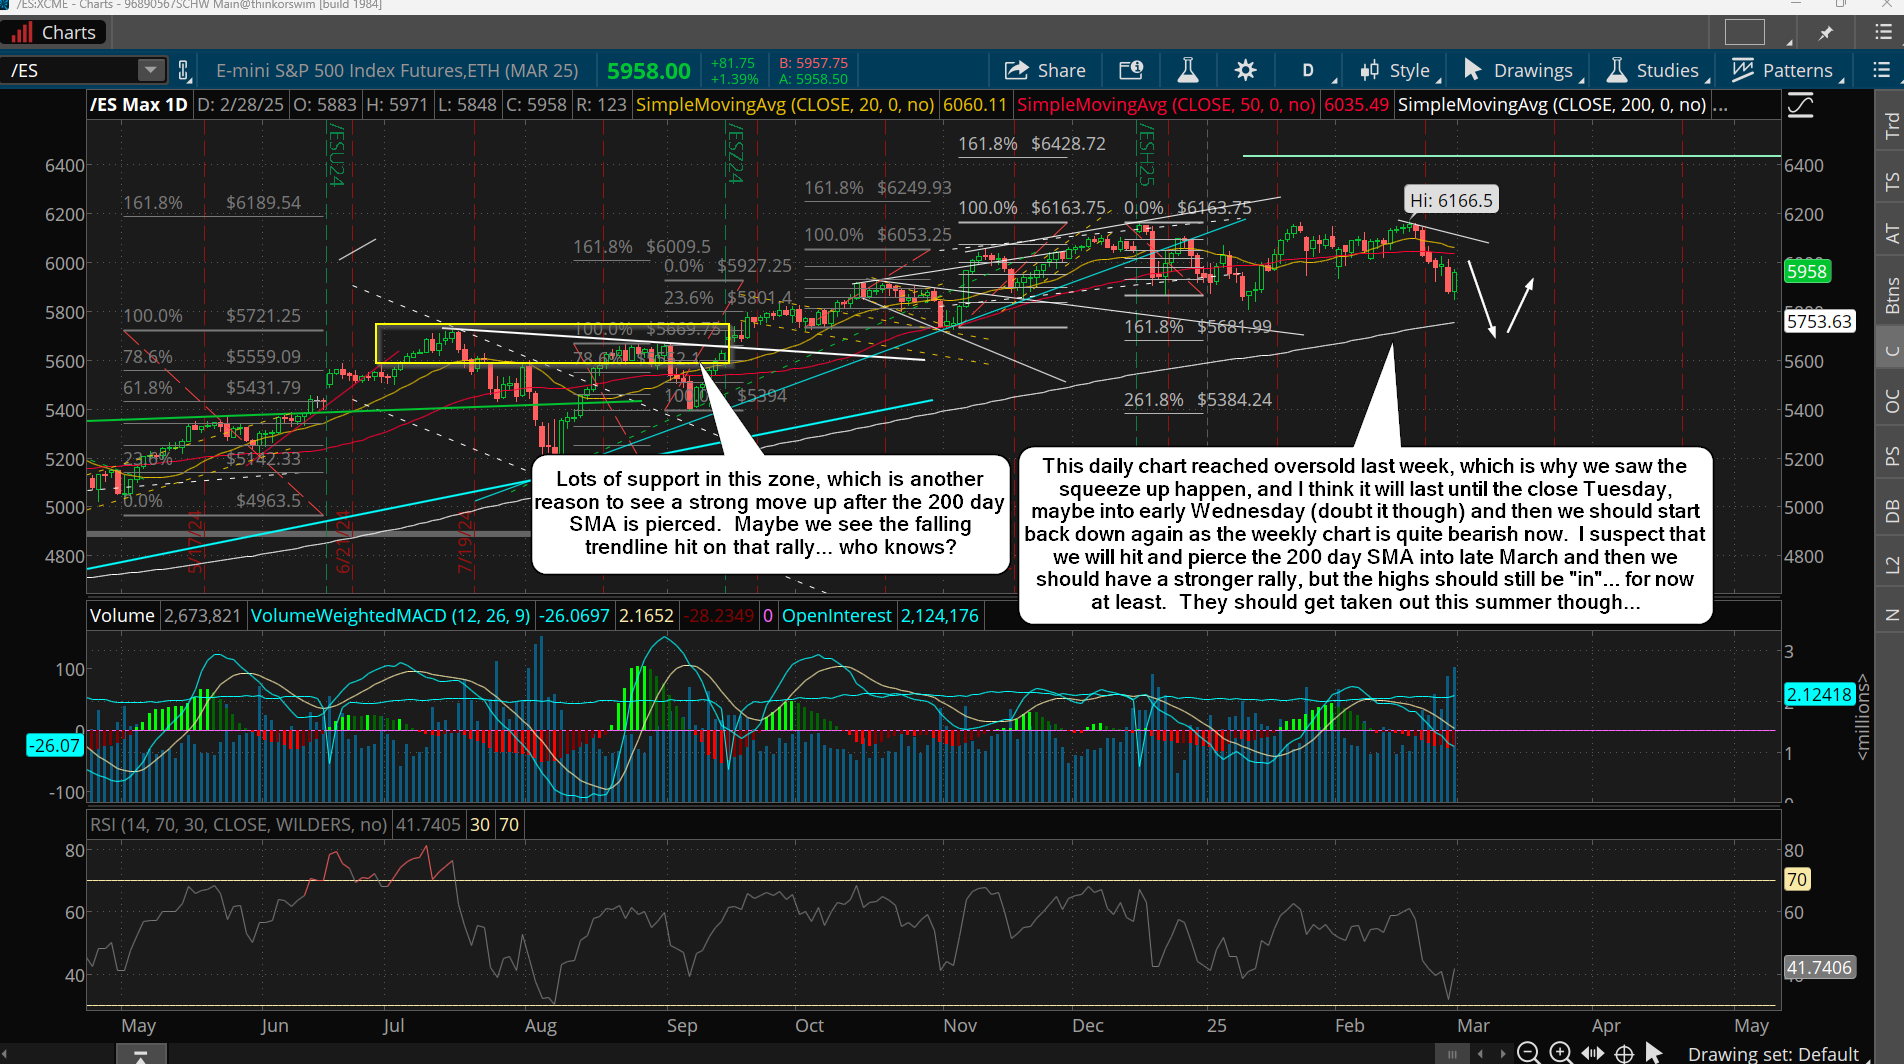
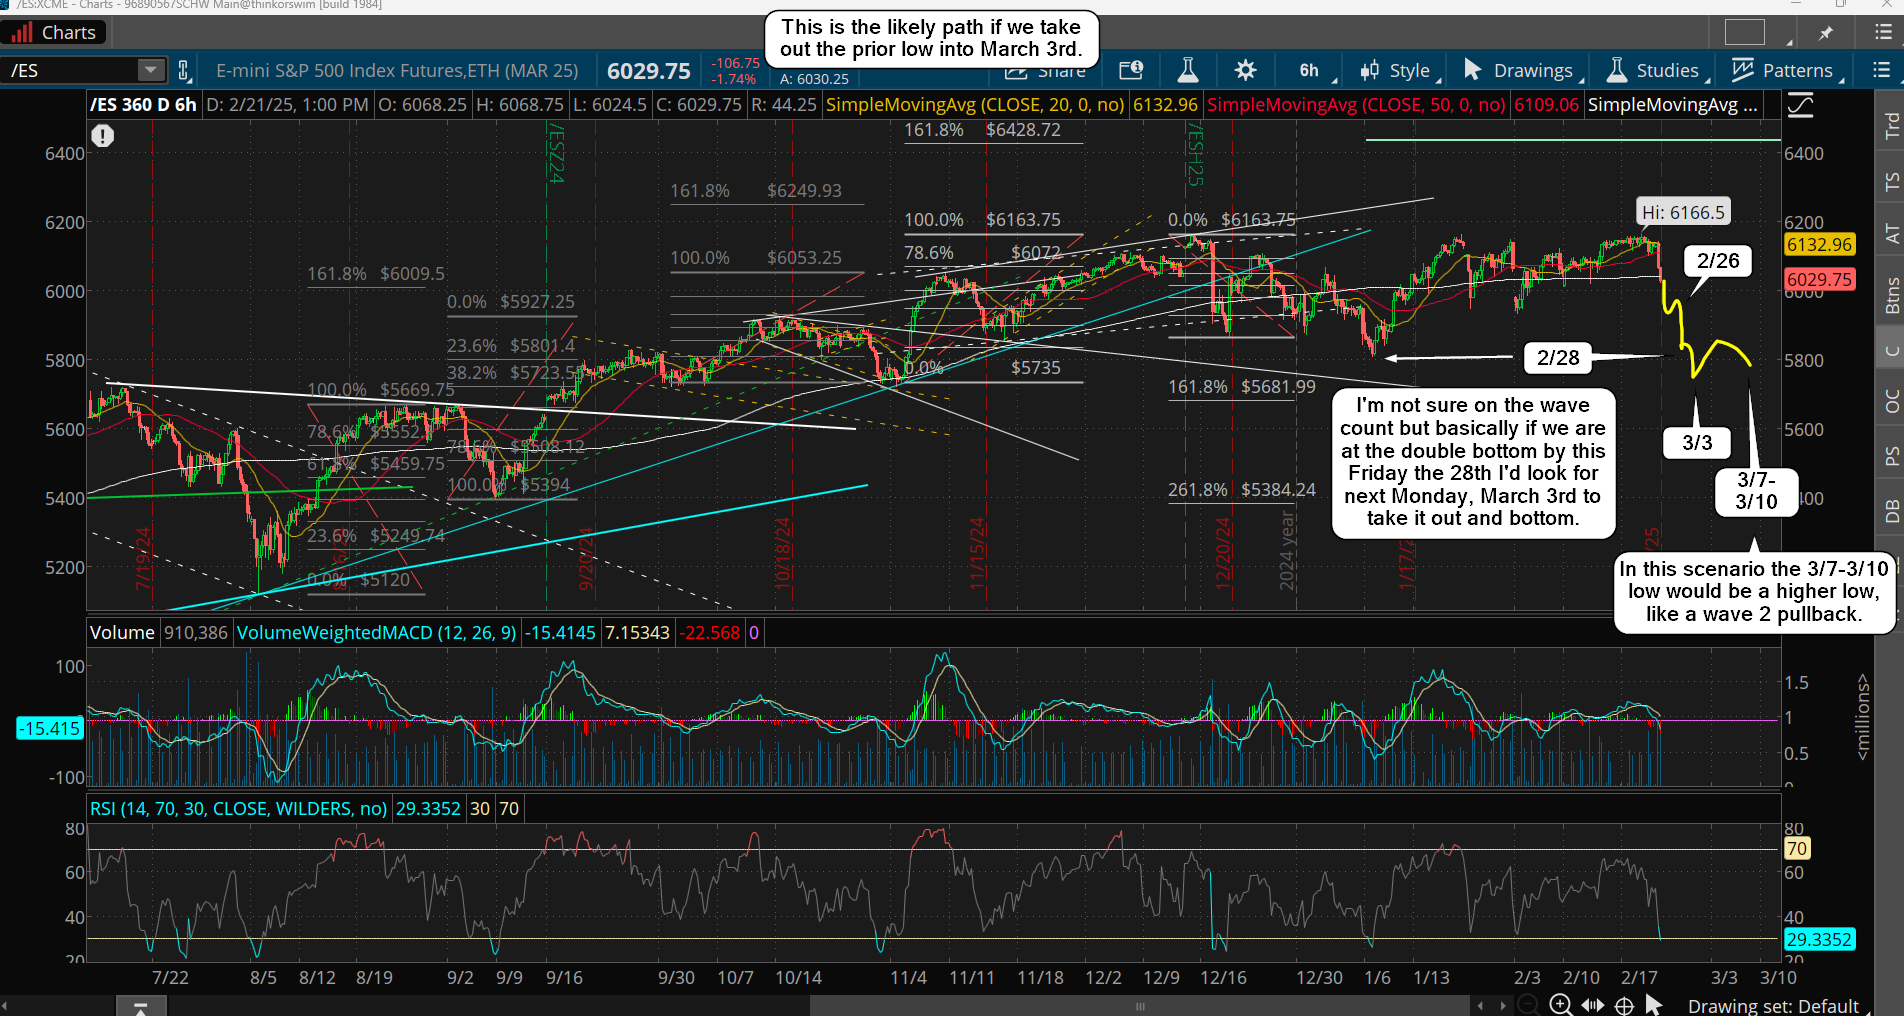
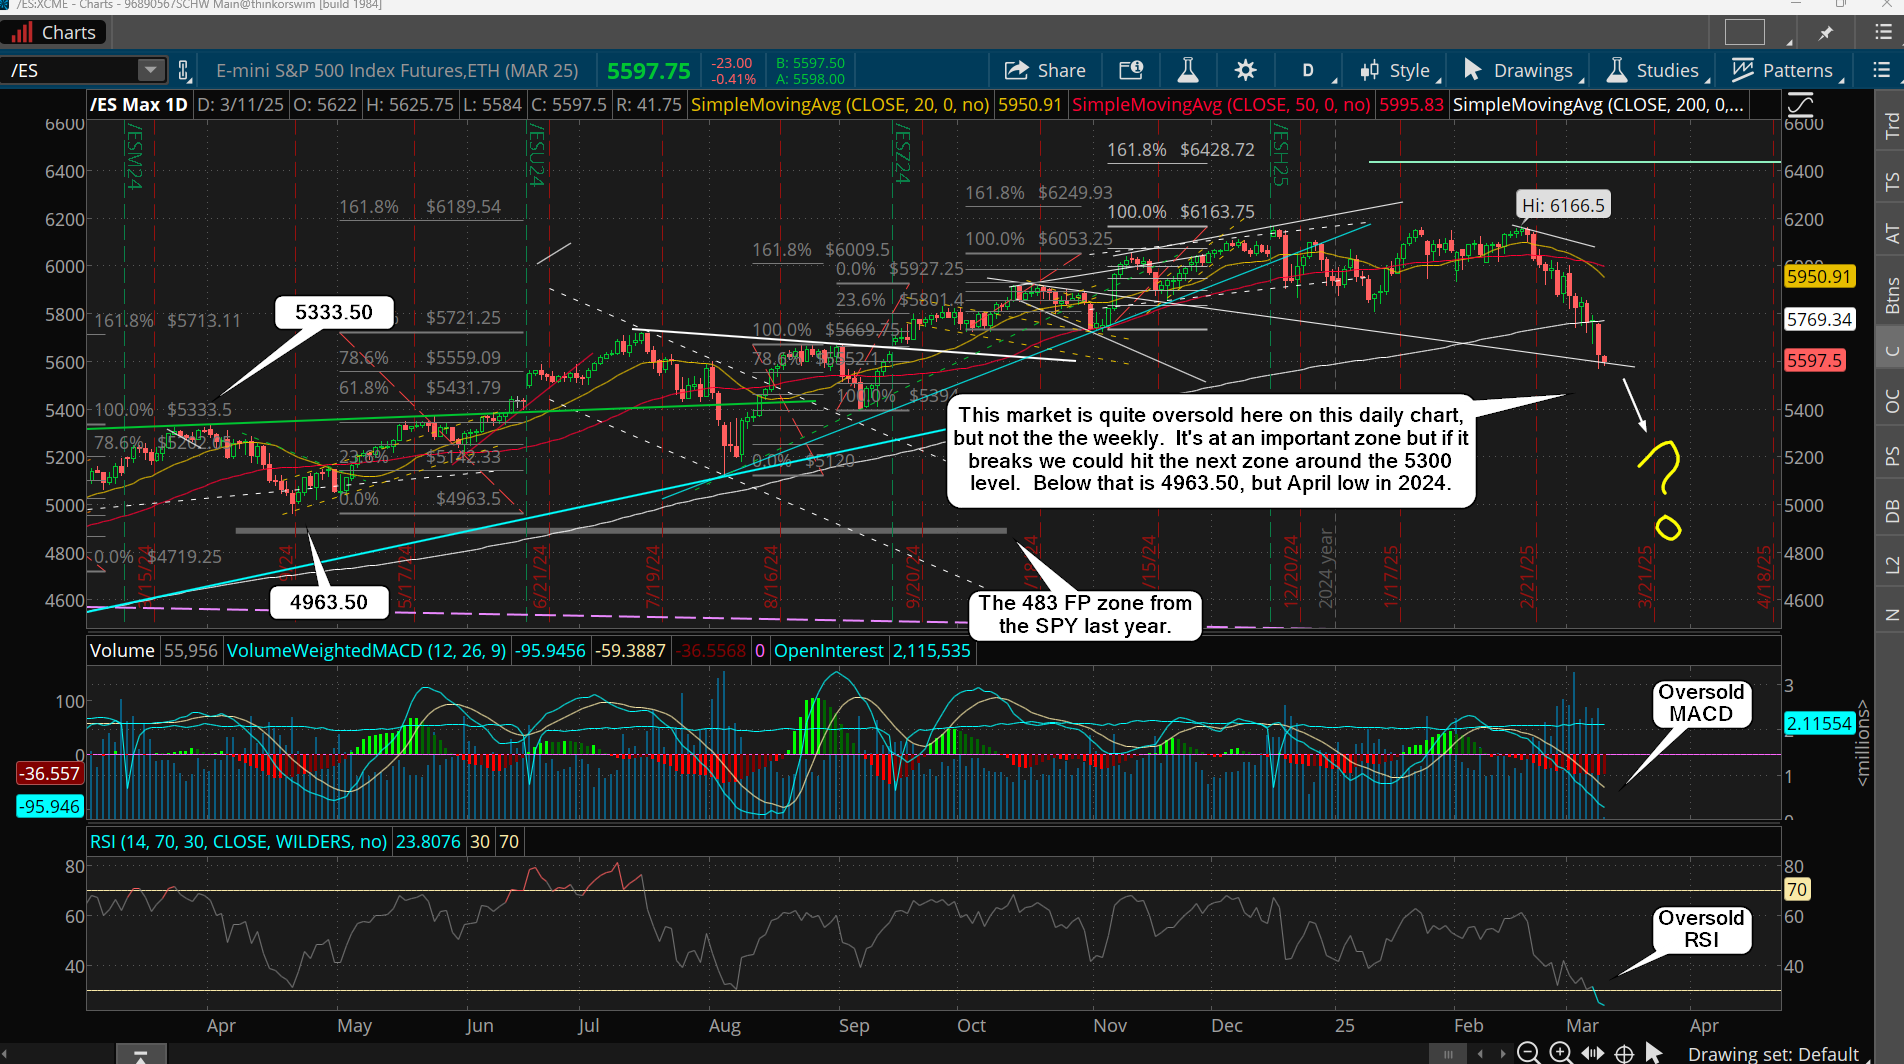
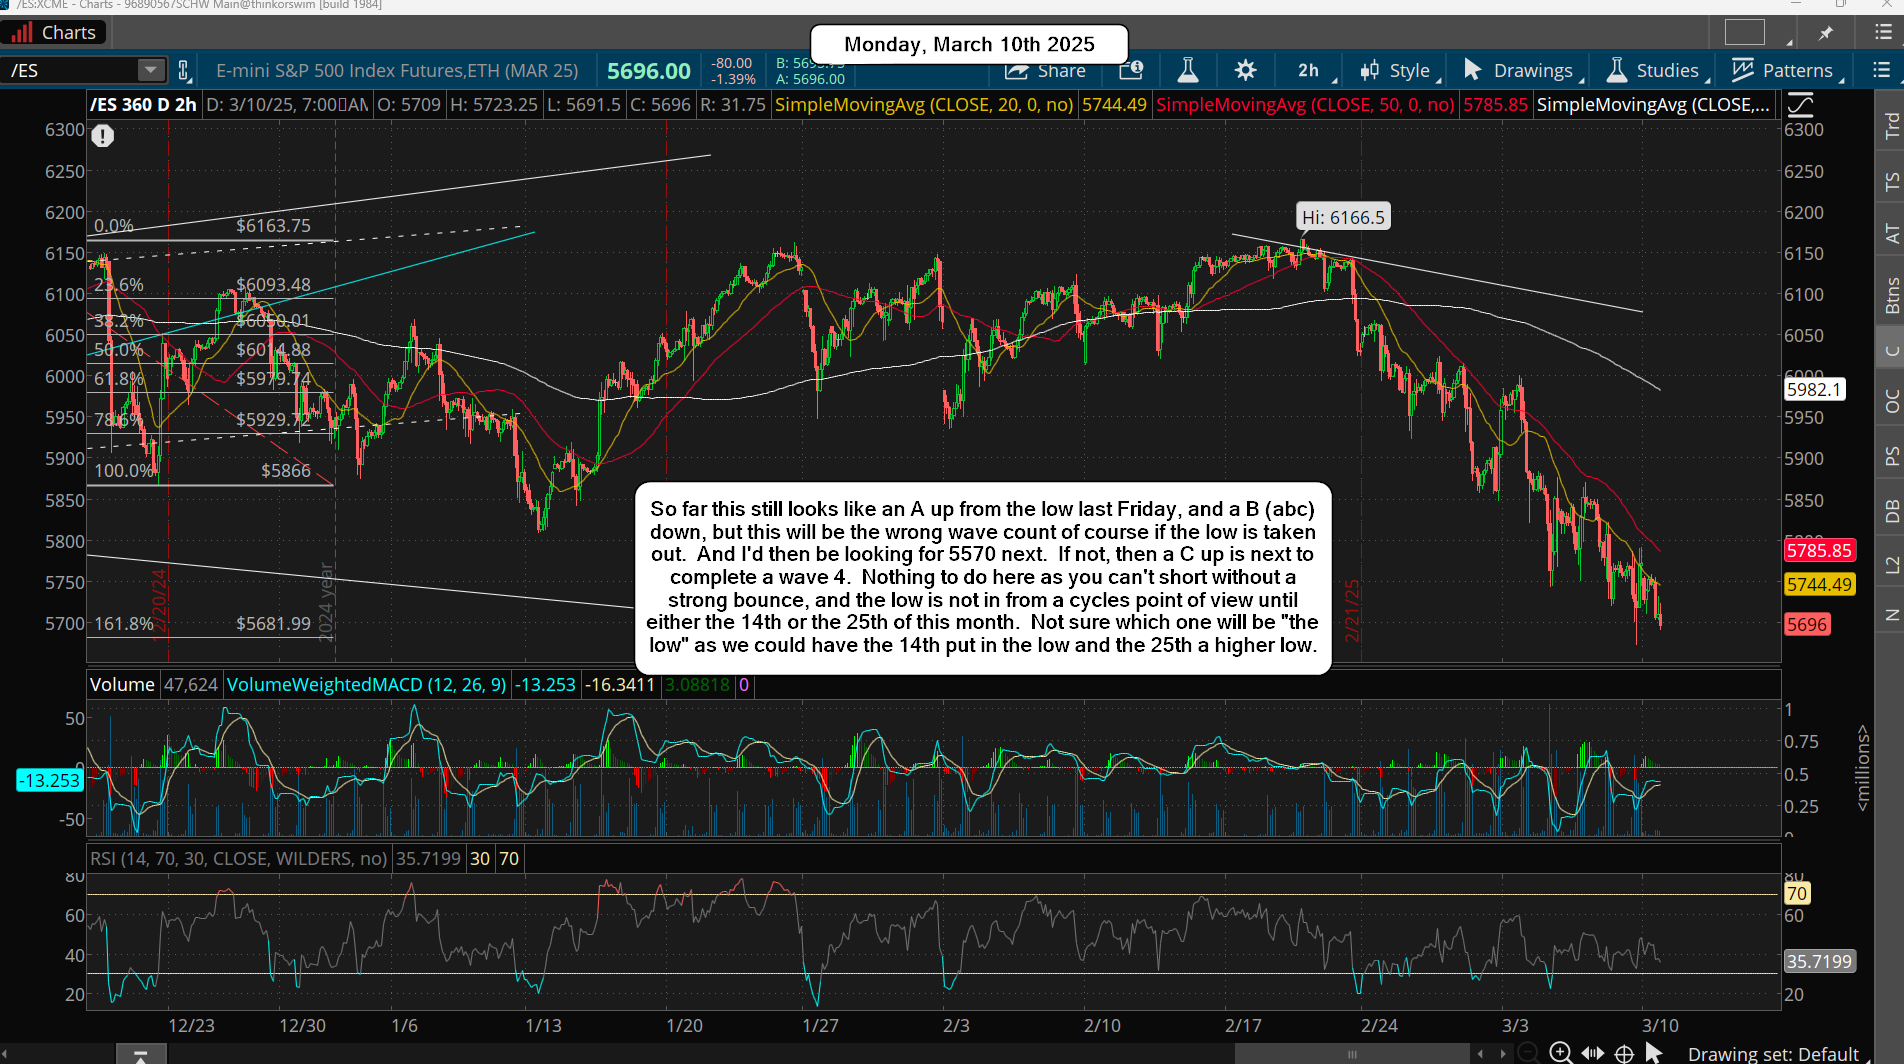
Today is the day for the bulls to attempt to put in a bottom. They must take out the 3/4 and 3/5 prior highs, which is the 5880-5900 zone basically. I thought we might see that happen last week with a squeeze after the NFP Report but it didn't happen. Instead we dropped lower into a midday new low Friday before recovering some in a late day rally.

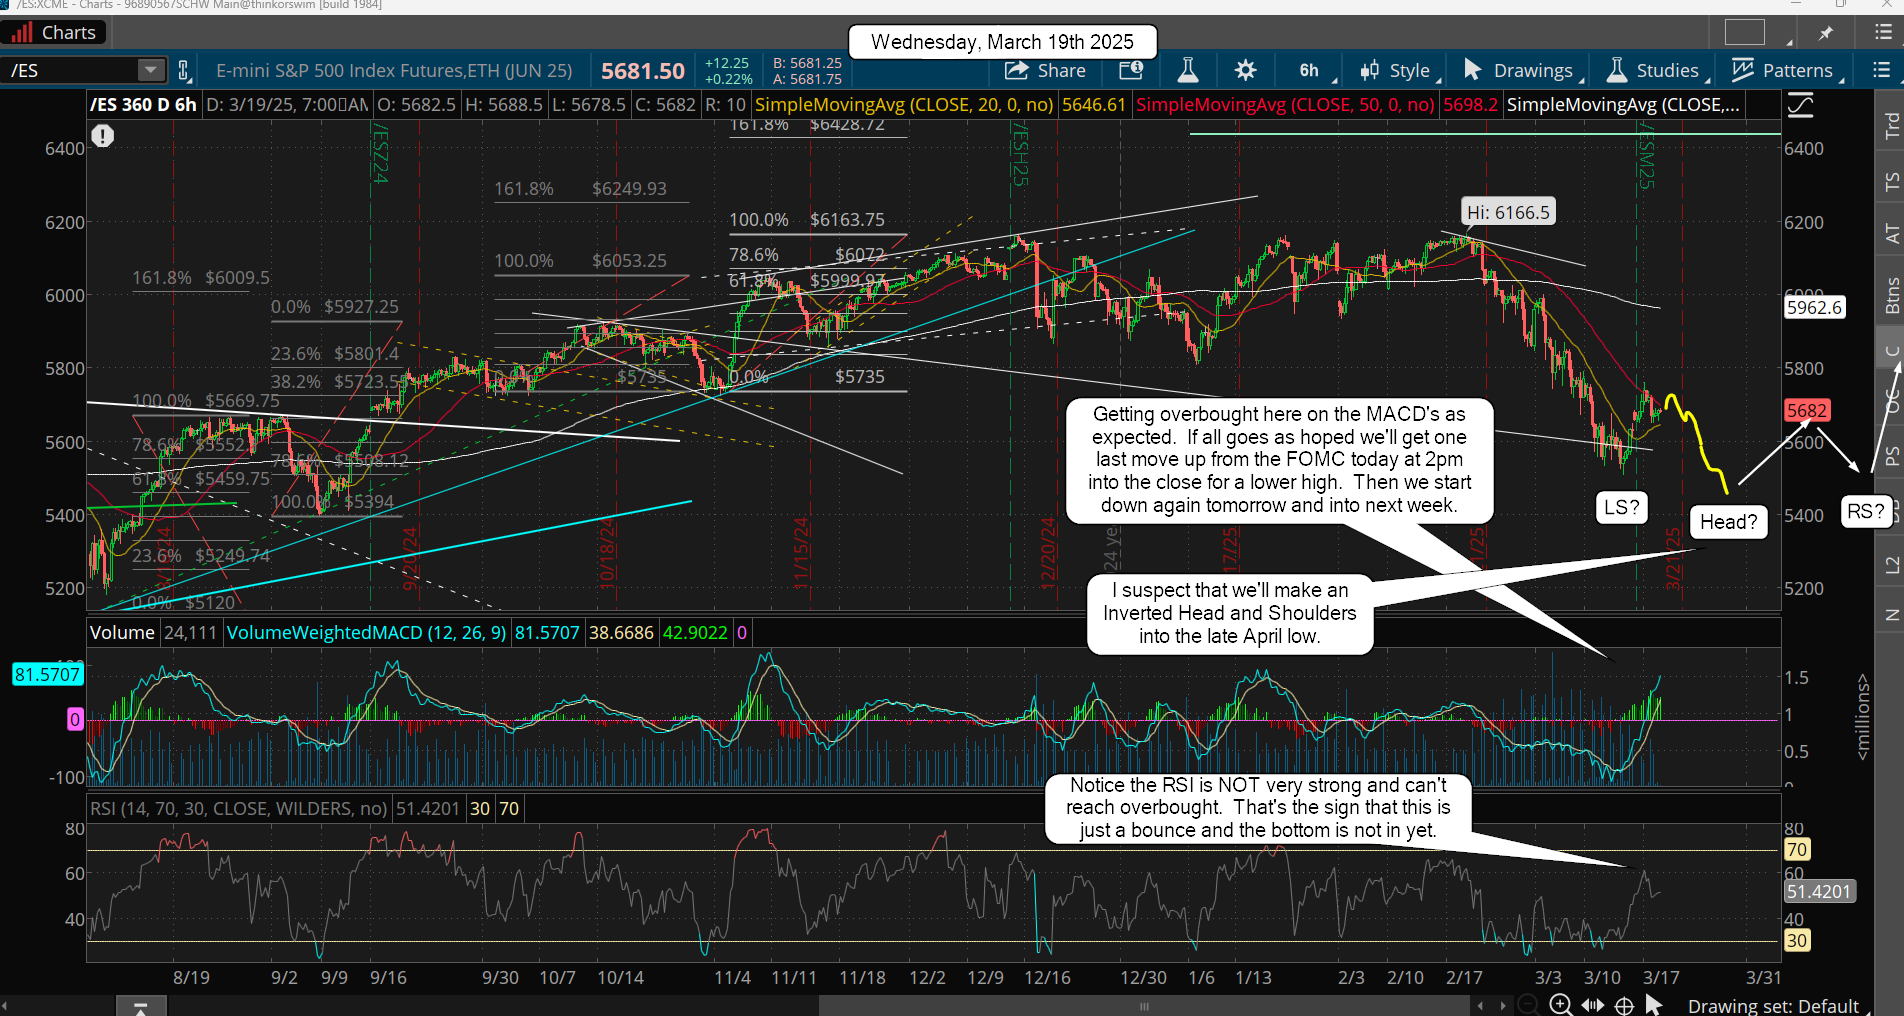
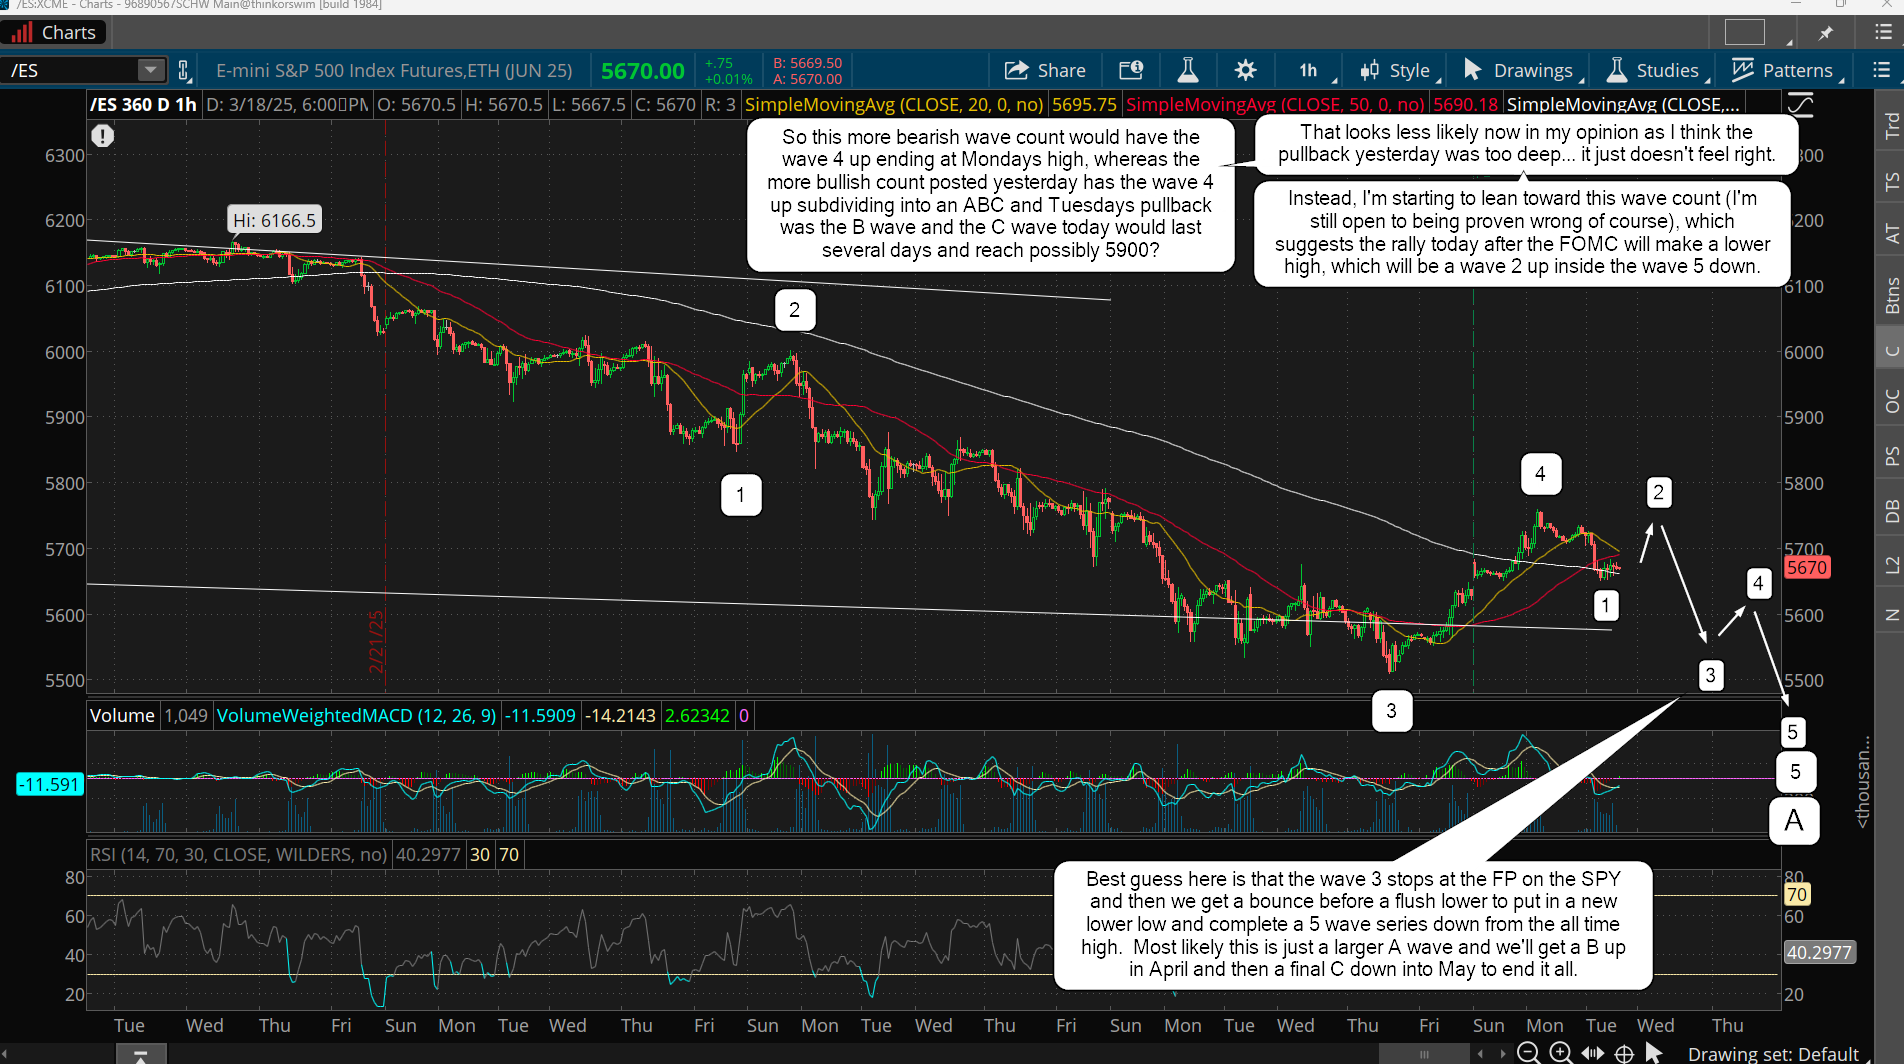
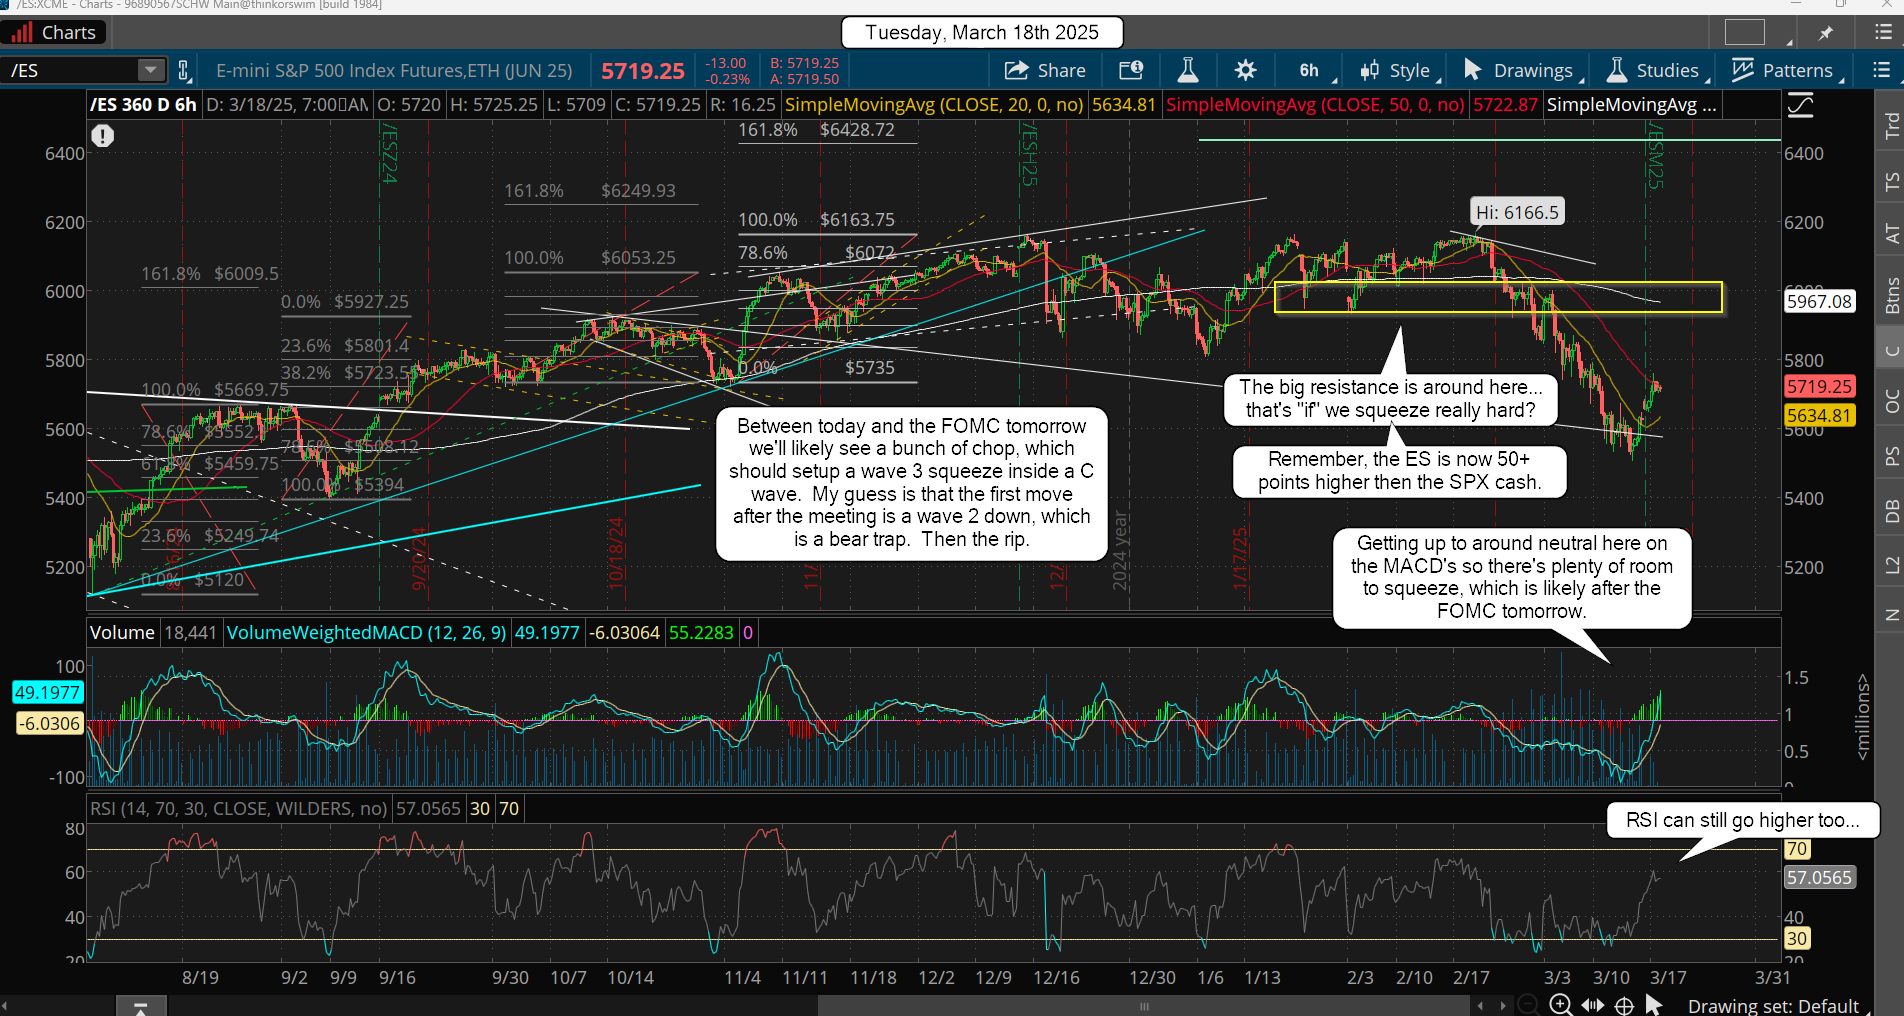
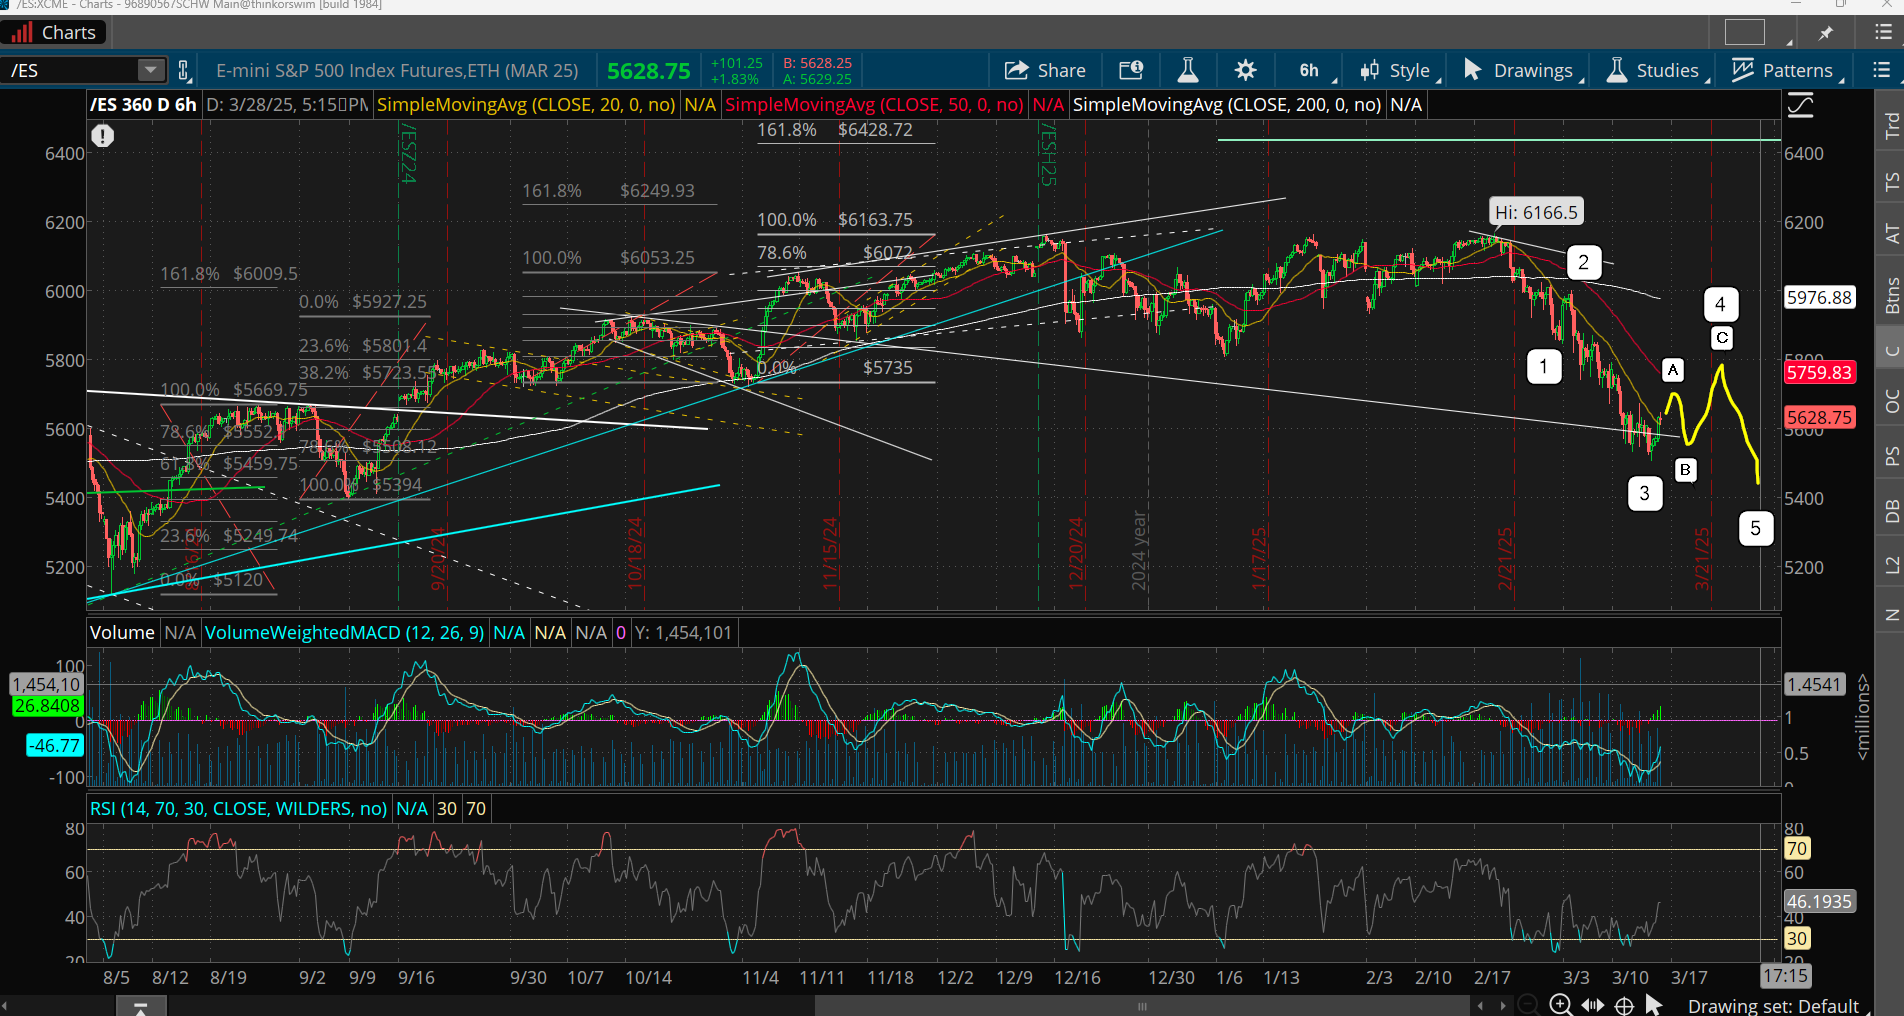
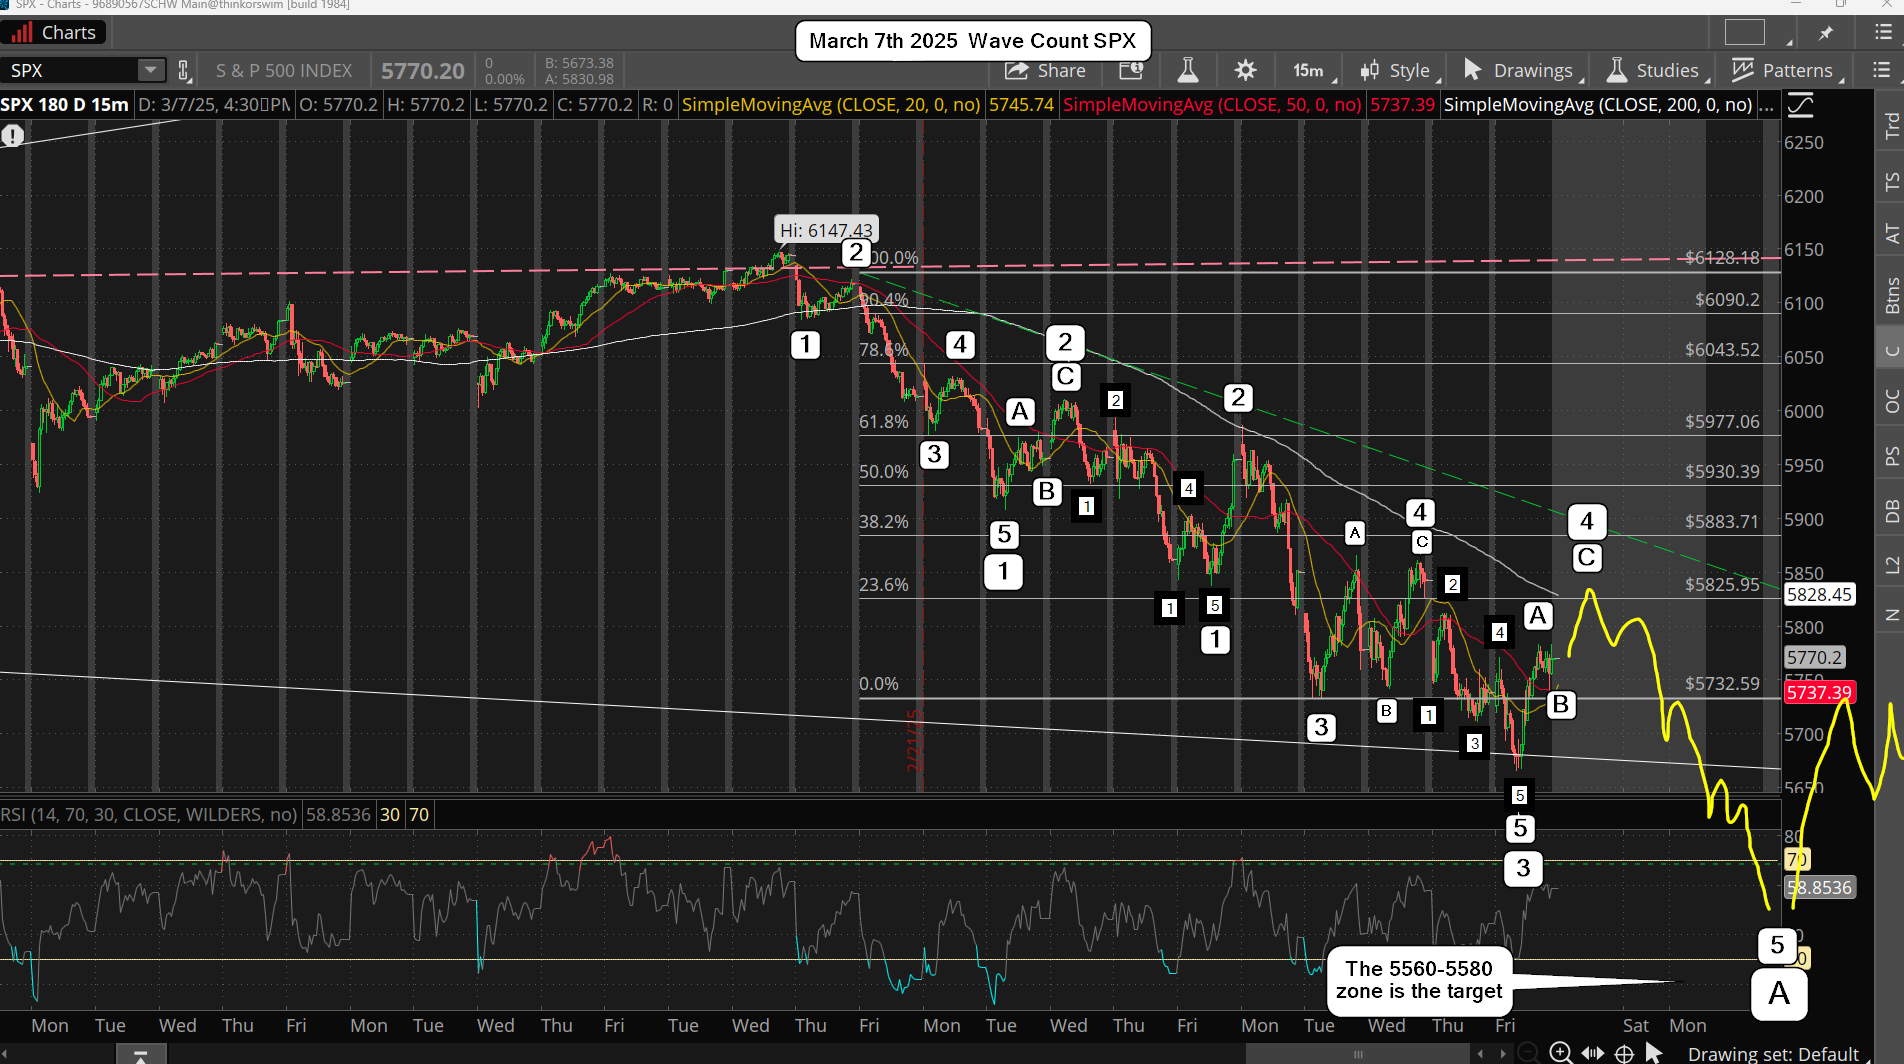
If that was an A wave then the sideways to slightly down pullback into the close would be the start of the B wave. Next we should see a C wave up, that that should be today, which is the bearish case and the entire ABC would be a wave 4 I believe, and that would leave a wave 5 down to the 5560-5580 zone still to come into the end of this week.

This is my lean as I just don't think the bulls can take out the overhead horizontal resistance today. If they can then we'd be starting a 5 wave rally up (larger wave 1), not an ABC corrective wave 4, but I don't think that's the case. My "best guess" is that we finish the ABC up for a wave 4 today, start wave 1 down of the final 5th wave into tomorrow.

Bounce back up some for the wave 2 by the close Tuesday, and then the CPI comes out Wednesday morning and we see the start of the wave 3 down inside wave 5, which should complete the wave 4 and 5 to end that larger wave 5 by this Friday. That entire 5 wave move down from the all time high will then complete a larger A wave.

Have a blessed day.

ES Morning Update March 7th 2025

1

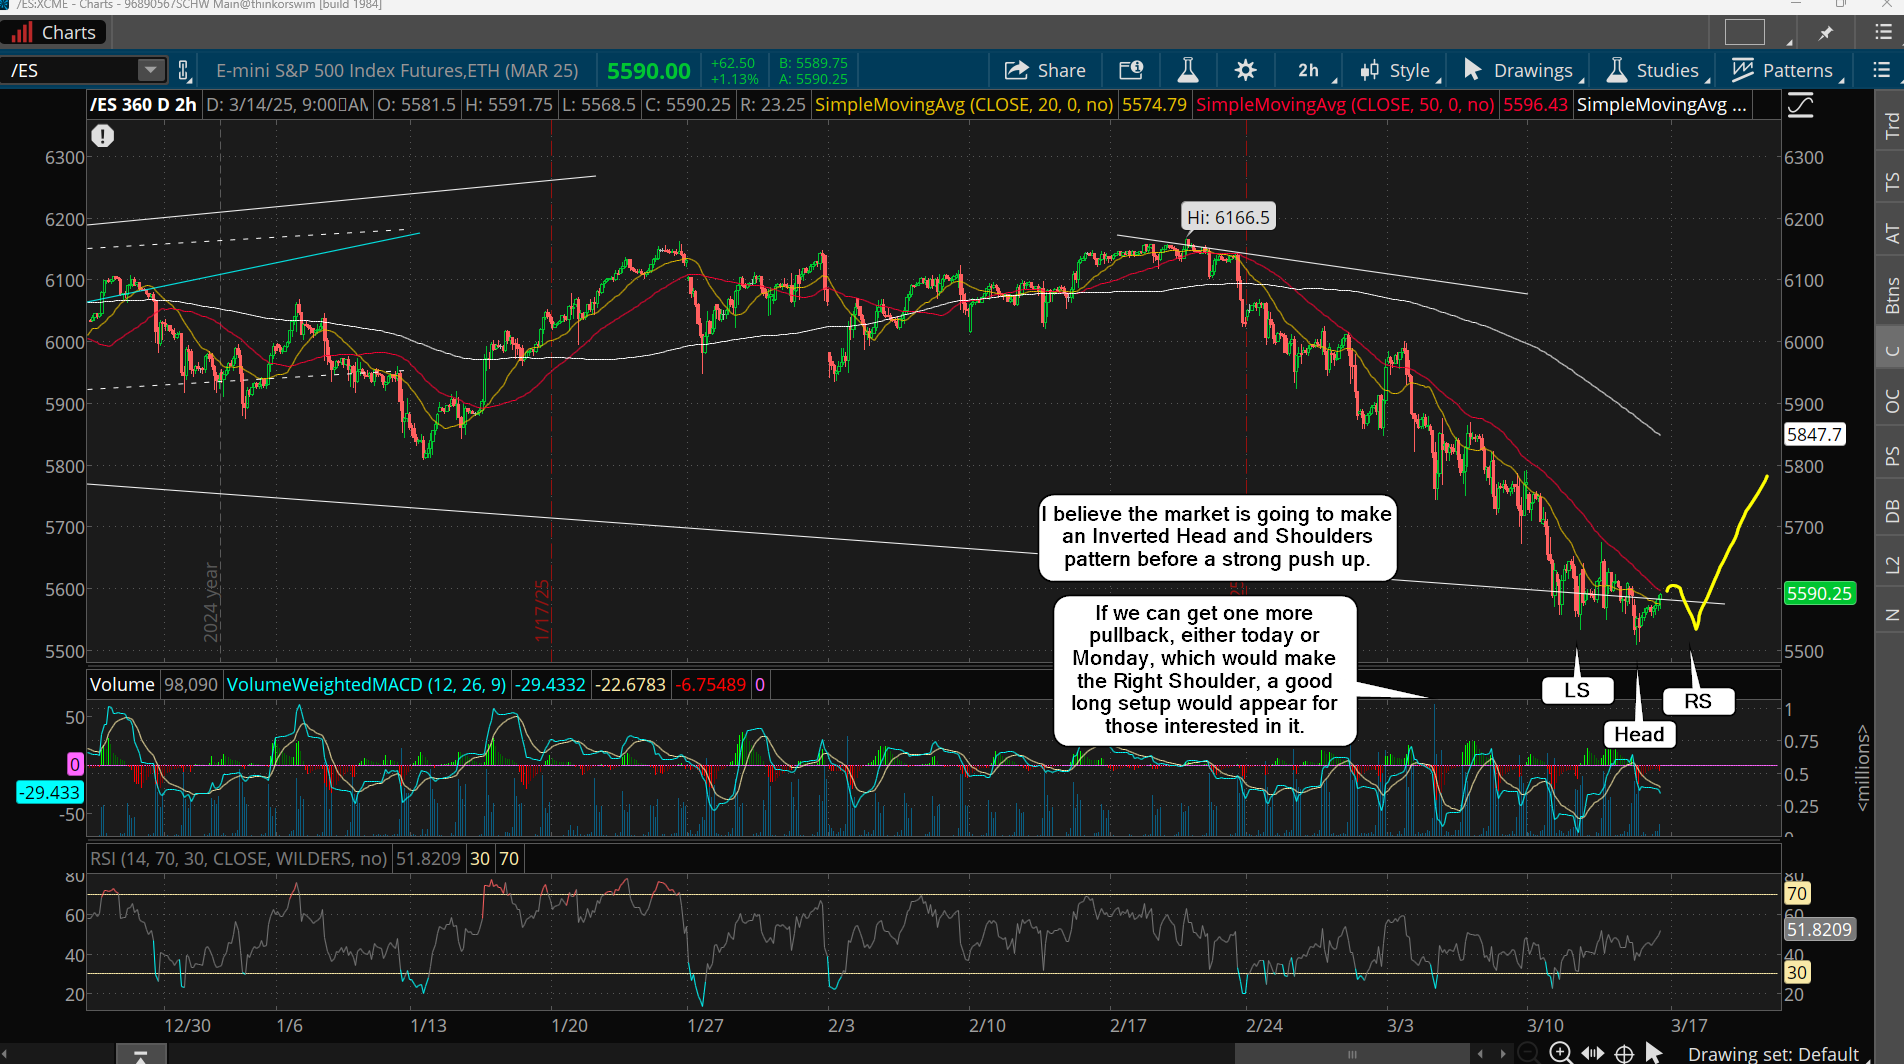
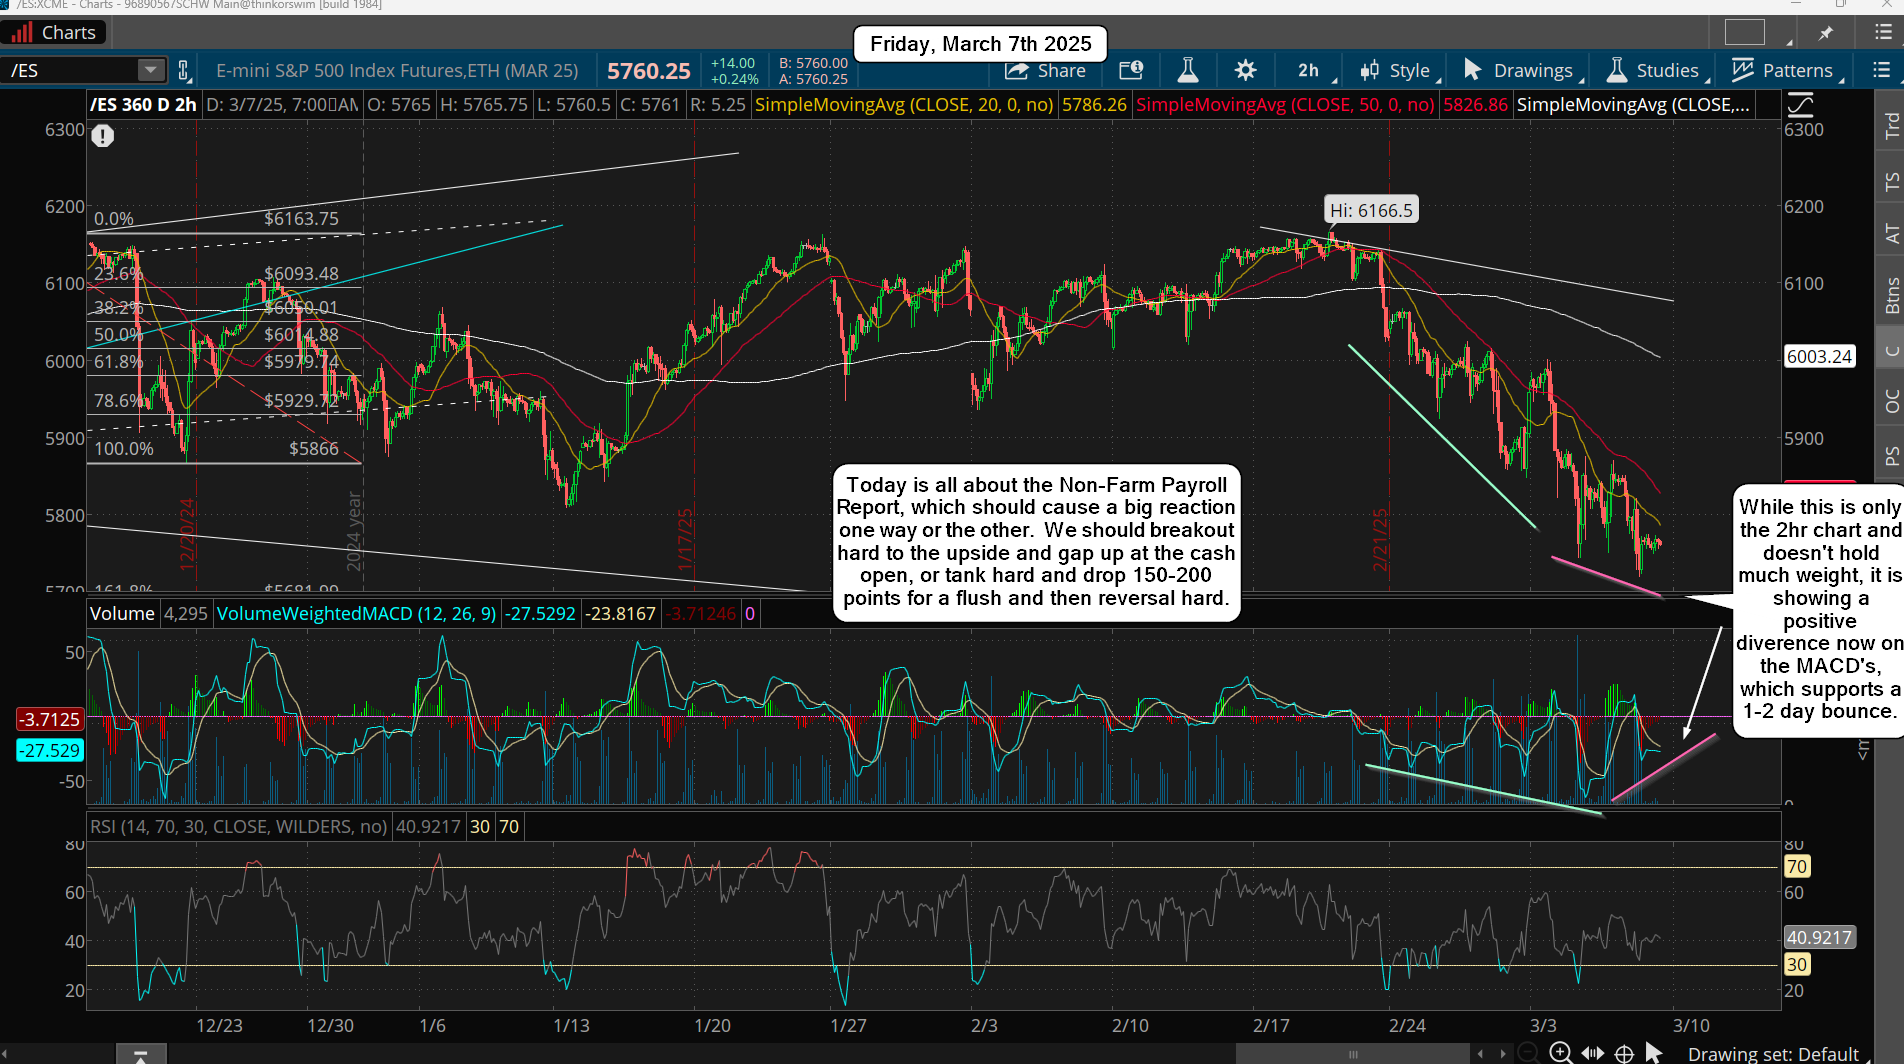
We sold off into the close yesterday as expected but I thought it would be just a wave 2 pullback, but instead we took out the low and made a new lower low. What's next? Here's what I posted in the free chatroom yesterday and I still think one or the other will happen.

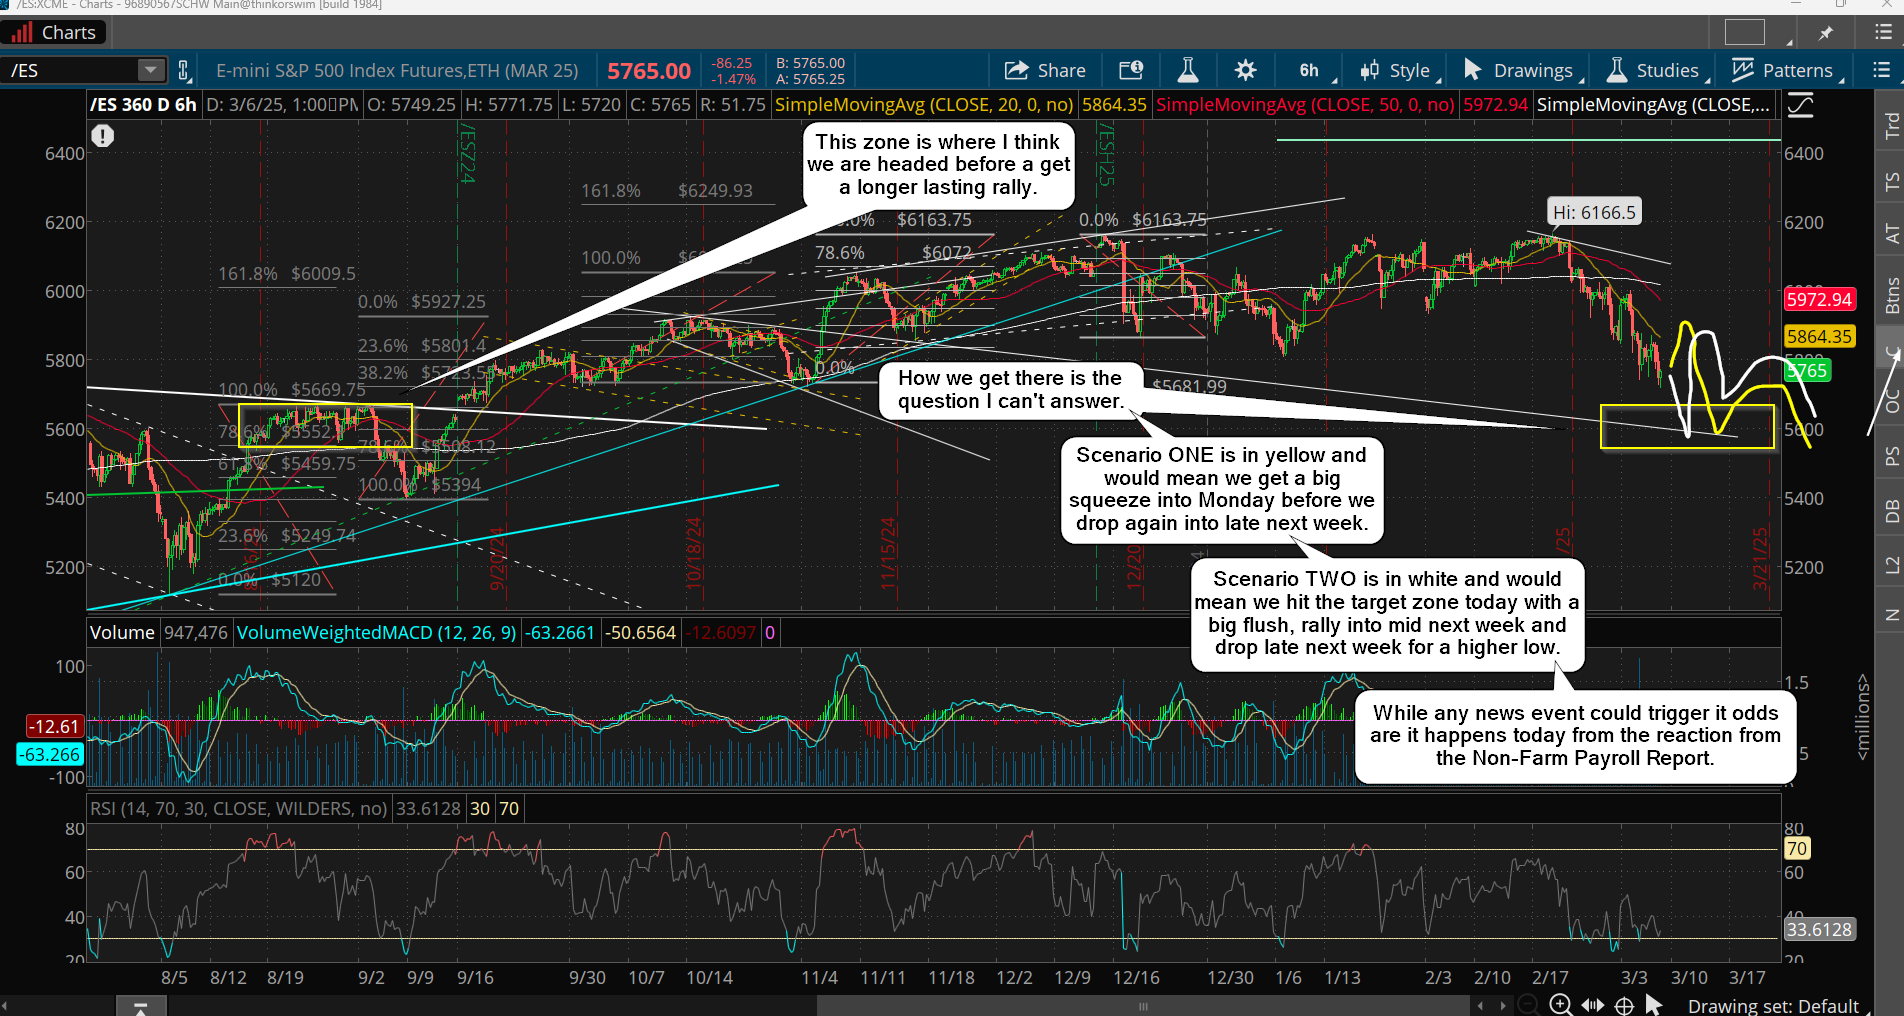
"ONE is that we rip hard after the NFP Report at 8:30 am and open in the cash market with a big gap up. The top will be into Monday. Then we drop hard all week to bottom next Friday with 5500 possible. TWO is that we gap down hard (after the NFP Report) and hit the 5500's by midday or so tomorrow. Then we rip hard for many days afterwards (more then 2, but I don't know how long) with no bulls left and a ton of trapped bears. One of these paths is what I see."

I do not know which one will play out but if it's number ONE the rally will be short lived. Basically a squeeze into Monday and then we rollover again to hit the low-mid 5500's by the end of next week. Now if it's number TWO then I'd have to think the low is in for awhile, meaning any move back down next week should make a higher low.

In this case we'd see the low-mid 5500's today and a huge intraday reversal back up to close green. If we see this happen everyone will be massively bearish and will short every move up. While there will still be more pullbacks they should not take out the low from a flush of that amount today. Which one will it be? We'll know after the 8:30 am Non-Farm Payroll Report as that's where the reaction will determine the direction.

Have a blessed day.

ES Morning Update March 6th 2025

0

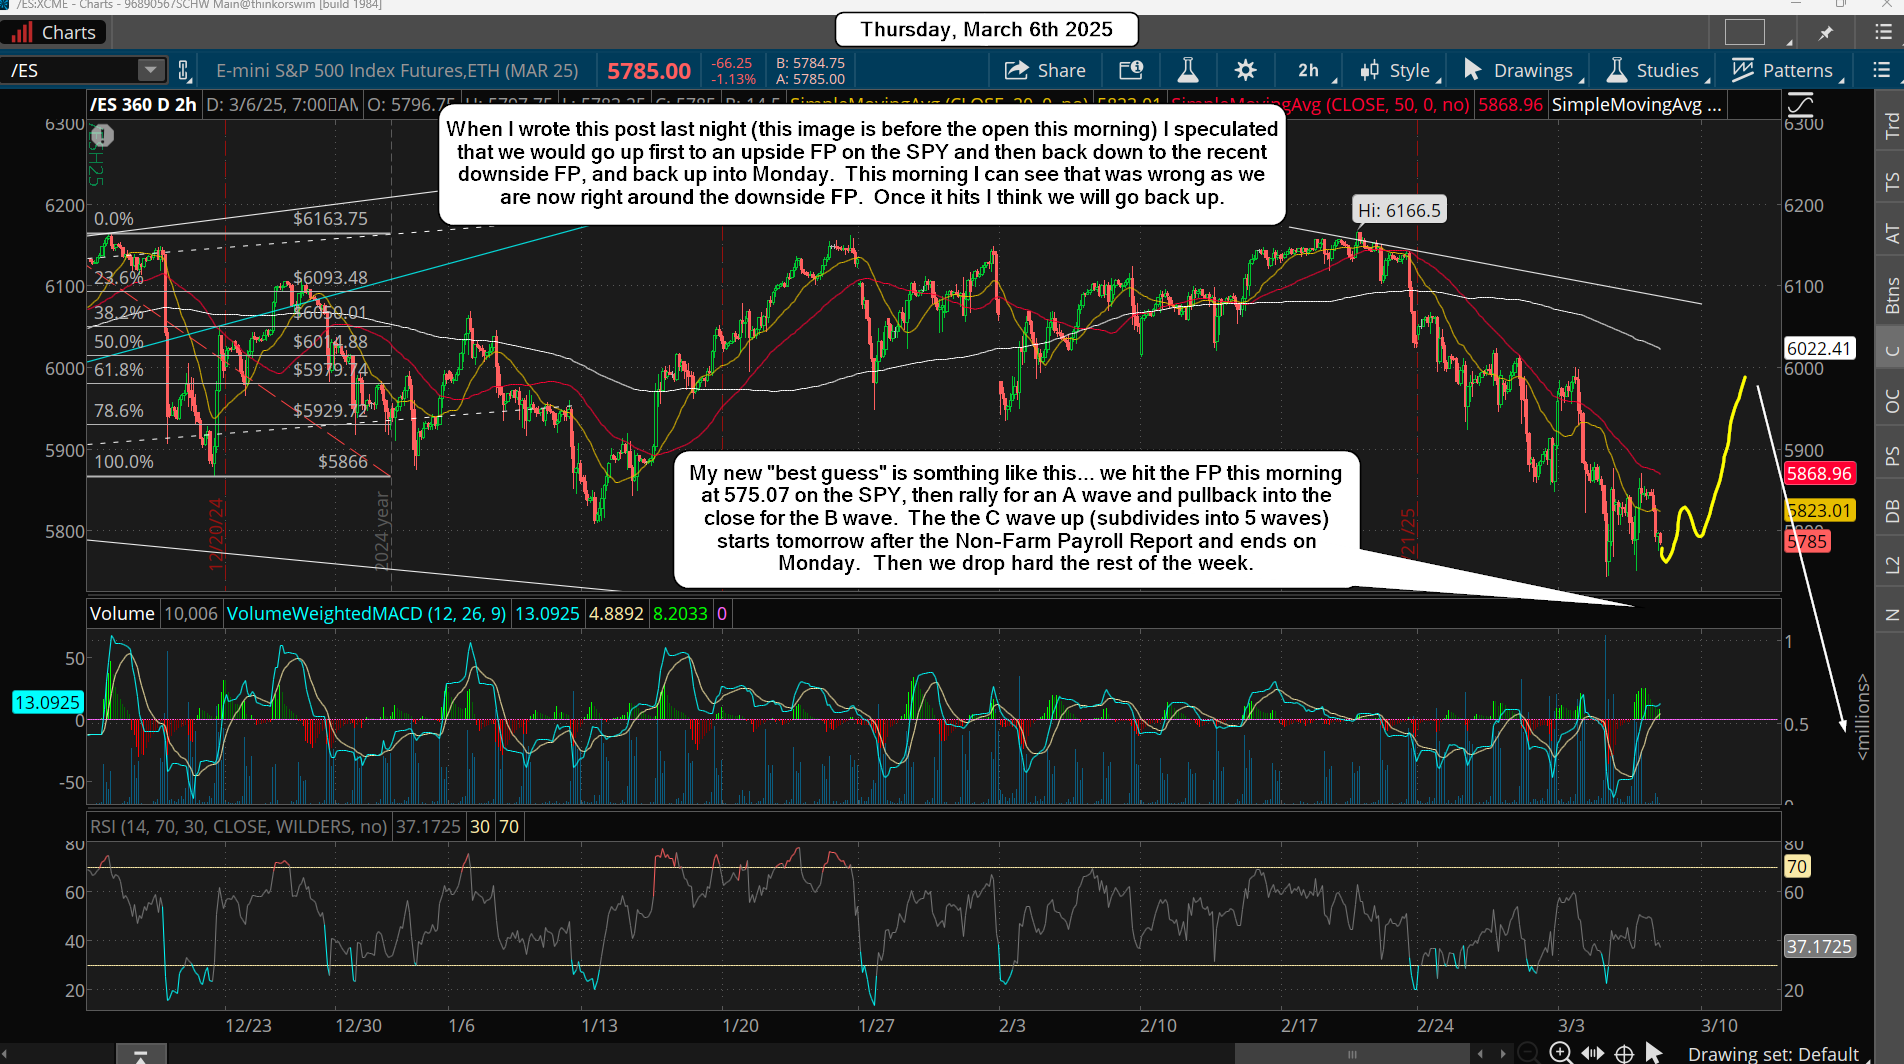
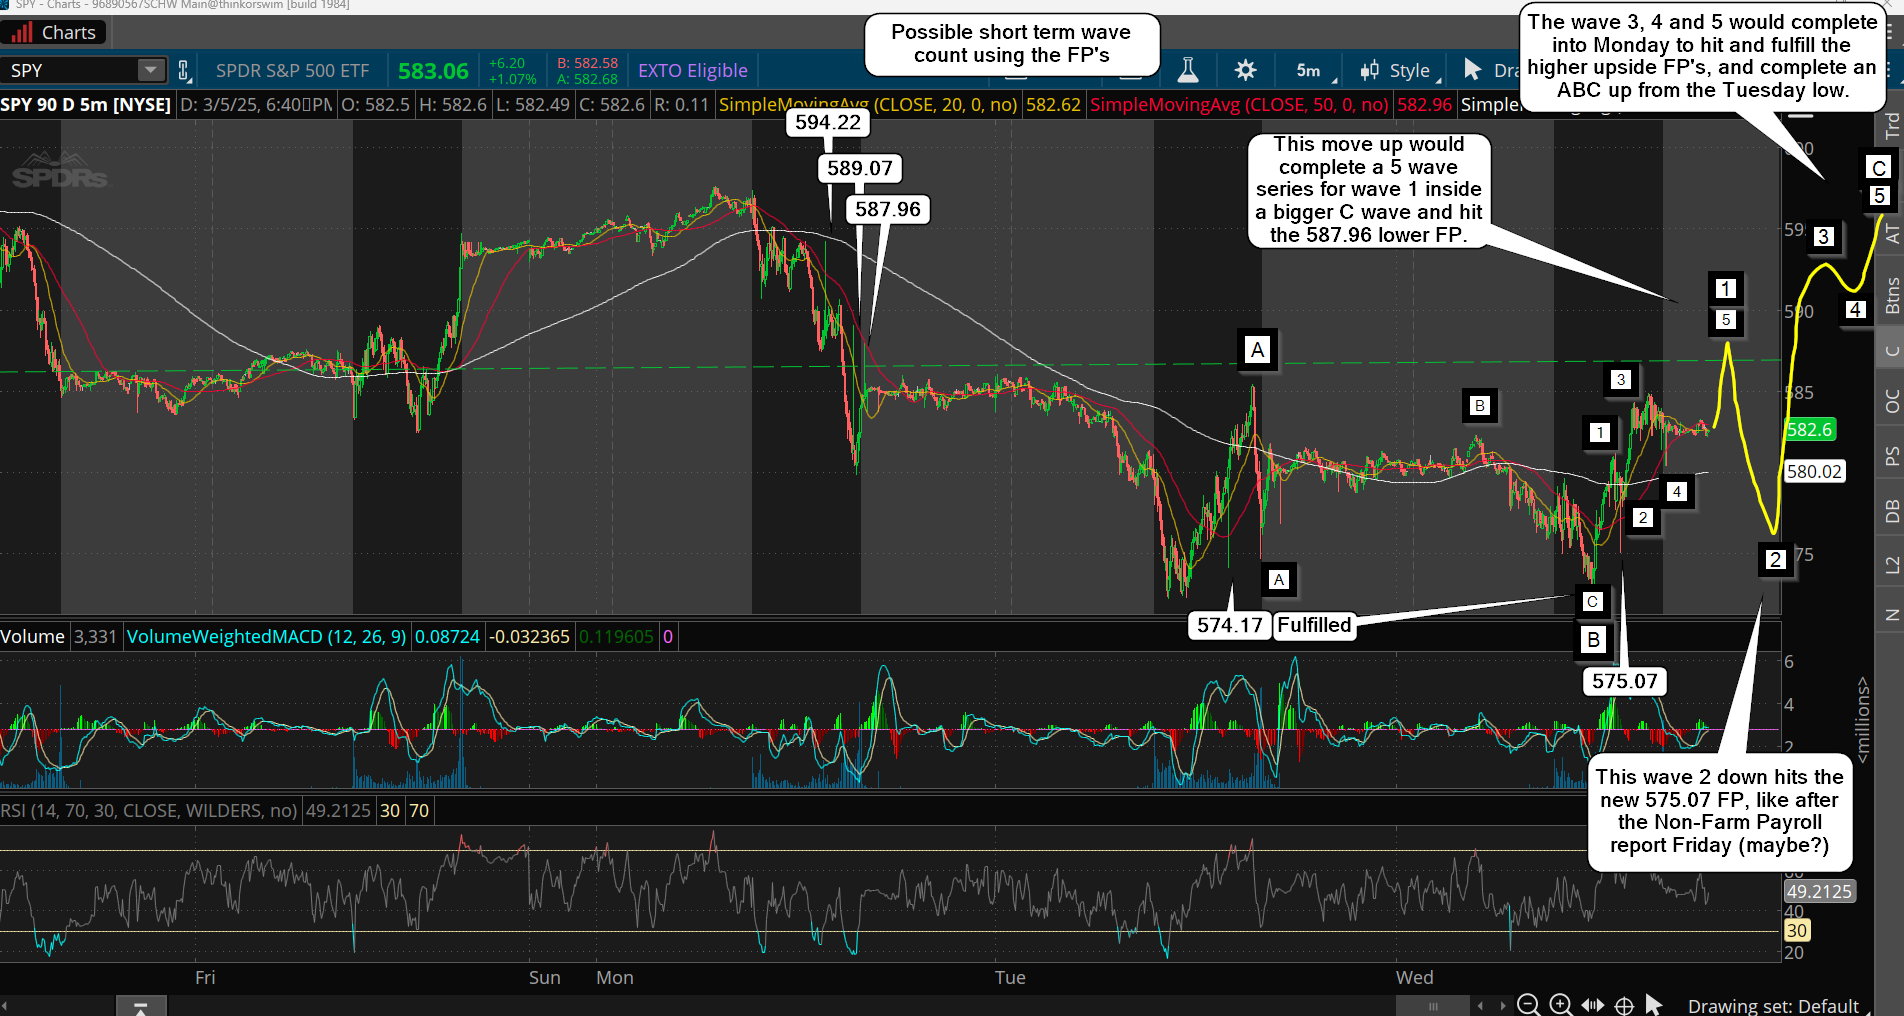
Down early in the day and rally into late in the day repeated again yesterday as the market carves our a short term bottom before another move down. There was another FP on the SPY of 575.07 around 1:26 pm EST yesterday, which leads me to think we are in for some wild swings in both directions before we drop hard again. As I posted yesterday about the various upside FP's on the SPY I think we will see them hit and the downside one too. I just don't know the order at which this happens?

My best guess is that we go up to the 587.96 or 589.07 FP first (like today maybe?) and then down to the new 575.07 FP (Friday after Non-Farm Payroll?), followed by one last rally up into Monday to hit the highest FP at 594.22 on the SPY. That's a bunch of wild swings but keep in mind that the market loves to trick and trap both sides before another large trend move, which should be down hard into the end of next week.

I'm not interested in going against the trend, which is down right now of course. I'm more interested in shorting the rips to the FP's as I think we will see the 5500-5600 level hit on the next big drop. So, if we rally up today to at least the 587.96 FP I think it's a short to the 575.07 new FP, and from there we could (should) see another move up (how high I don't know?) which might go up to one of the higher FP's into Monday?

Hard too know for sure on that one, but if that happens it's another chance to short in my humble opinion. It's not easy when the market is in one of these modes but the next drop, which should start next week, is going to wipe out a ton of bulls.

Have a blessed day.

ES Morning Update March 5th 2025

3

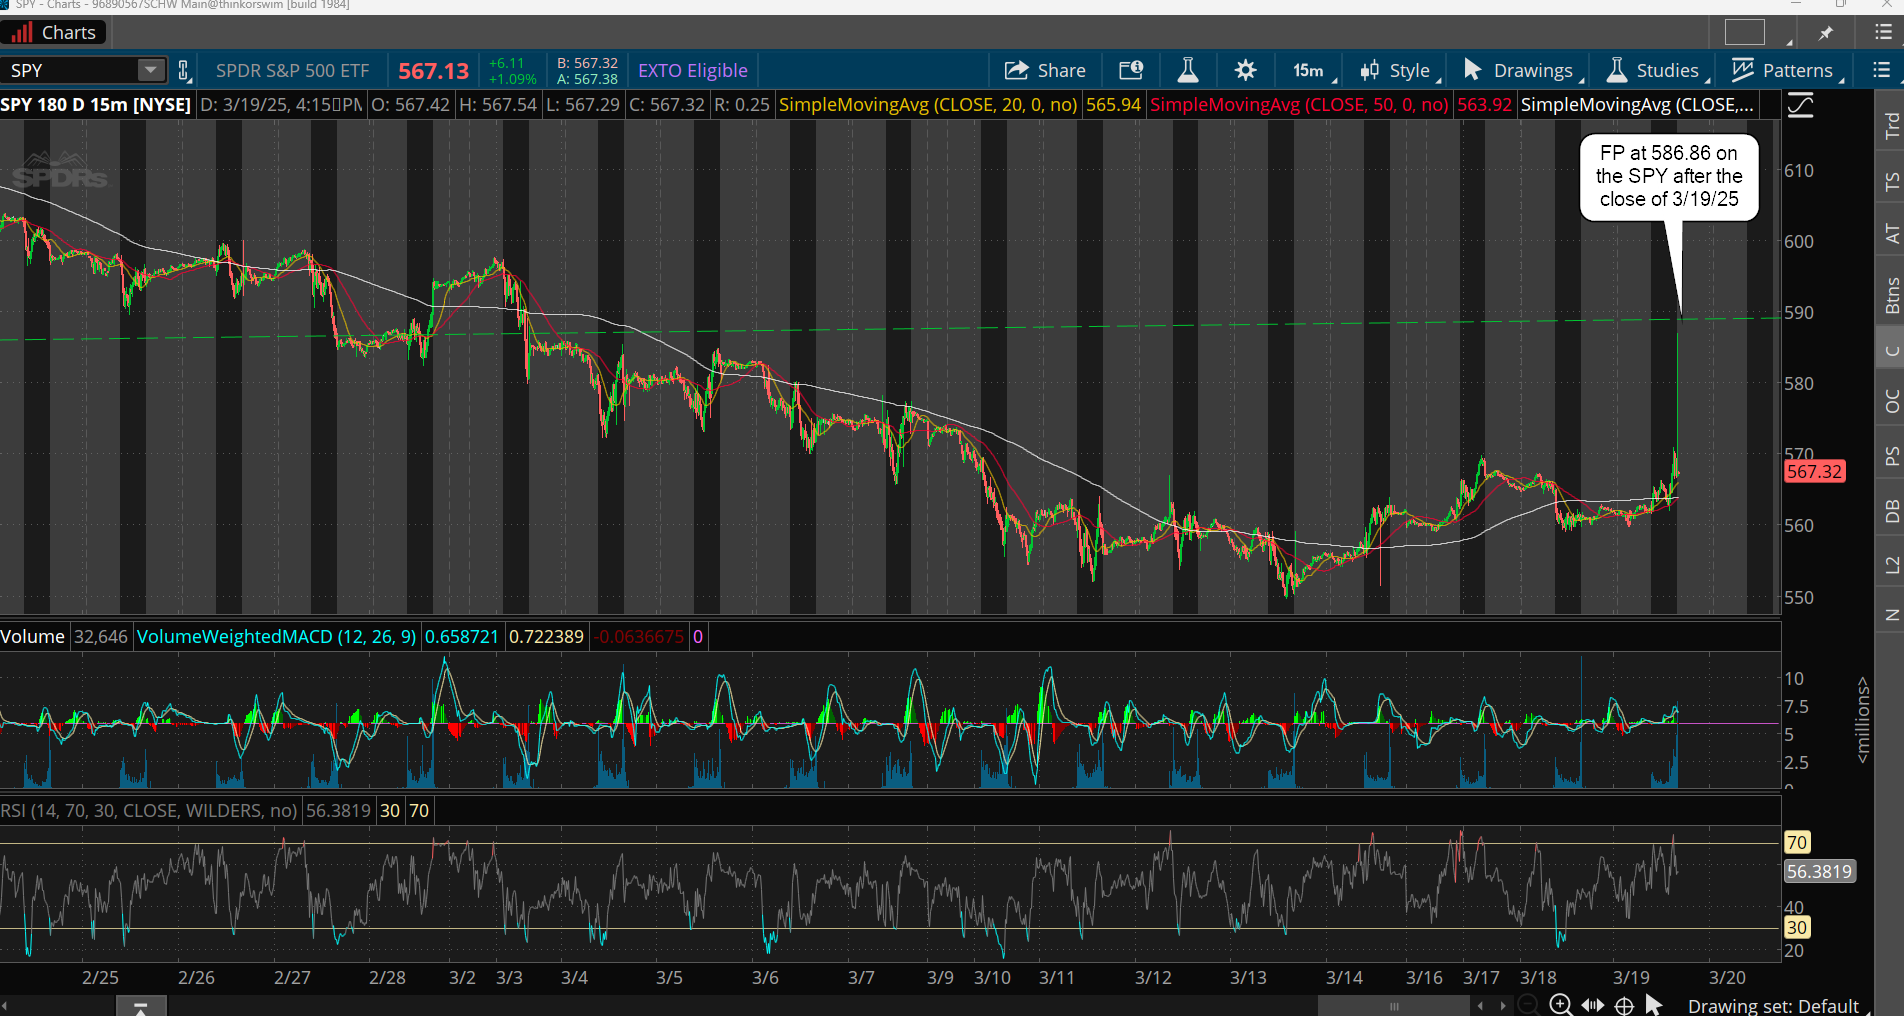
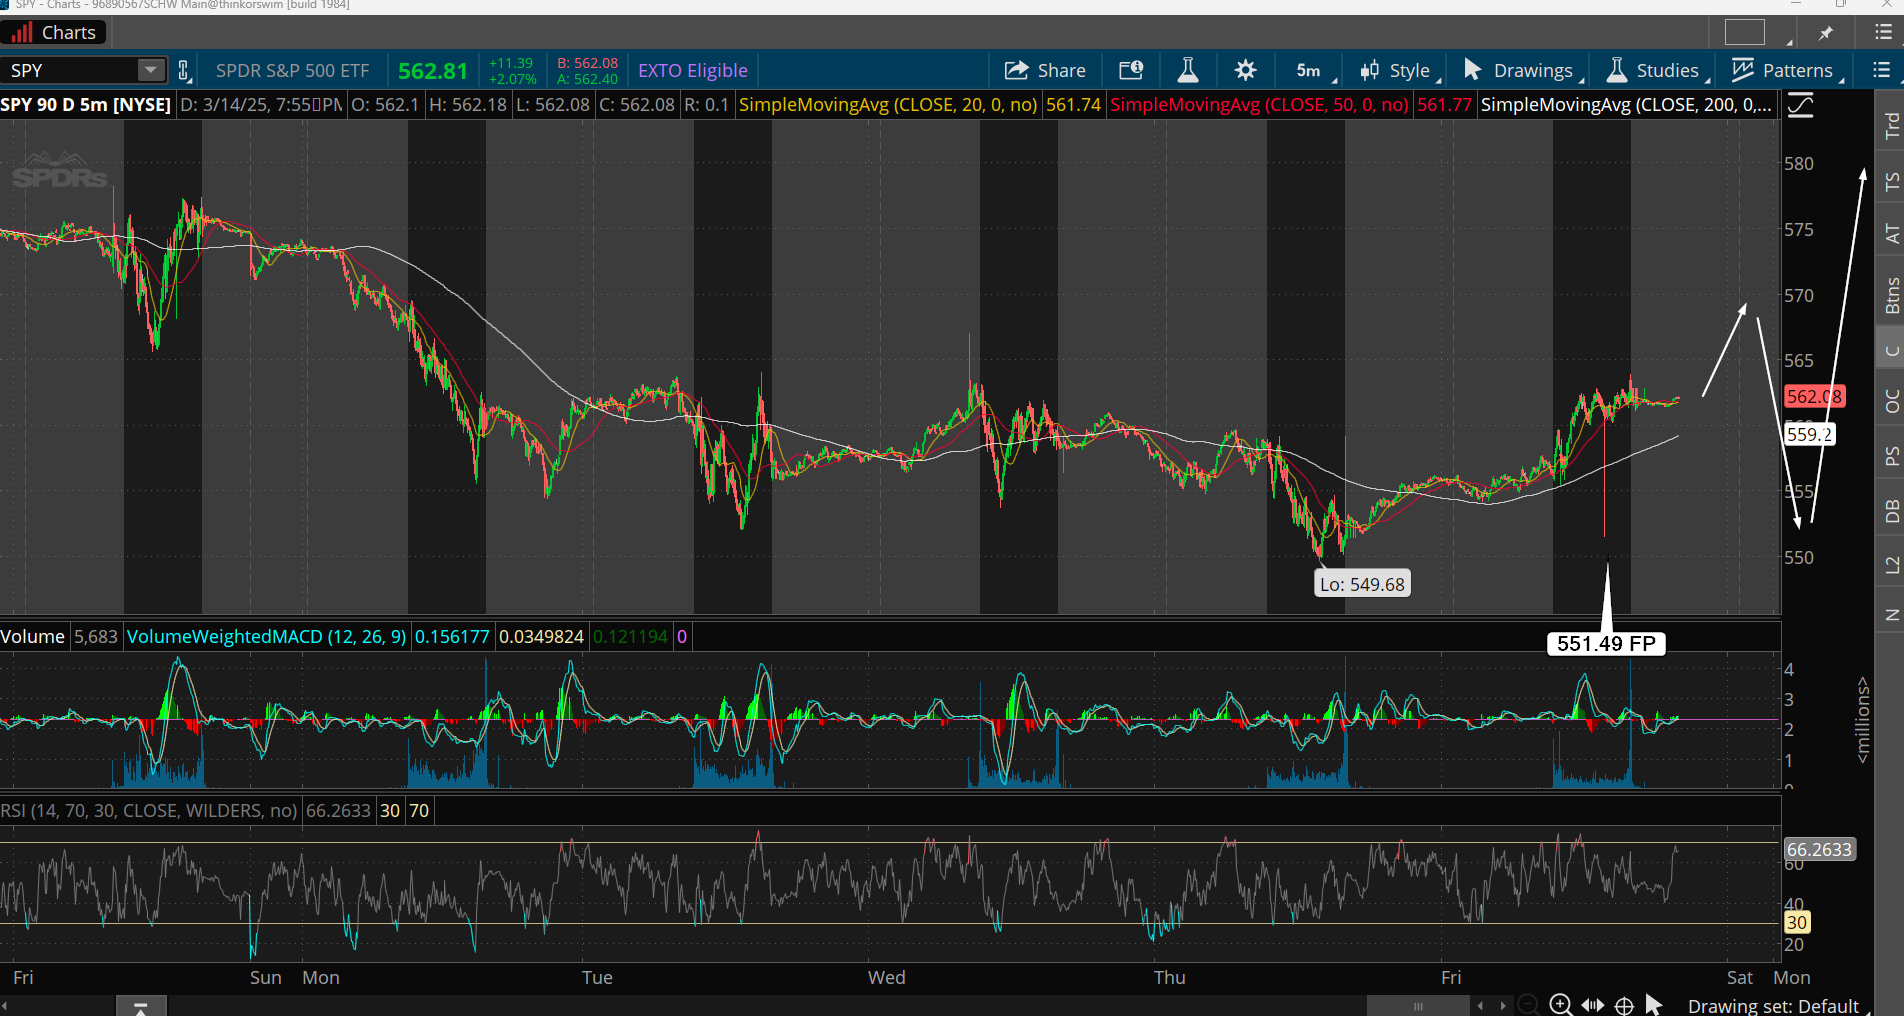
Another big flush yesterday, which got really close to hitting the 200 day SMA, and we bounced hard until 3:30 pm EST before another dump, but it was for a higher low. Ironically there was a FP on the SPY put out right before 2pm that pointed to that pullback low. So the market is telling everyone where the targets are at, but not the timing. Here's a chart of the SPY with the fake prints on it...

You can see the many FP's on the prior day as well, which I think will be targets for the rally today and/or tomorrow. I think we will see 589.07 today, then pullback some and then go for the 594.22 FP after that, which will probably be on Thursday. That should do it for the rally and Friday we should start down again. Target would be a retest of the low from yesterday but I don't see it hitting as fast as that move did.

Most likely it will have some up's and down's in it and the likely bottom will be mid next week. We have the CPI on Wednesday, so that could be it, or the government shutdown date on Friday? One or the other should put in the low and from the looks of the daily chart I don't expect to see it go much lower, which is why I lean toward a double bottom. The RSI is getting down there where we should get a nice multi-day rally, instead of just 1-2 day squeezes. We'll cross that road when we get there but I don't see a crash.

Have a blessed day.

ES Morning Update March 4th 2025

0

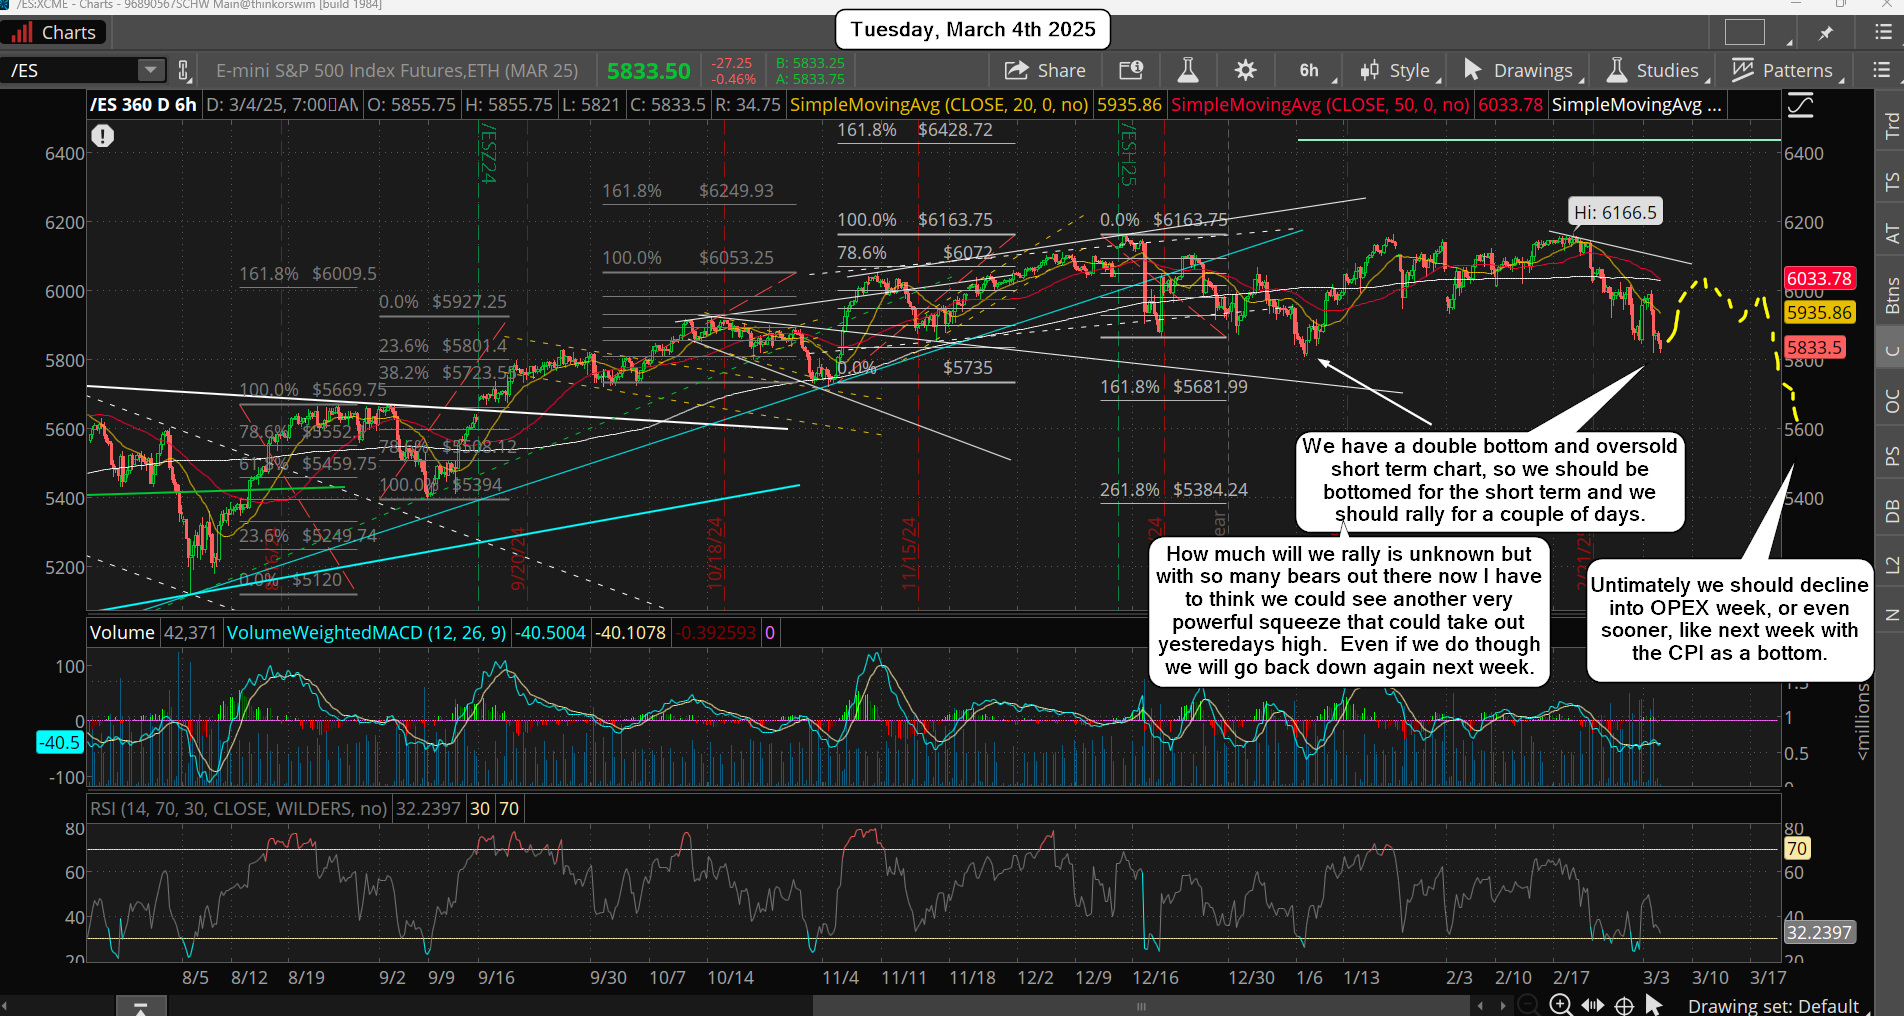
WOW! I wasn't expecting that drop yesterday as I thought we bottomed a day early on Friday and that this March 3rd expected low was hit early, but some how they flushed it hard yesterday and put in a new low. To me, this extends the rally until This Wednesday where we could make a lower high then yesterday or a higher high, like to my 6040-6060 zone on the ES.

I'm not sure what's going to happen here but the market nailed the lower low on March 3rd and should be in a rally mode for a couple of days before rolling over again. Since that lower low took out the bulls that were long from Fridays low there should only be bears left and they should take shorts on every move up today.

So, "if" we retrace most of the drop from yesterday, and fail to put in a higher high, I tend to think that Wednesday we'll see a move up above Mondays high to hit the stops on the bears this time. That would setup a nasty drop the rest of the week... if this happens? I'm really tore here as the market tricked me with that drop, but maybe it's my own fault as I said for a week or more that the expected low as on the turn date of March 3rd, so I have to assume that we will rally up to take out the stops on the bears before we drop again, and that means we should top on Wednesday.

The drop reminds me of the 5/20/2022 drop, which was followed by a rally that took out the prior highs of 5/17/2022 and then a nasty drop followed in the next two weeks. This would be the drop into OPEX and/or the FOMC meeting 3/19/25, and/or the CPI on March 12th, so that's the window I think for the low.

And that low should take out the 200 day SMA, but for this to play out I do think we need to make another higher high then the high yesterday so that those bears miss the drop. This means we need to squeeze hard today and tomorrow and if we run those stops on the bears the market will be free to start down again into the next two weeks.

Have a blessed day.

ES Morning Update March 3rd 2025

0

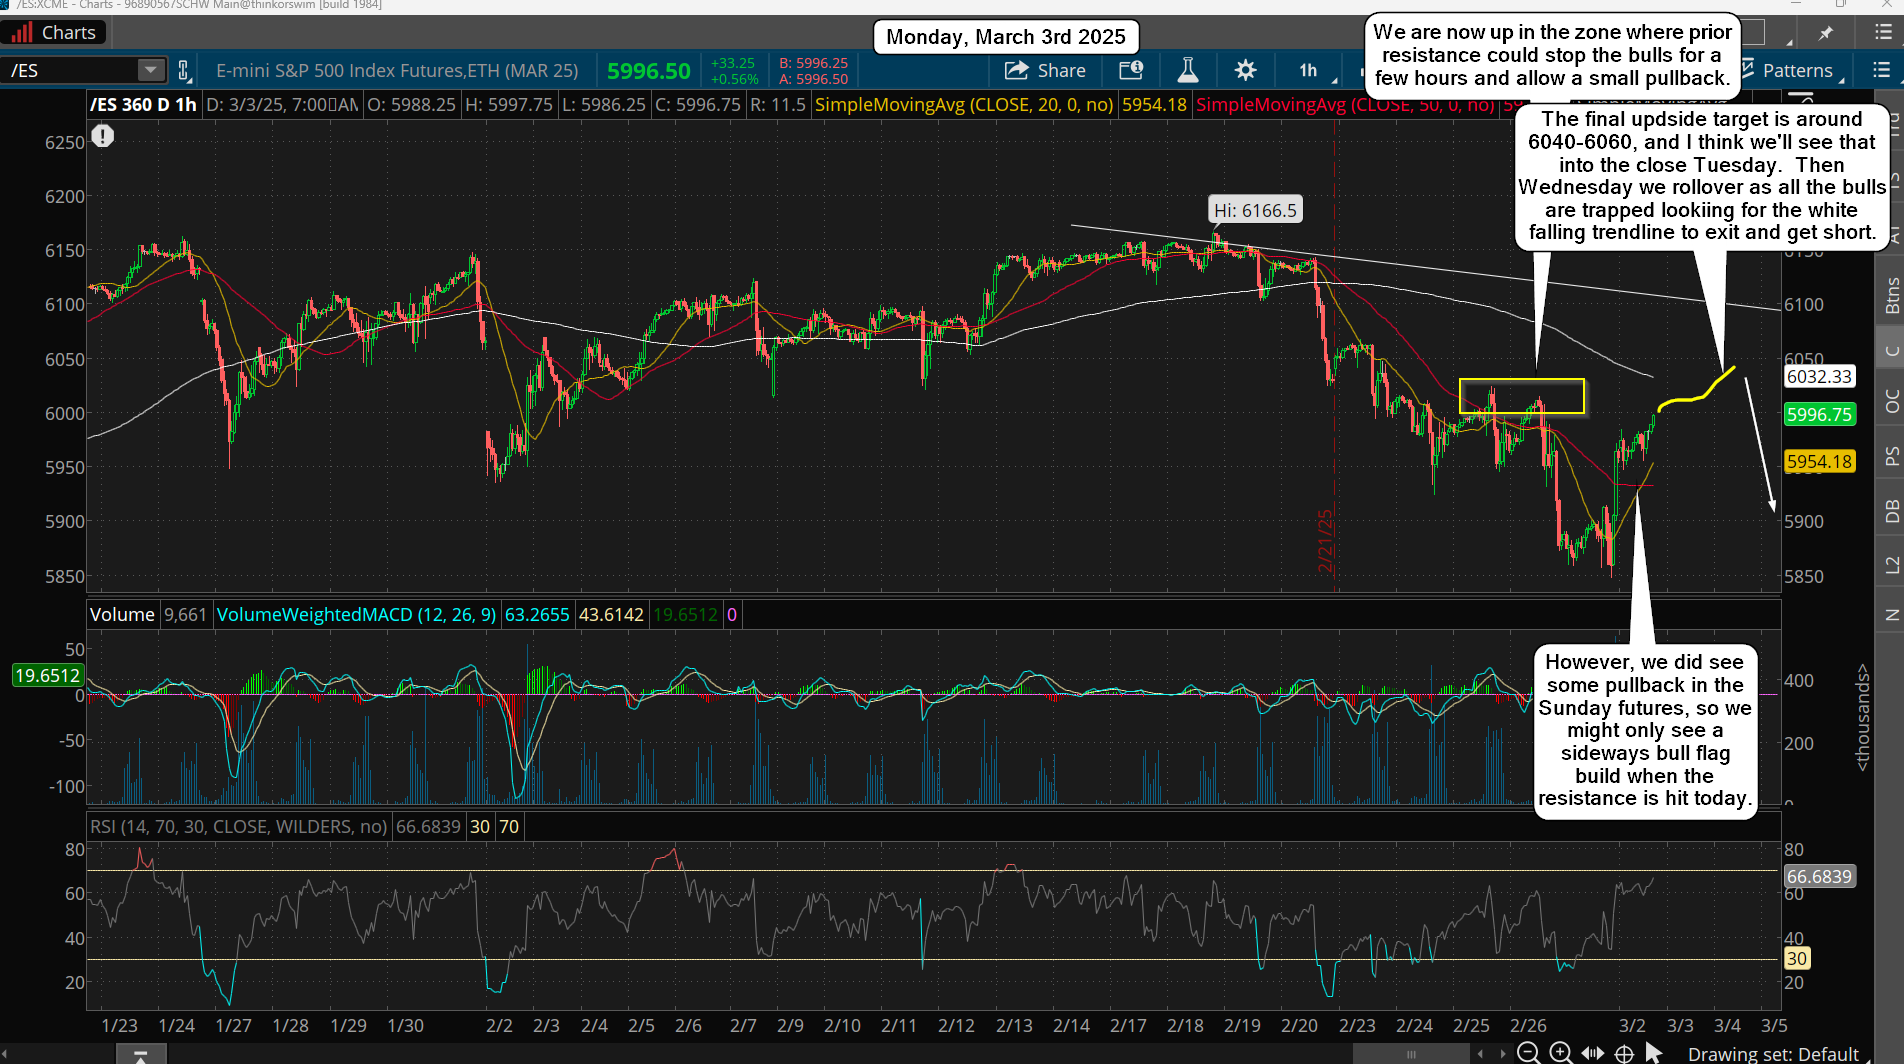
Very tricky day on Friday but we did put in a lower low into my expected zone and finally ripped to the upside in the last half hour of the day. I was beginning to think we wouldn't see it and that it would happen on Monday, but now that it's broken out I do think we have seen a temporary bottom and that we are headed up into Tuesday or Wednesday before we rollover again.

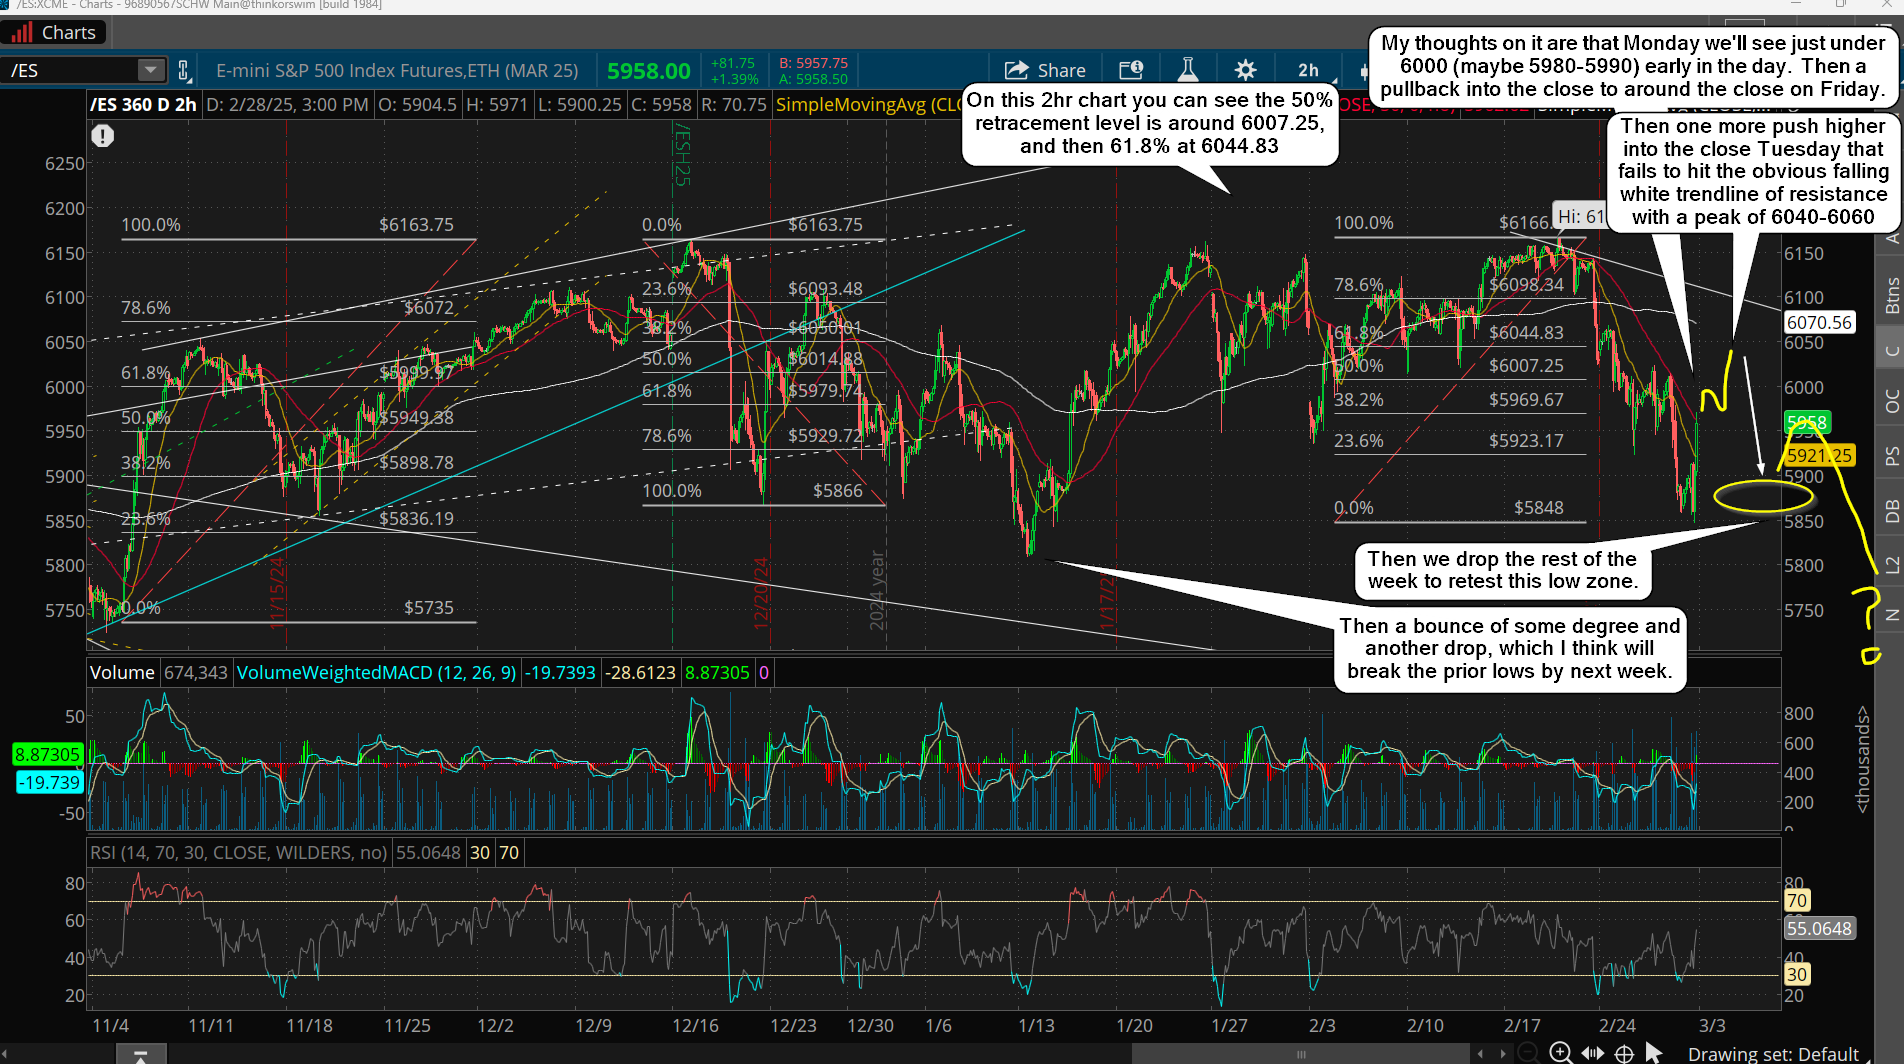
Short term I think we rally up to 6000-6020 before we top out on this first move up, which is likely an A wave of a larger B wave up. If it happens today then I'd look for a pullback of some degree later today or on Tuesday morning, and a final move into the close tomorrow or early Wednesday for the C wave to complete the larger B wave, which could reach 6090-6110 on the ES, but that's really stretching it.

It might not make it that high though as I think everyone will be looking for it and we all know that if everyone is thinking the same thing it's not going to happen. The 50% retrace level is at 6007.25 on the ES and 6044.83 is the 61.8% level.

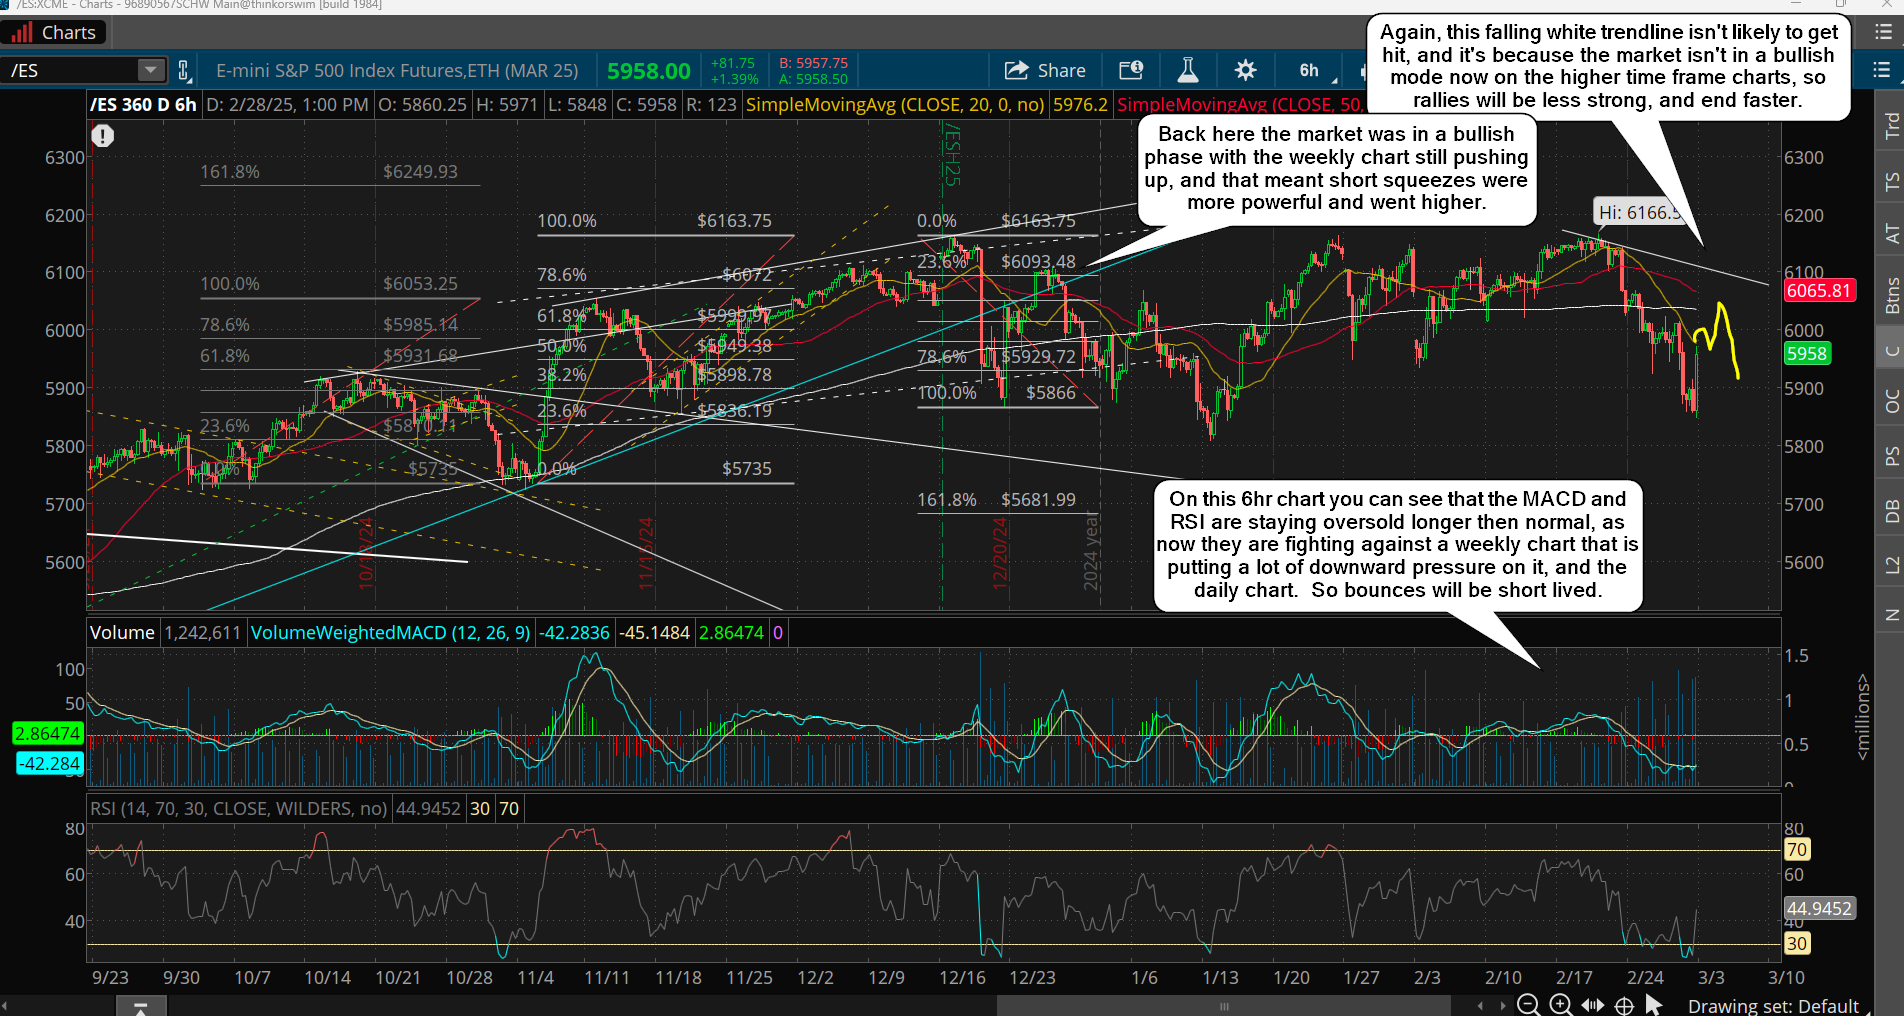
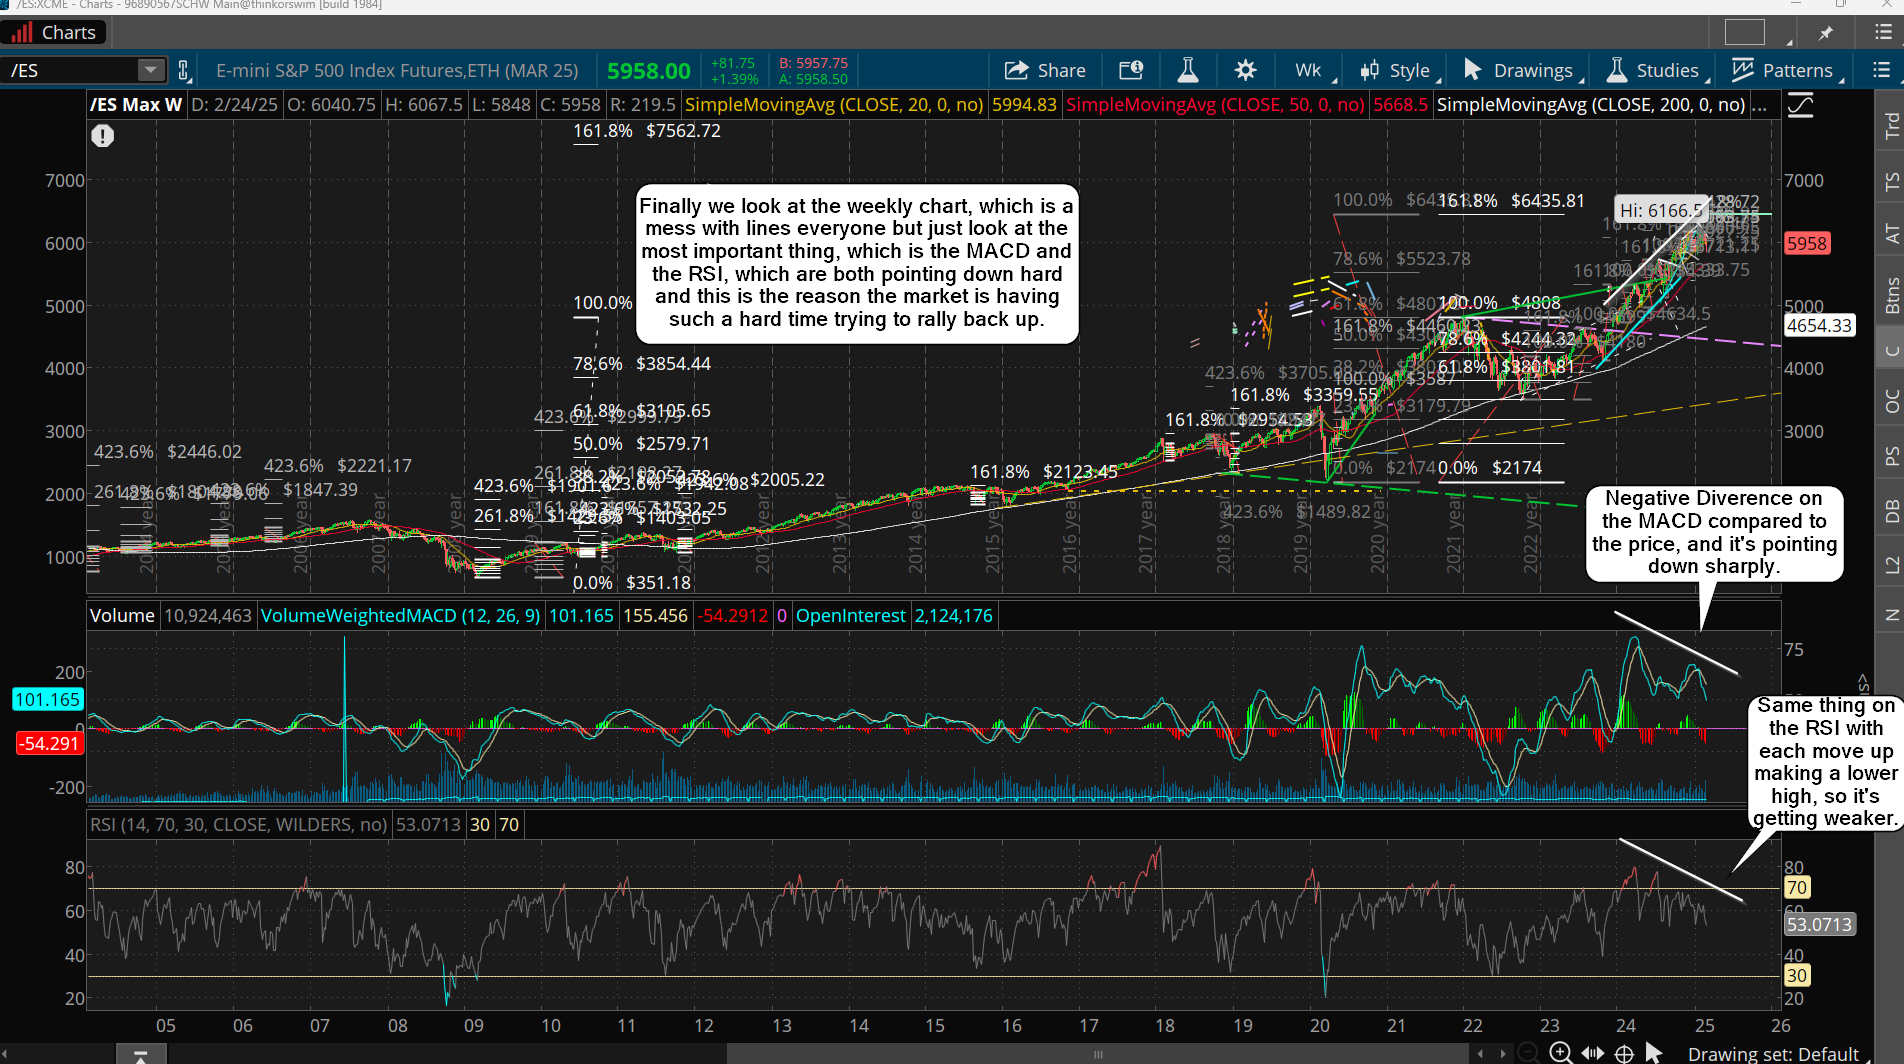
This month of March is going to be a very bearish month and the weekly chart is pointing down hard, so I think the bulls aren't going to get the move they want so they can short from the perfect spot. Most likely this will be over with by Tuesday, and that's especially likely if we hit the 50% level today and pullback into the close by some amount, as it's sets up Tuesday for the move up to the 61.8% level where the bulls will be licking their chops looking for the falling white trendline around 6100 to exit and short it. Plus, the bears will want that level too, but it's just too obvious I think.

It worked all of last year and into early this year as the bulls had the support of the weekly chart pushing up, so short squeezes retraced 78.2% commonly, but we are in a bearish month now and the weekly chart is NOT supporting any strong rallies, as it's very bearish looking to me. By stopping the rally this Tuesday, at just above the 2/26 high (6023) and the 2/27 high (6011), those bear stops will be taken out, but the 2/24 high (6067) won't be, and that's high enough to keep the bulls long looking for higher prices and bears will be afraid to short it.

It's the perfect setup for a top before the next move down happens with very few bears short and lots of bulls long. That zone of 6040-6060 on the ES is where I think this rally stops. I don't think we see it all today but by the close on Tuesday I think this rally is over with. I would love to see it reach the falling white trendline around 6100 but I just don't think they will give traders that good of a spot to short.

Time is everything and "time" will run out by Wednesday at the latest this week. The next move down should last into late March and will likely reach (probably take it out) the 200 day SMA (5753) on this next drop.

Have a blessed day.

ES Morning Update February 28th 2025

2

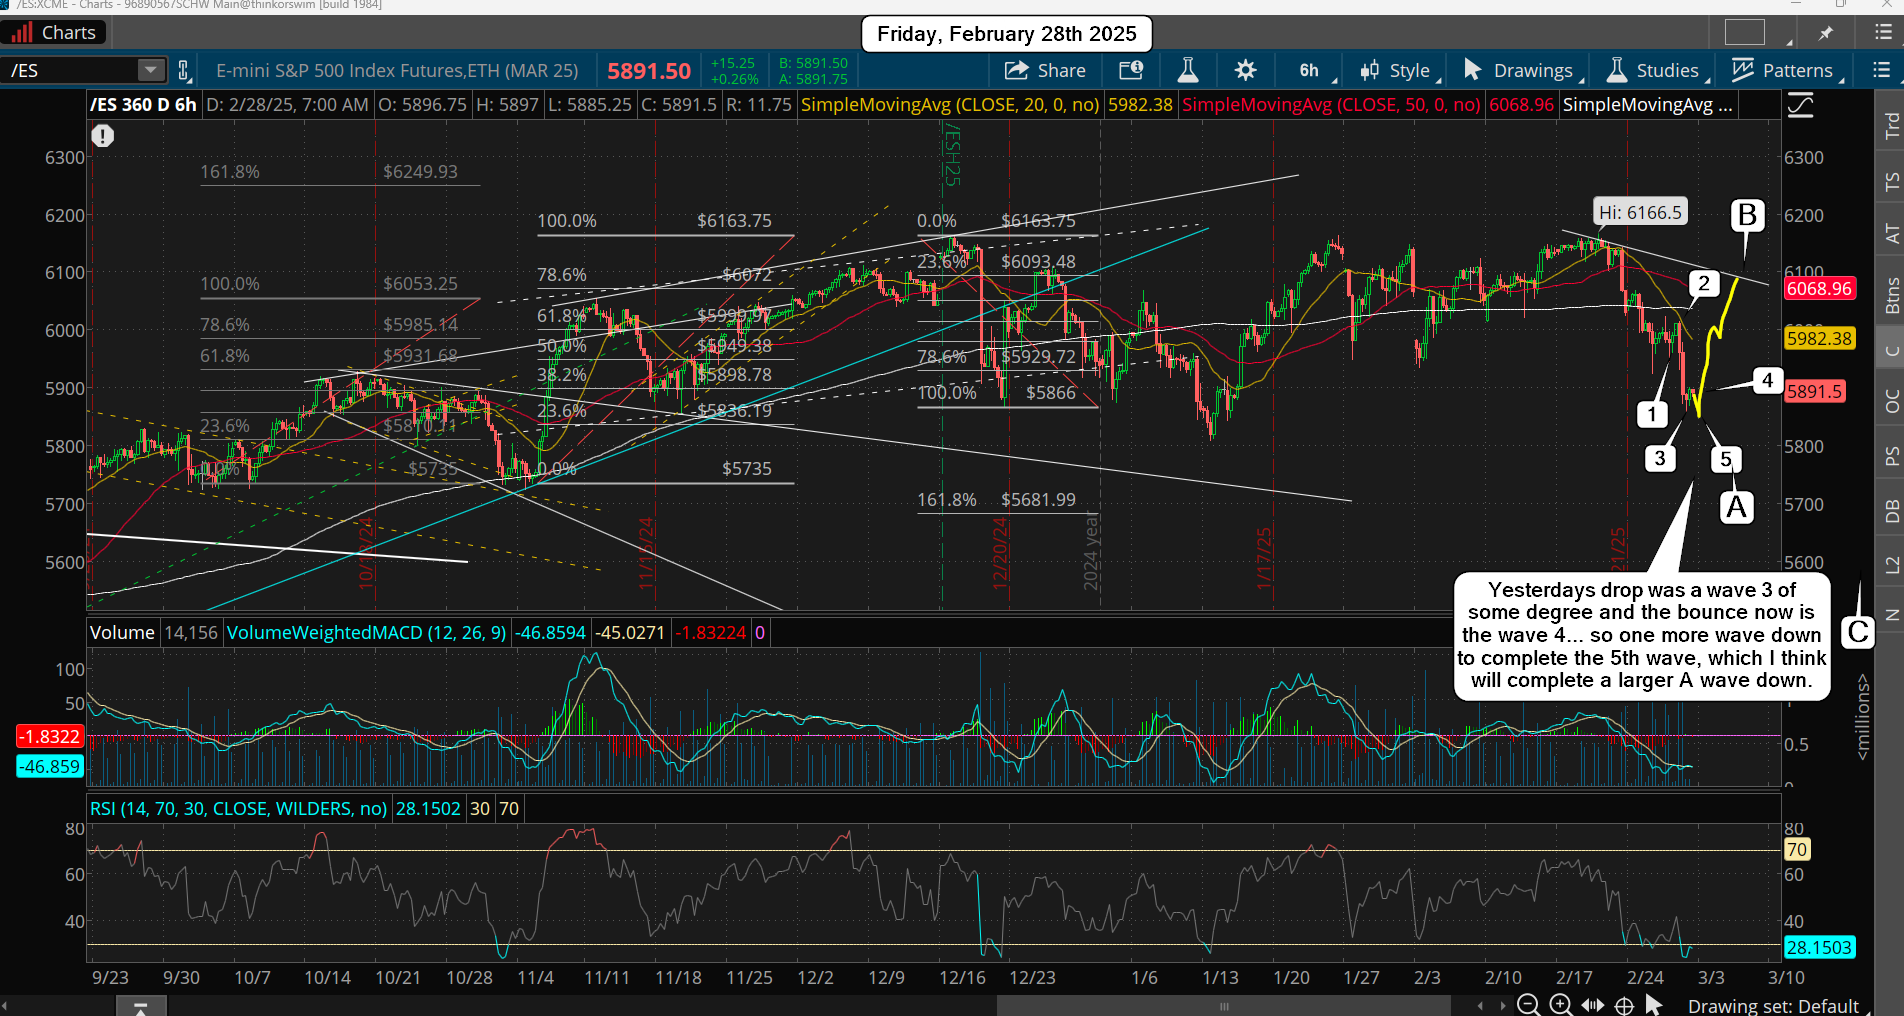
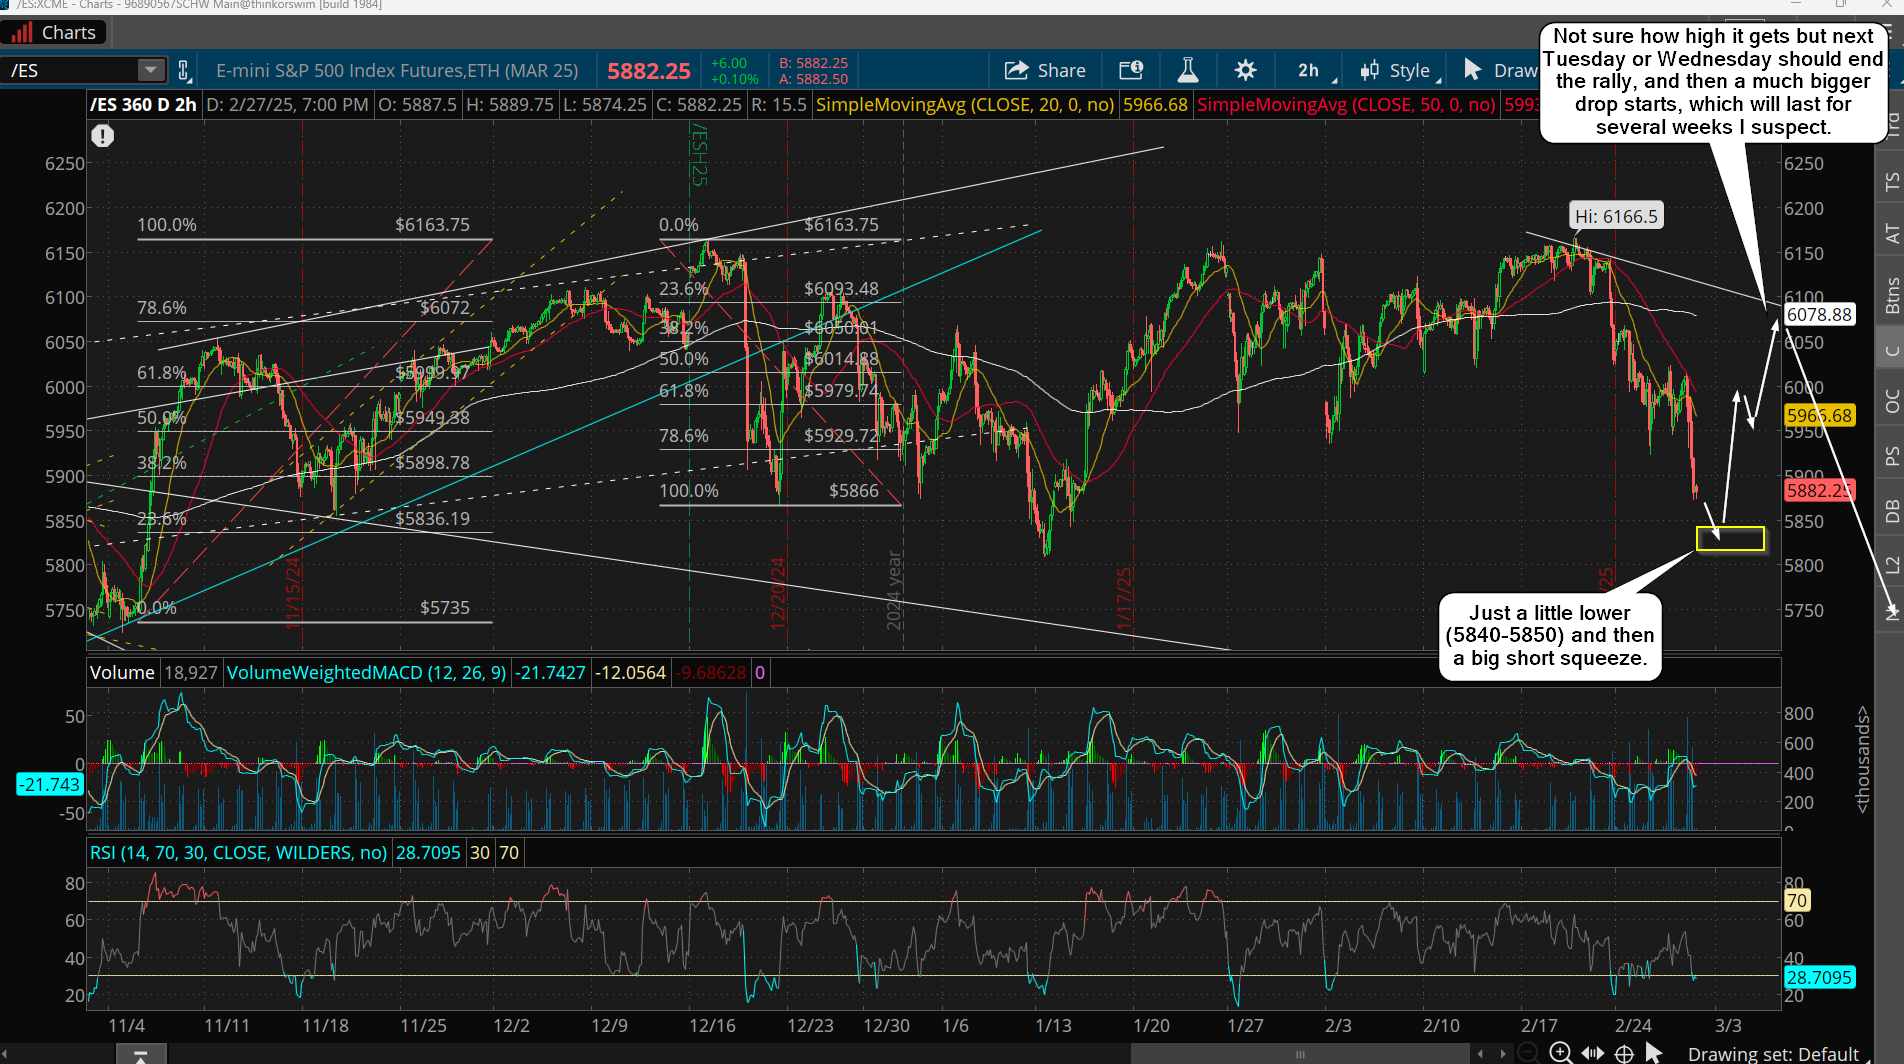
Ok, everything is looking good for a bottom this morning and then a powerful squeeze the rest of the day of 100-150 points. We are into the zone now but I think we could reach 5840-5850 on the ES, and that should be it. It's a rough zone and my plan will really be based on a gut feel, but pretty much shortly after the open we should see the bottom. Then we rally hard, which will likely top next Tuesday or Wednesday. How high will it go you ask? I think somewhere in the 6050-6080 zone is possible, but I'll really just be looking for exhaustion and "time" to play out.

Meaning Tuesday, maybe Wednesday should be all she wrote for the bulls and then we should rollover again for the next move down, and I think it will be the one that hits and pierces the 200 day SMA, but that's yet to be known at this point. Let's first see the bottom today play out and the squeeze into next week.

Have a great weekend.

ES Morning Update February 27th 2025

2

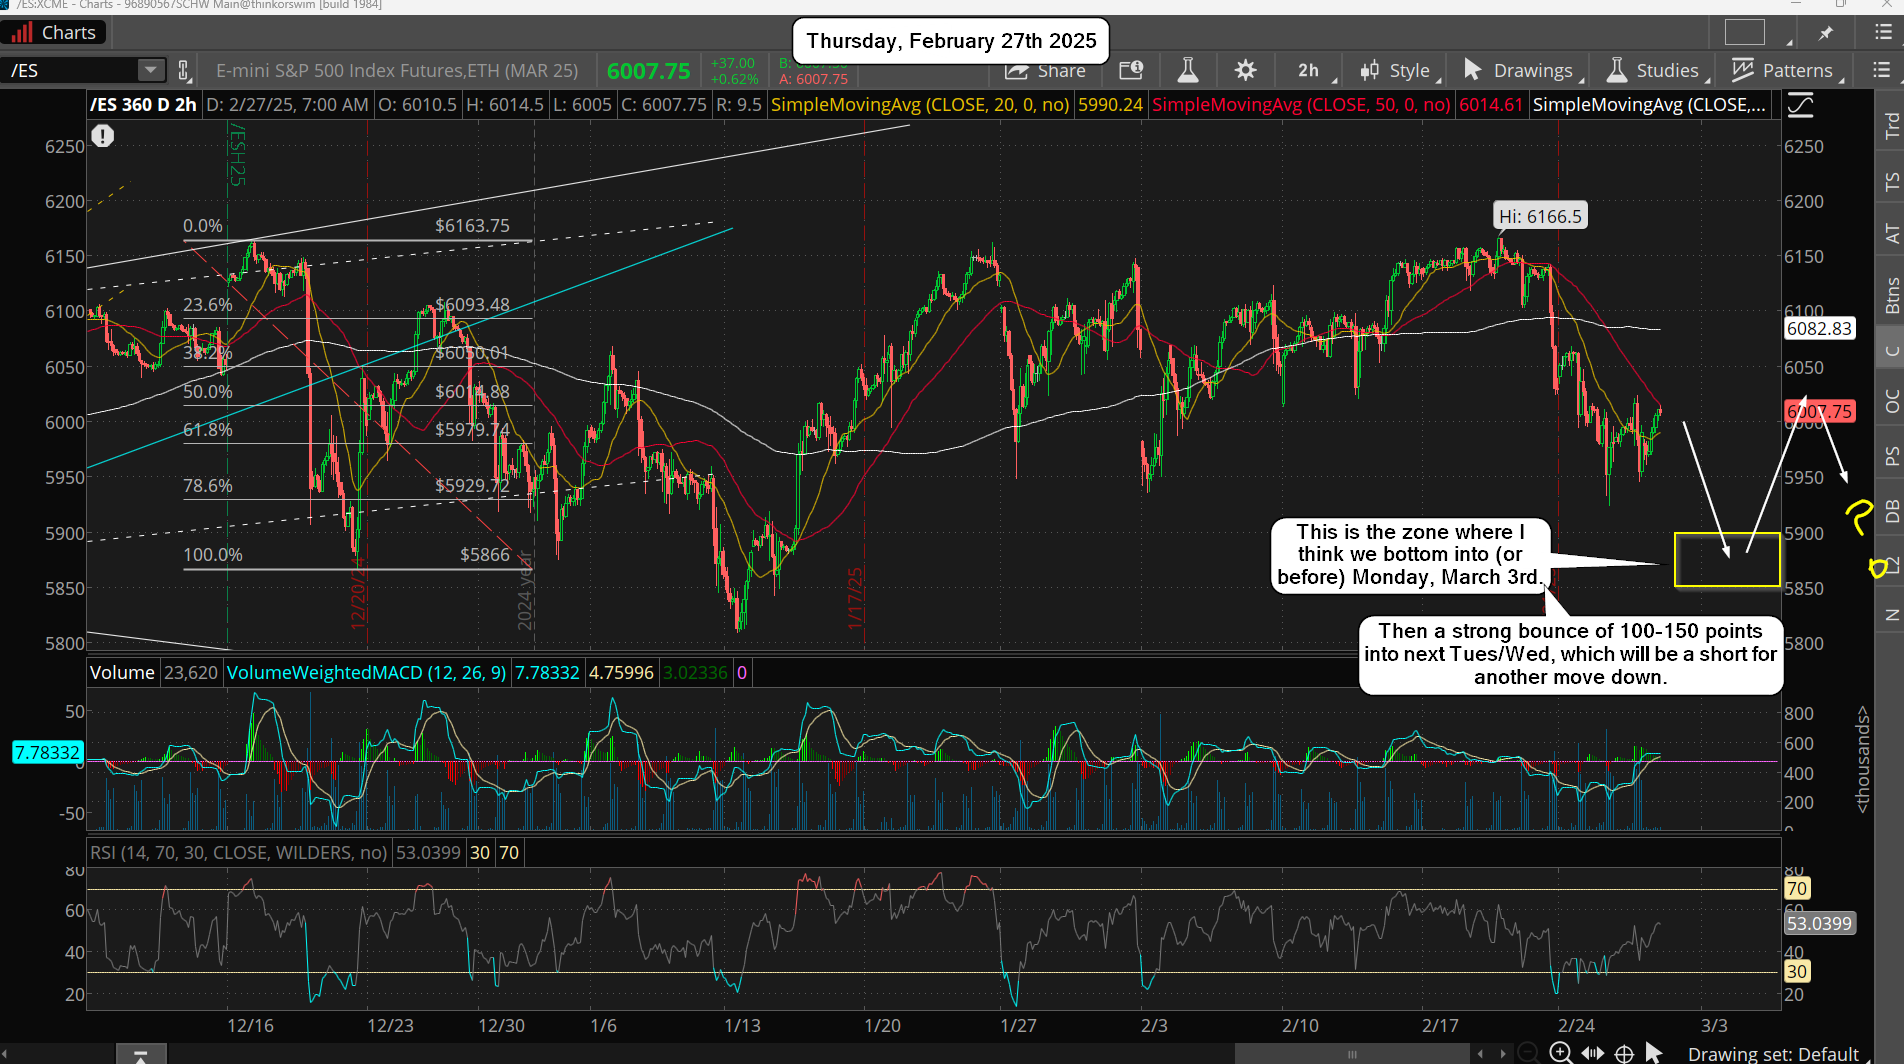
I'm still looking for one more lower low that takes out the 5924 low (ES) on Tuesday. I don't see it getting all the way down to the 1/13 low of 5810 as that's too obvious. I think somewhere between 5850-5875 will be enough to take out any longs from this Tuesday and lure in some bears.

Then I expect to see a face ripper rally of 100-150 points, which will likely be "about" a 38.2% retrace from the top down to the bottom that is made. The high yesterday was 6020, and that would be a magnet target for the rally into early next week. This assumes we get the low by this Friday, which I think is possible.

The expected low was for Monday, March 3rd, but if we reach it today or tomorrow I'll call that a successful hit as turn dates are always "windows" where it might happen a days or two early (or late). If we see the low hit today and the rally into tomorrow, where we reach that 6020 high by the close, I have to think we'll still get another pullback on Monday, but I don't think it will be any lower low but a higher low.

Basically, the move up to the 6020 zone would be an A wave and Monday would be a B wave, which might be half the move up? Hard to say for certain. But from there we could (should.. "if" this plays out?) see a C wave up into Tuesday or Wednesday for another hit of that 6020 zone, which I'd think will be taken out during that rally, but probably not by a lot. If we reach the 6060 zone it would be a wonderful short for another drop the rest of next week and into the following week. Now if we do not drop first (today or tomorrow) and rally up instead, then I'd expect to see the lower low move happen next Monday, which is the expected date anyway.

Have a blessed day.

ES Morning Update February 24th 2025

0

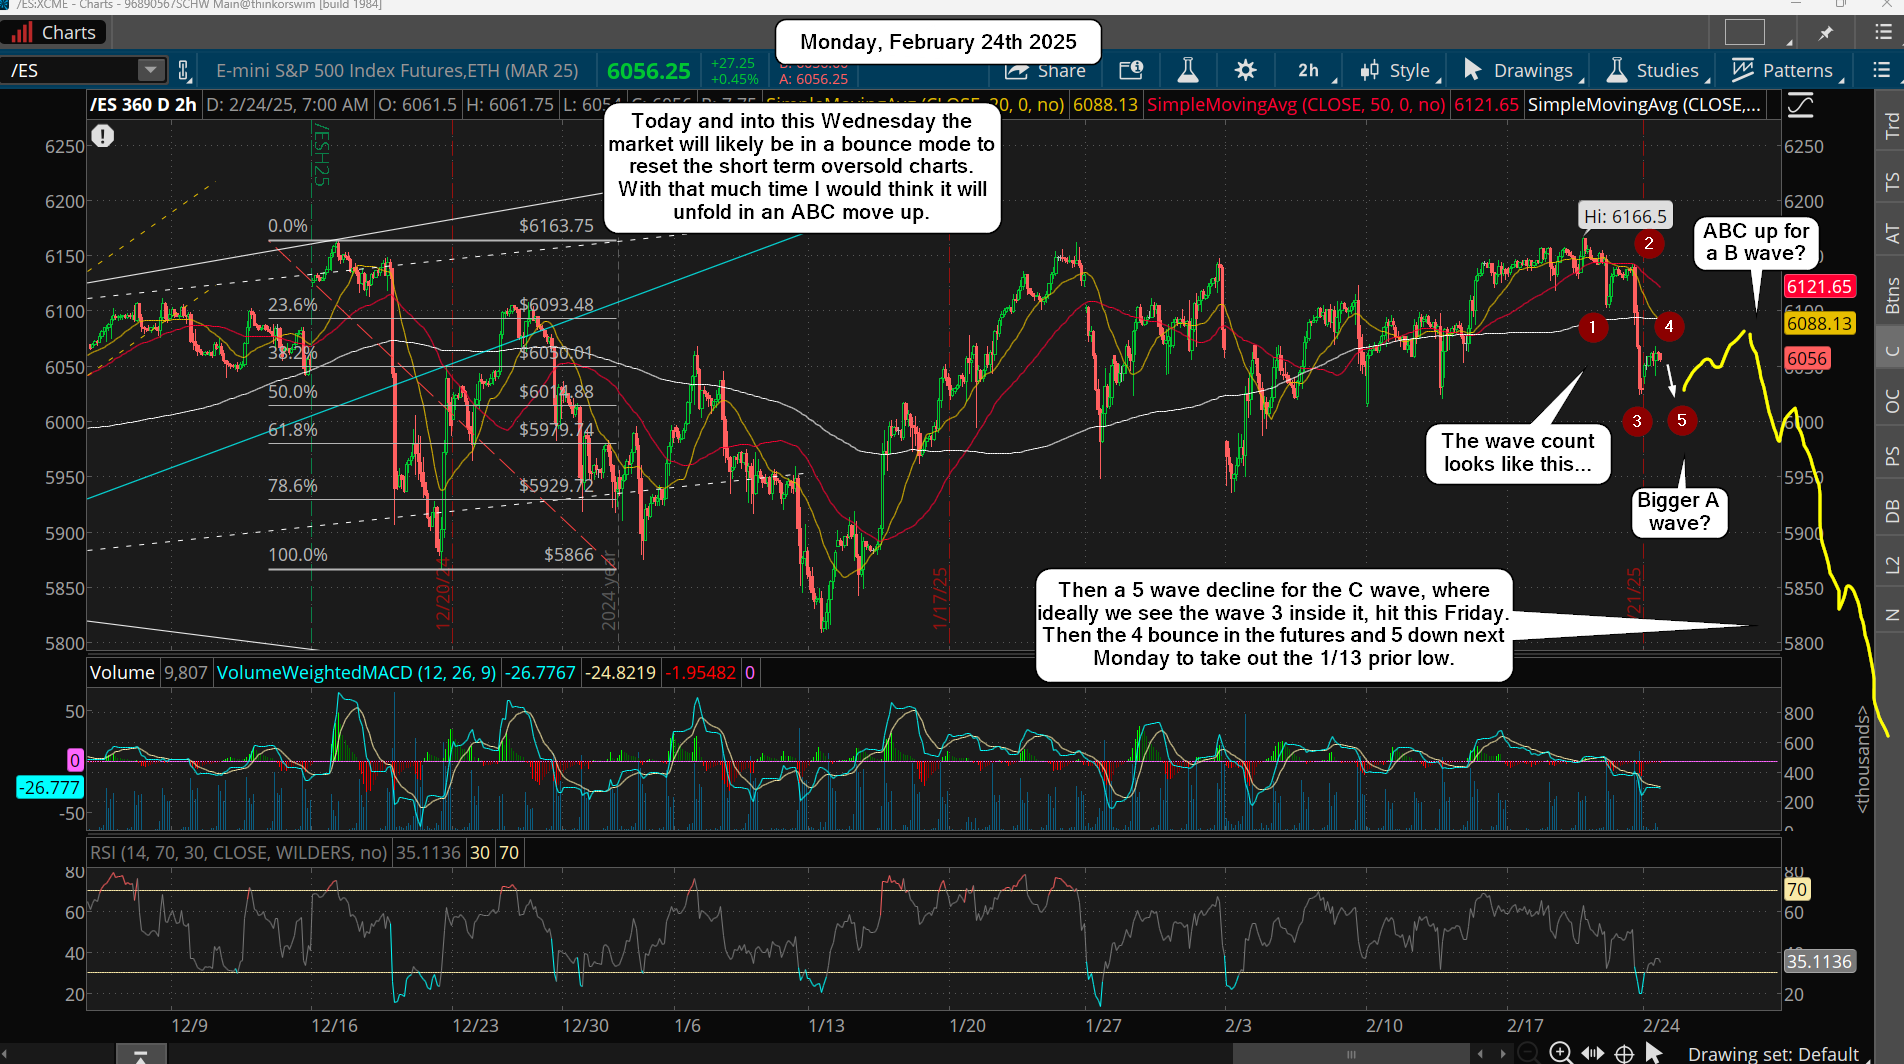
The market fell hard on Friday after topping on Wednesday with a tiny new high. I wanted a blow off but there must have been too many bulls long to make it happen? Nevertheless the turn date worked as the market topped and tanked. Support is a little lower around the 5970-5980 area on the ES, which might get hit today or tomorrow.

This Wednesday is another spot where we should see a high. I wouldn't really call it a turn date, but a bounce date would be more accurate I guess? The bottom dates are March 3rd, which should be the main "lowest low", but with another one on Friday March 7th or Monday March 10th it's possible that the later date makes a lower low.

Basically, the low on March 3rd should be followed by a 1=2 day bounce (maybe 100-200 points?) and then back down into the 7th/10th for either a higher low (a wave 2 pullback?) or a lower low (a wave 5 bottom?). From that low we should start a complex rally, but I don't expect to see some straight up, non-stop squeeze like in the past. Even if it turns out to be a wave 3 it will subdivide into 5 smaller waves and those waves will likely subdivide too. It should be a choppy mess for the next few months before we see all the various degrees of wave 1's up and wave 2's down finish, and setup a powerful, long lasting, multilayered wave 3 up. The big cycles say this will happen from a low in May and last into August where we finally see a huge blow off top. I posted on X the following..

https://x.com/reddragonleo/status/1892204496500965533

https://x.com/reddragonleo/status/1892558260890120377

It turned out that it went lower then I expected and dropped faster. The bounce into the 26th is still likely but I don't know how much? If everyone is still bullish and buying the drop the bounce might be weak, and that will keep the bulls trapped with no way to get out.

Plus it will keep bears from getting a good spot to go short at, and by the time we finally bottom next week they will have missed it all. While the fact remains that we saw a slightly higher high last Wednesday it was still likely a B wave with the A down happening from December to January. That means this current move down we are in is likely a C wave, and they don't usually bounce that much... which is why I lean toward a weak bounce into this Wednesday. Either way though more downside is likely.
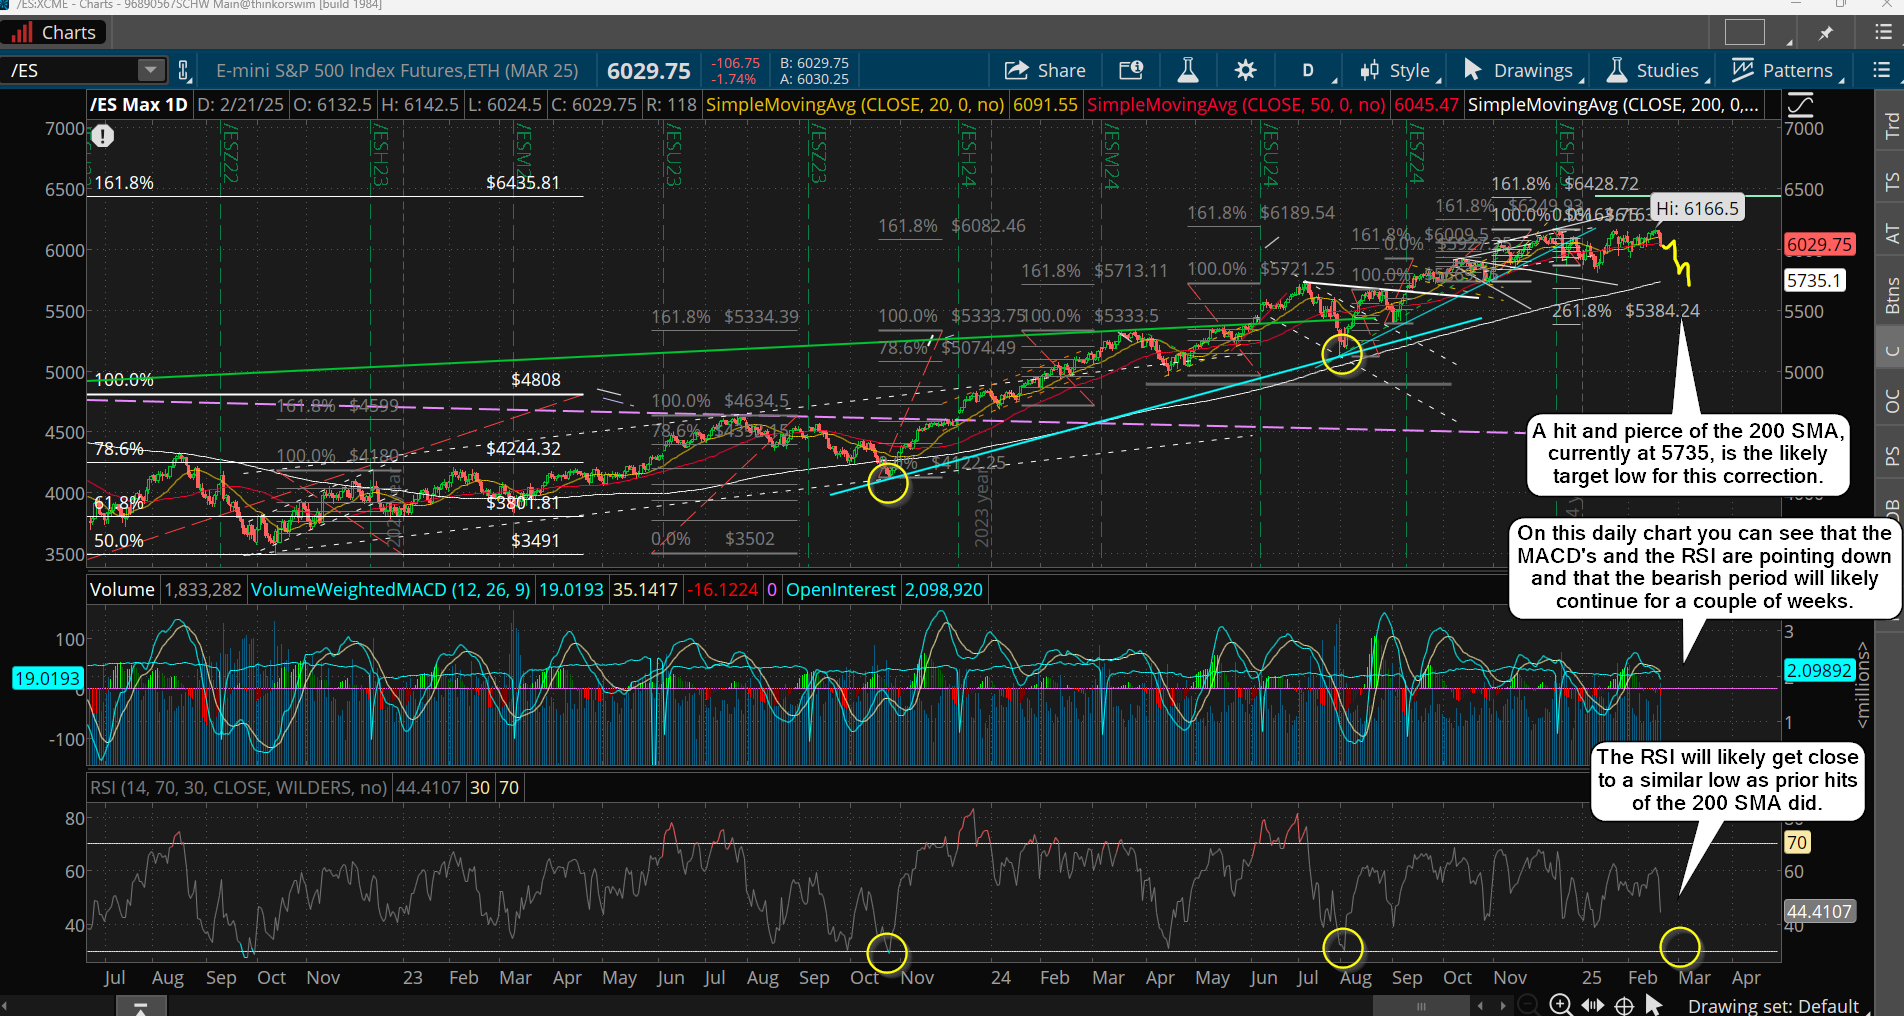
I still think we will see the prior low take out, which could easily get flushed by a 100+ points, and that means we "might" even reach the 5600's? I wouldn't count on it, but the 5700's seems very likely at this point. The "when" part is either on March 3rd or the 7th/10th. For example, if we double bottom on March 3rd at the 5800 zone then I'll look for the March 7th/10th low to be a lower low that take out that double bottom and probably pierces the 200 day SMA, and of course that would be a final wave 5 down.
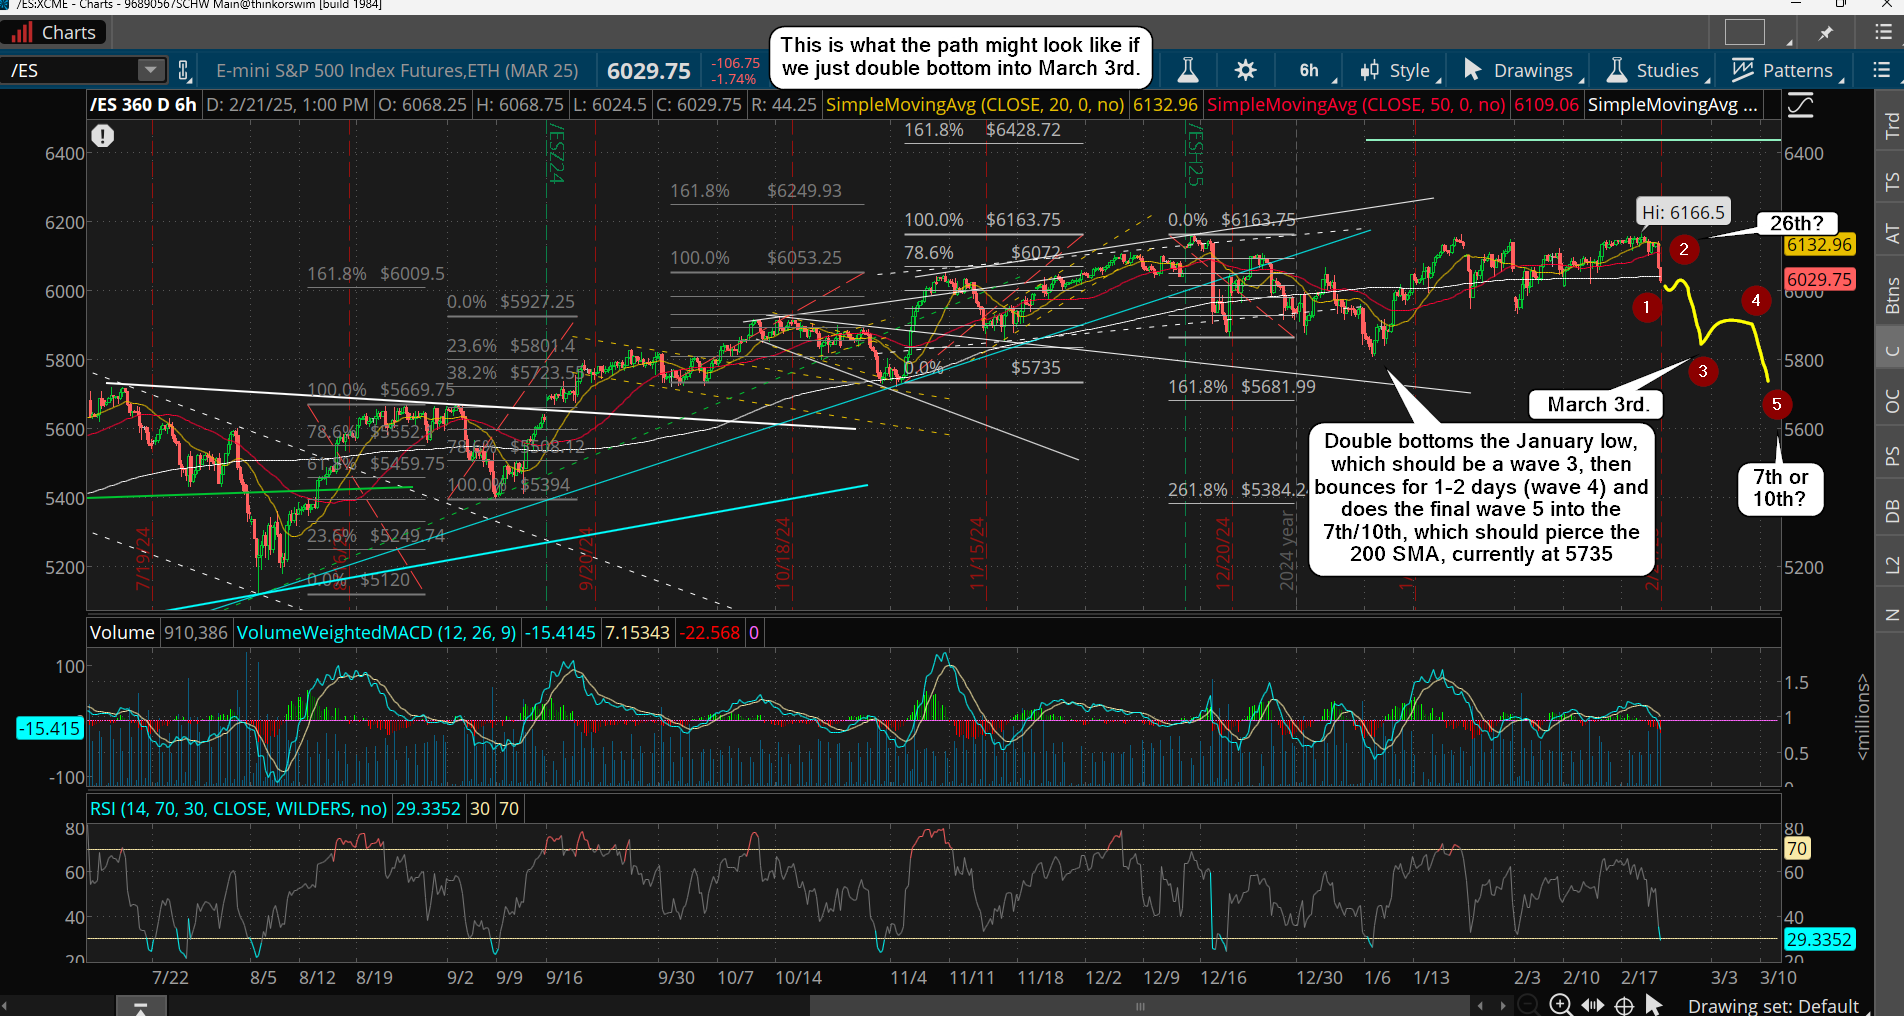
Or, if we take out the 5800's cleanly and drop deep into the 5700's on March 3rd I'd then think that the 1-2 day bounce will be a wave 1 of some degree and a wave 2 down for a higher low into the 7th/10th will follow.
One way or the other we should see the double bottom taken out to hit all the stops on the bulls and to reach and pierce the 200 day simple moving average. After that the bottom should be in and we will see higher highs and higher lows going forward the rest of the month.

Have a blessed day.

ES Morning Update February 18th 2025

2

As I said in the prior post I'm not going to be doing as many new posts due to the lack of being setup on a new Windows 10/11 computer.  Everything is on my Windows 8.1 computer.  I'm just going to post less until I can get back into the grove of things and I've not even started to set everything up on a Windows 10 computer yet.  I have a Windows 11 computer (I hate it) but it's not setup with all my usual programs, nor has the monitors of my Windows 8.1 setup.  Anyway, here's what I see for this week...

The most likely turn date is Wednesday the 19th, but it could be off a day or so and drag out into this Thursday or Friday.  The key thing to watch is for the market to run the stops overhead by at least 50 points, if not a 100.  Then we should start back down.

But with another turn date around the 26th we might not drop very much in the beginning and could do a bounce back up into next Wednesday for a lower high, and then collapse into mid-March, like right in front of the FOMC that month, which is on the 19th.  I think we will bottom prior to then but we could bottom in the first week of March, go back down for a higher low into the second week and then after the FOMC we have a strong rally.  It's too early to know right now but that's certainly possible.  I'm just focused on catching the short that should appear this week.

Have a blessed day.
ES Morning Update February 11th 2025

3

No New POSTS For Awhile!

Charles Scwab, who now runs Think Or Swim (TOS) has screwed me... they are not supporting Windows 7 and 8 now, and all my charts are on 8, which means I won't be doing any new daily posts until I can install 10 or 11 on my primary computer, and get all my settings set back up. It might take a week or more gang as I have a lot of stuff on my Windows 8.1 computer and it's not easy to move to a new one. I have a backup computer with Windows 11 on it, which I hate, but it only has 1 monitor and I use 6 monitors on this Windows 8.1 computer. This is a real nightmare.

Have a blessed day.
ES Morning Update February 10th 2025

0

This week is quite bearish on the bigger cycles, which means decline should be fast and scary, but short lived. It should start Monday and can last as long as this Thursday, but might also end Wednesday after a flush out bottom it put in from a bad CPI number. Then it's back up again in a grind for a week or two before another drop late month into early March. As for the coming low, it could pierce the 5900 level to get close to the 1/13/25 low, but I think it's going to stay above it and not take it out.

That's yet to be known for sure but I do think it takes out the recent double bottoms from 1/27 and 2/3. As for the short term, I posted a chart on X Friday showing a possible path, which points to one more move up to complete a wave 5, and that might happen today, hard to say?

NOTE:  On this chart I've drawn the possible 5th wave with 5 subdividing waves inside it.  It does NOT have to divide as it could complete with just on wave.

With CPI out this Wednesday I'm thinking we are going to go into it with a low as I already said, so the move up today to a new high might not play out. I'll just say that if we do make a higher high today it's a short with an exit either into the CPI or after it.

I also posted another chart on X of a possible Fake Print, which might be the target to get hit on any rally up today?  Here's that chart...

If it is hit though it's only a lower high, but that might be all we get?  It will still be a short in my opinion.  But it will be a weaker short as without those stops take out above the all time high there's going to be too many bears below, which will limit any decline.  I'd then lean toward the 2/2 low of 5936 ES "not" getting taken out and a higher low happening into the CPI (most likely), and a surprise "good number" sparks a rally back up again.  More up's and down's that go nowhere to frustrate bulls and bears alike, as both are looking for a trend move, but that might be months away?

Have a blessed day.
ES Morning Update February 7th 2025

2

Today is the big day for the bulls as they have the best chance for a blow off top happening. Any new all time all over by at least 30 points I'd think will be enough to clear out the bears that shorted yesterday.

If I see this happens I'm a big bear next week and would not be surprised to see some bad news come out over the weekend to cause a gap down Monday, which will look like a repeat of the recent big drop down days, and it should only last about 2-3 days, like into the 12th (maybe the 13th?) before it bottom and turns back up to do another squeeze for a week or two.

This is a swing traders dream to be able to get so many big up's and down's happen. And it's likely to continue until August with the market not really going anywhere. It reminds me of 2015 where the market had months of going up and down in a range until it finally crashed in August. I don't think we will repeat the crash again, like back then, but we could do it in October maybe? Anyway, I'll keep this update short. If we get a new high today I'm looking to short it into next week.

Have a great weekend.

ES Morning Update February 6th 2025

0

We finally got the breakout late in the afterhour yesterday from the chop range we have been in for several days. As I said yesterday we have several news events coming up and any of them can give us the blow off top.

This morning we have the Jobless Claims, which could cause it? I do think we get a move up from it, but I don't know if it has enough to break through overhead resistance from the multiple tops we have. Plus there's a FP on the SPY afterhours yesterday pointing down to the chop zone, which is at 602.00, but that could also be a late fill and not a real fake print target.

However, the technicals will get overbought on the 2hr chart if we gap up and hit a quadruple top around the 6100-6120 zone. The 6hr chart isn't overbought though and it could push up more and allow the market to breakout. It's a flip of coin here as I don't know if it has enough strength to do it or not? I guess if the jobs number is super great then anything is possible. If we get past 6144 on the ES we could see a squeeze happen and we should run up to a new all time high to my target of 6235-6245.

But that's a big "if" as I just don't see it in the technicals or prior patterns. There is the 6163, 6162 and 6144 prior highs that will all be taken out in one big squeeze once the lowest one gives way. Prior patterns doesn't suggest it will happen today from the Jobs Number but if it does that's great as I'll be ready to short it. Odds though lean toward a gap up today to 6100-6120 and then a pullback to retest the breakout zone from the chop of the last several days.

And we have the possible FP on the SPY that would be the target. If that all happens today then possibly tomorrow with the Employment Situation we can get the squeeze for the blow off top? If that doesn't happen then it should be next Wednesday with the CPI number, and we've had CPI numbers in past put in big turns so that's a real possibility that it could happen again. If I remember correctly the 3502 bottom on 10/13/22 was a CPI day, and so was the 4180 top on 12/13/22, so that's the key date for the blow off top if today or tomorrow doesn't produce it.

For the short term though my lean is a gap up into the 6100-6120 zone and then a pullback to the 602 SPY FP, and more chop with an upward bias into the CPI next week with some decent odds that the blow off happens tomorrow instead, but I'd want to see a nice recover into the close today of any pullback so they can do another gap up tomorrow.

The "Wildcard" is if we gap up and keep going and that's certainly possible as I said.  It's not my lean but there is a prior pattern that "if" it follows it we will indeed just keep going up and make a new all time high in a few days, like possibly by tomorrow or Monday?

As you can see in the chart above yesterday looks a lot like 12/22/22, and it was followed by 2 strong days up with today being like 12/23/22, which then topped out the next trading day on the 27th, and that was of course the Santa rally but the pattern looks very similar to now.

Have a blessed day.
ES Morning Update February 5th 2025

0

Yesterday was kind of a "pause day" as the market ran into overhead resistance and couldn't get through it. It pulled back some afterhours to reset some short term overbought charts, but the 2hr and 6hr still have room to run higher. The 2hr is probably going to get overbought on the next push higher, which I think will reach the 6100-6120 zone on the ES, and that's where we could see a pullback of say 100 points possibly?

It should NOT be the final high though as I still think we bust through the current triple top and hit the stops on the bears over it. Best guess is 80-100 points over the current all time high, and that might happen as early as this Friday but it could also drag out into early next week.

The market loves to trick the most traders so if we see a run to to the 6100-6120 today or tomorrow then I think we will see a pullback (maybe 100 points) into Friday to keep all the bears short. Then some positive news will come out over the weekend to gap it up Monday and squeeze those shorts up to the new all time high. This Thursday we have Jobless Claims, which could be blamed for the pullback into Friday, or (if we don't rally today to 6100-6120) could be used to get the market up to the quadruple top zone of 6100-6120.

Friday has the Employment Situation, which maybe it is used for the pullback? These events will be used some how to produce the turns in both directions, but I don't know which one does what. I'm just patiently waiting for the 6100-6120 rally to exit longs and re-enter on the pullback, but I will NOT short yet. The final target is roughly 6240-6250 on the ES, and only then will I become a bear.

Have a blessed day.
ES Morning Update February 4th 2025

0

We held the double bottom to make the second right shoulder of the inverted head and shoulders pattern yesterday and rallied nicely. The RSI and MACD on the 6hr chart have plenty of room to go higher, but I'm sure the market will have some trouble breaking out when it reaches a quadruple top, so a pullback of some degree is likely this week.

The new all time could happen anytime after that pullback, and that might be this Thursday or Friday... possibly even next Monday or Tuesday. But cycles point to this week being the last week of strength for the bulls as the bears should be taking over soon, and will control the rest of February.

For the short term, I'm looking for move up to around 6135-6145 to squeeze out the trapped bears. Once done I'd expect to see a pullback for a day at most, and probably not more then half the entire move up... which would be back down to the 6050 zone where the gap down was at. That move should trap the bears and provide the fuel to make a new all time by early next week.

Have a blessed day.
ES Morning Update February 3rd 2025

0

On Friday we finally reached a triple top, but short term charts looked too overbought to me to support a blow off gap up Monday and I posted a chart on X midday suggesting we will not do the breakout and instead go sideways in a range for about a week before we finally breakout though resistance and run the stops overhead. Shortly after I posted the chart (below) President Trump announced that he was going to doing tariffs and the market sold off fast to erase that entire rally and close down for the day.

For me, it was there in the charts that we were too overbought to hold up there and a pullback is needed to reset them. But I didn't expect it to be news driven and to happen so fast.

As I write this post over the weekend there's nothing new from him but I do believe that when we see the charts get nice and oversold we will also see him come out and announce some deal with the countries he was going to tariff and that will cause a big squeeze. When will that happen you ask? I don't know but I'll be looking closely at the 2hr RSI and the 6hr too. Below is the 2hr chart...

As you can see it's more about "time" then "price" as if the market can go down early Monday and find a support level to hold at then it can just chop around down there until the RSI gets oversold enough to bottom.

Then some deal announced during market hours or even after the close will be the spark to get the squeeze back up going, and I would expect to see it breakout this time around, and if it goes all the way up to my target (about 6218 SPX) into Wednesday or Thursday then it's all done for the rally. But if there's no news about a deal on the tariffs I'd go back to the market chopping in a range all week and breaking out next week to hit the target (like next Monday or Tuesday).

Considering that the "turn window" for the bulls to end their rally, and to let the bears take over, is this week I lean toward some deal happening to give the bulls the trigger needed to blast off faster and finish it all this week. That's just my lean of course.

Above is a chart of the QQQ that I posted on X Friday as well. It shows the FP's and my thoughts on the most bearish case for it playing out. It doesn't have to go that deep but it would be a great long setup if it did. The deeper it pulls back I think the easier it will be to reach the new all time high, so I would love to see a move down to around the 1/27 low, but a slightly higher low, which on the ES would be around 5980-5990 I'd estimate. Below is the 6hr chart...

You can see the obvious Inverted Head and Shoulders pattern that has already been formed but to have a second right shoulder would be the ideal spot to go long I think. It would likely take all day Monday for the RSI to get oversold on the 6hr chart but I'd love to see it happen.

Have a blessed day.
ES Morning Update January 31st 2025

0

A lot of a chop yesterday as the market tried to shake out bulls and bears both before a breakout happened. This pattern reminds me a lot of the 3/21/2022 period into the 3/29 high, whereas the market did a little dance around 3/22 to 3/24 back then, which was just under the recent double top highs from 2/2 and 2/9 in 2022. The market is repeating that pattern to some degree it seems as it stays under the 12/16/24 and 1/24/25 double top highs.

It should get up closer to those prior tops today, similar to either 3/25/22 or 3/28/22 back then. If we rally up today and make a triple top then we should be similar to 3/28/22, and that means Monday we should see a breakout new high happen like 3/29/22 did back then. I'm still looking for about a 100 points higher then the double top highs so that it can take out all the stops on the bears.

It might drag out into Tuesday if today doesn't get up close to the double top as then it would be more like the 3/25/22 high, which was a Friday back then just like today. But we are so close now that I do lean toward a triple top today. Regardless, we are very close now to an important top before we rollover for a nice correction in February.

Have a great weekend.

ES Morning Update January 30th 2025

0

We got the pullback yesterday for the wave 2, and while it didn't go as deep as I would have liked it was enough to make me very bullish going into the next few days. I don't know when we will top but between this Friday the 31st and next Wednesday the 5th is the likely period. I think we can see 100+ points over the current all time highs as it will take out every last bear out there before we rollover for a good pullback in most all of the month of February.

We could top tomorrow if they really get the squeeze going, who knows? The technicals are lined up really nicely for a strong rally to start today was we should be in a wave 3 up and we have that nice Inverted Head and Shoulders pattern too. Plus the MACD's and RSI on the 2hr, 6hr and Daily support more upside before the market exhausts itself.

We also have a triangle pattern now, which is called a bull pennant flag, and it too suggests we go up at least a 100 points over the current high, probably more. But after this last squeeze I'm big bear again.

Have a blessed day.
ES Morning Update January 29th 2025

0

Big day today as the FED is likely going to cause a lot of wild moves. From a technical point of view the short term charts are getting close to overbought and they are up against resistance from the gap window. I can also count 5 waves up from the low, which I think is a bigger wave 1 up, so a wave 2 down is likely coming today after the FOMC.

Again, I don't think we are going to repeat the 12/18 move where we drop hard that day, bounced like yesterday and made a lower low... which would be compared to today. I think we make a higher low, like maybe the 6000 level or so? It should be a wave 2 and might play out in an ABC move were we get an early pullback today (for the A wave), before the meeting, and the a B up into the meeting at 2pm EST. It will setup the market perfectly for a nasty drop into the close afterwards... BUT, it should NOT take out the Monday low.

It should make a higher low that sucks the bears into thinking we are going to tank hard the rest of the week. That's the trap in my opinion as the daily chart is still bullish on the MACD and the RSI, and so is the 6hr chart. That implies we will turn back up on Thursday to start a wave 3 that should be very powerful as it will have many bears trapped.

This pattern will be a "inverted head and shoulders" with 2 left shoulders and 2 right shoulders. The move up should easily make a new all time high and my thoughts of a 100+ over the current high will be an easy achievement for this pattern. There's earnings out after the close today for some big name companies, which I'm sure could be used as an excuse to start the wave 3 up. It's all in the charts now, so all we need to see is one more pullback today into the close. Then a gap up and go tomorrow keeps the bears trapped that hold short after the close.

Have a blessed day.
s2Member®