

Today is the day for the bulls to attempt to put in a bottom. They must take out the 3/4 and 3/5 prior highs, which is the 5880-5900 zone basically. I thought we might see that happen last week with a squeeze after the NFP Report but it didn't happen. Instead we dropped lower into a midday new low Friday before recovering some in a late day rally.
If that was an A wave then the sideways to slightly down pullback into the close would be the start of the B wave. Next we should see a C wave up, that that should be today, which is the bearish case and the entire ABC would be a wave 4 I believe, and that would leave a wave 5 down to the 5560-5580 zone still to come into the end of this week.
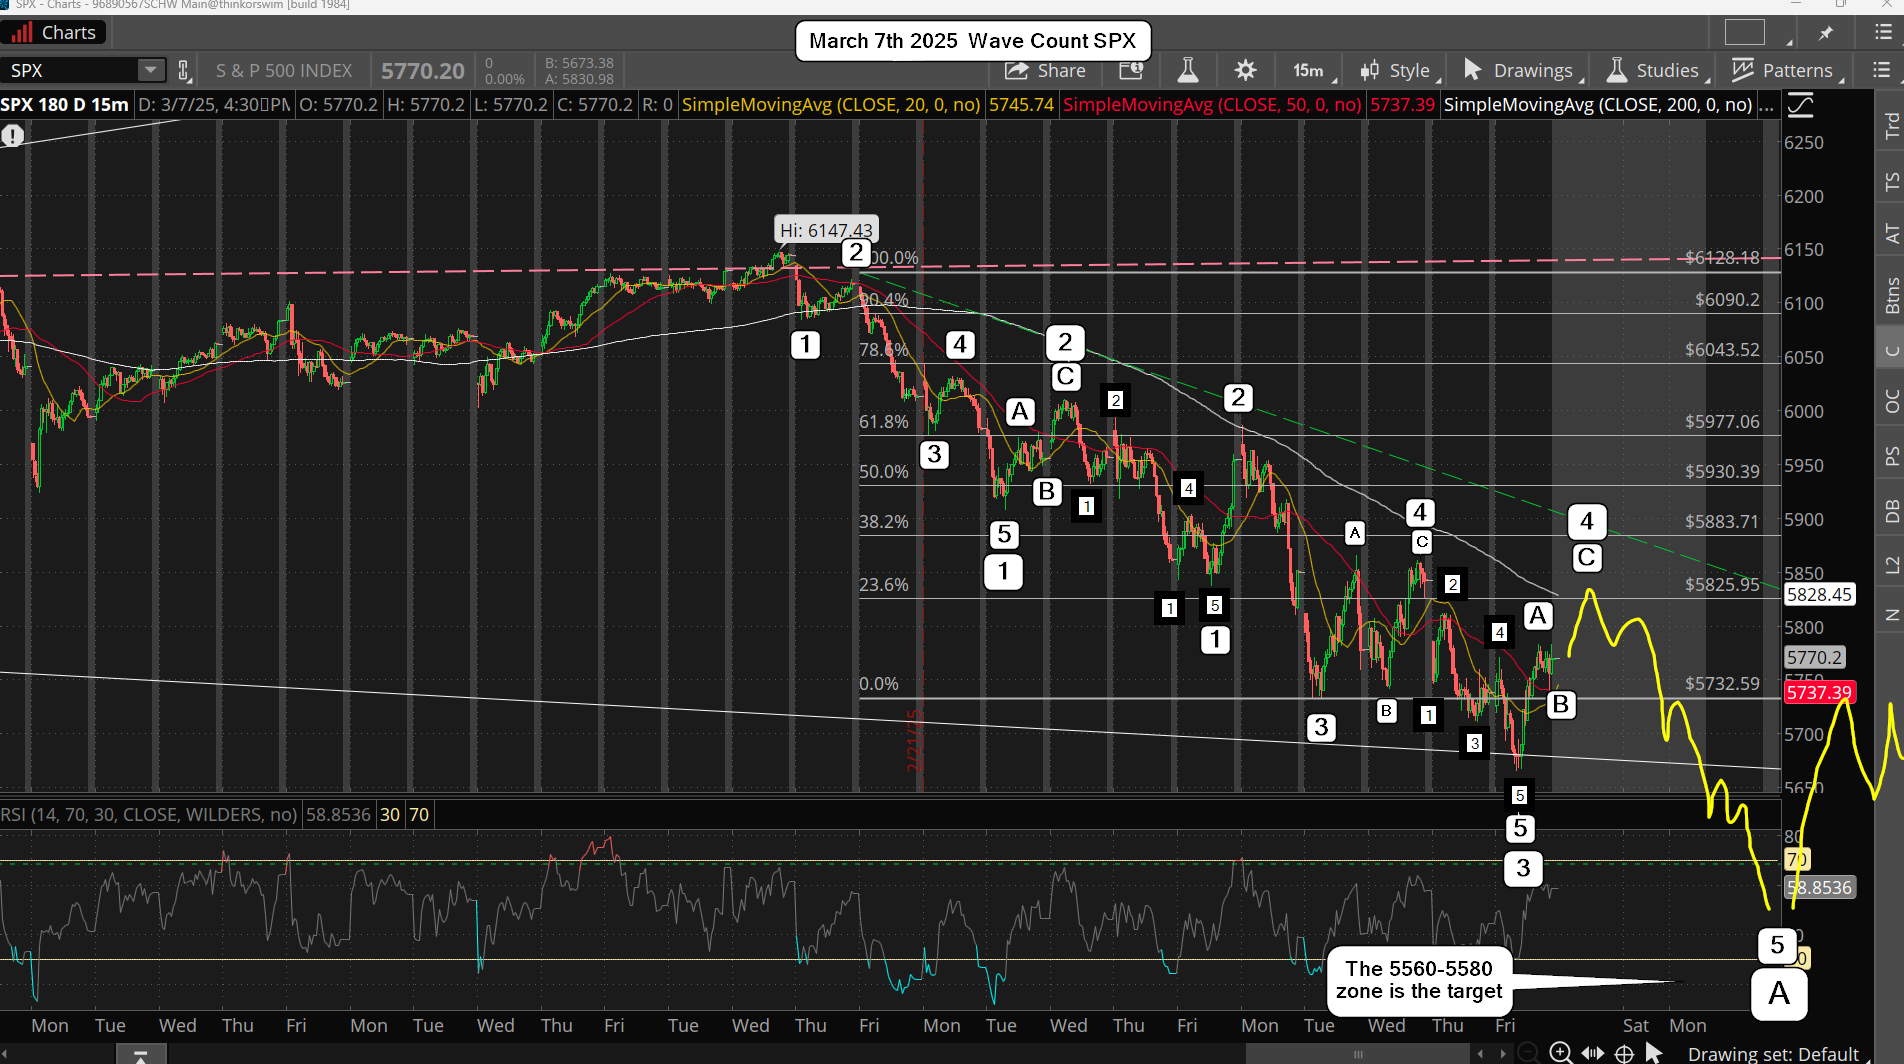
This is my lean as I just don't think the bulls can take out the overhead horizontal resistance today. If they can then we'd be starting a 5 wave rally up (larger wave 1), not an ABC corrective wave 4, but I don't think that's the case. My "best guess" is that we finish the ABC up for a wave 4 today, start wave 1 down of the final 5th wave into tomorrow.
Bounce back up some for the wave 2 by the close Tuesday, and then the CPI comes out Wednesday morning and we see the start of the wave 3 down inside wave 5, which should complete the wave 4 and 5 to end that larger wave 5 by this Friday. That entire 5 wave move down from the all time high will then complete a larger A wave.
Have a blessed day.


Tomorrow 3-11, is 666 weeks from the great Venus eclipse of June5/6 2012. We are back in another Venus retrograde period which saw the March 6,2009 major low. The 2012 eclipse event also saw the death of Fahrenheit 451 author Ray Bradbury. (at the age of 91)
Trin was very low so we didn’t see a bottom and a certain little indicator has plenty of more room to run to the downside. Some indicators are starting to enter bottoming areas but I wouldn’t consider a bottom until there is a large spike seen in the Vix and Trin.
I looked at the chart of the Nasdaq crash of March/April 2000 and the markets are in a similar position to that in early April. There was a flash crash on April 4 which was a Tuesday. I no longer have access to certain data so I don’t know if a certain indicator was in a more oversold condition. Right now it is moderately negative. It would probably take 2 more down day to get it in a very oversold condition.
That Trump March 12 tariff date might have some meaning.
I’m starting to think we are going to crash. If so, this Friday should be the low… maybe 5000 SPX? Here’s an interesting article… https://pomp.substack.com/p/is-the-trump-administration-crashing
Yeah, that could work. It looks like we’re in line for a meltdown into Friday, the lunar eclipse.