

We sold off into the close yesterday as expected but I thought it would be just a wave 2 pullback, but instead we took out the low and made a new lower low. What's next? Here's what I posted in the free chatroom yesterday and I still think one or the other will happen.
"ONE is that we rip hard after the NFP Report at 8:30 am and open in the cash market with a big gap up. The top will be into Monday. Then we drop hard all week to bottom next Friday with 5500 possible. TWO is that we gap down hard (after the NFP Report) and hit the 5500's by midday or so tomorrow. Then we rip hard for many days afterwards (more then 2, but I don't know how long) with no bulls left and a ton of trapped bears. One of these paths is what I see."
I do not know which one will play out but if it's number ONE the rally will be short lived. Basically a squeeze into Monday and then we rollover again to hit the low-mid 5500's by the end of next week. Now if it's number TWO then I'd have to think the low is in for awhile, meaning any move back down next week should make a higher low.
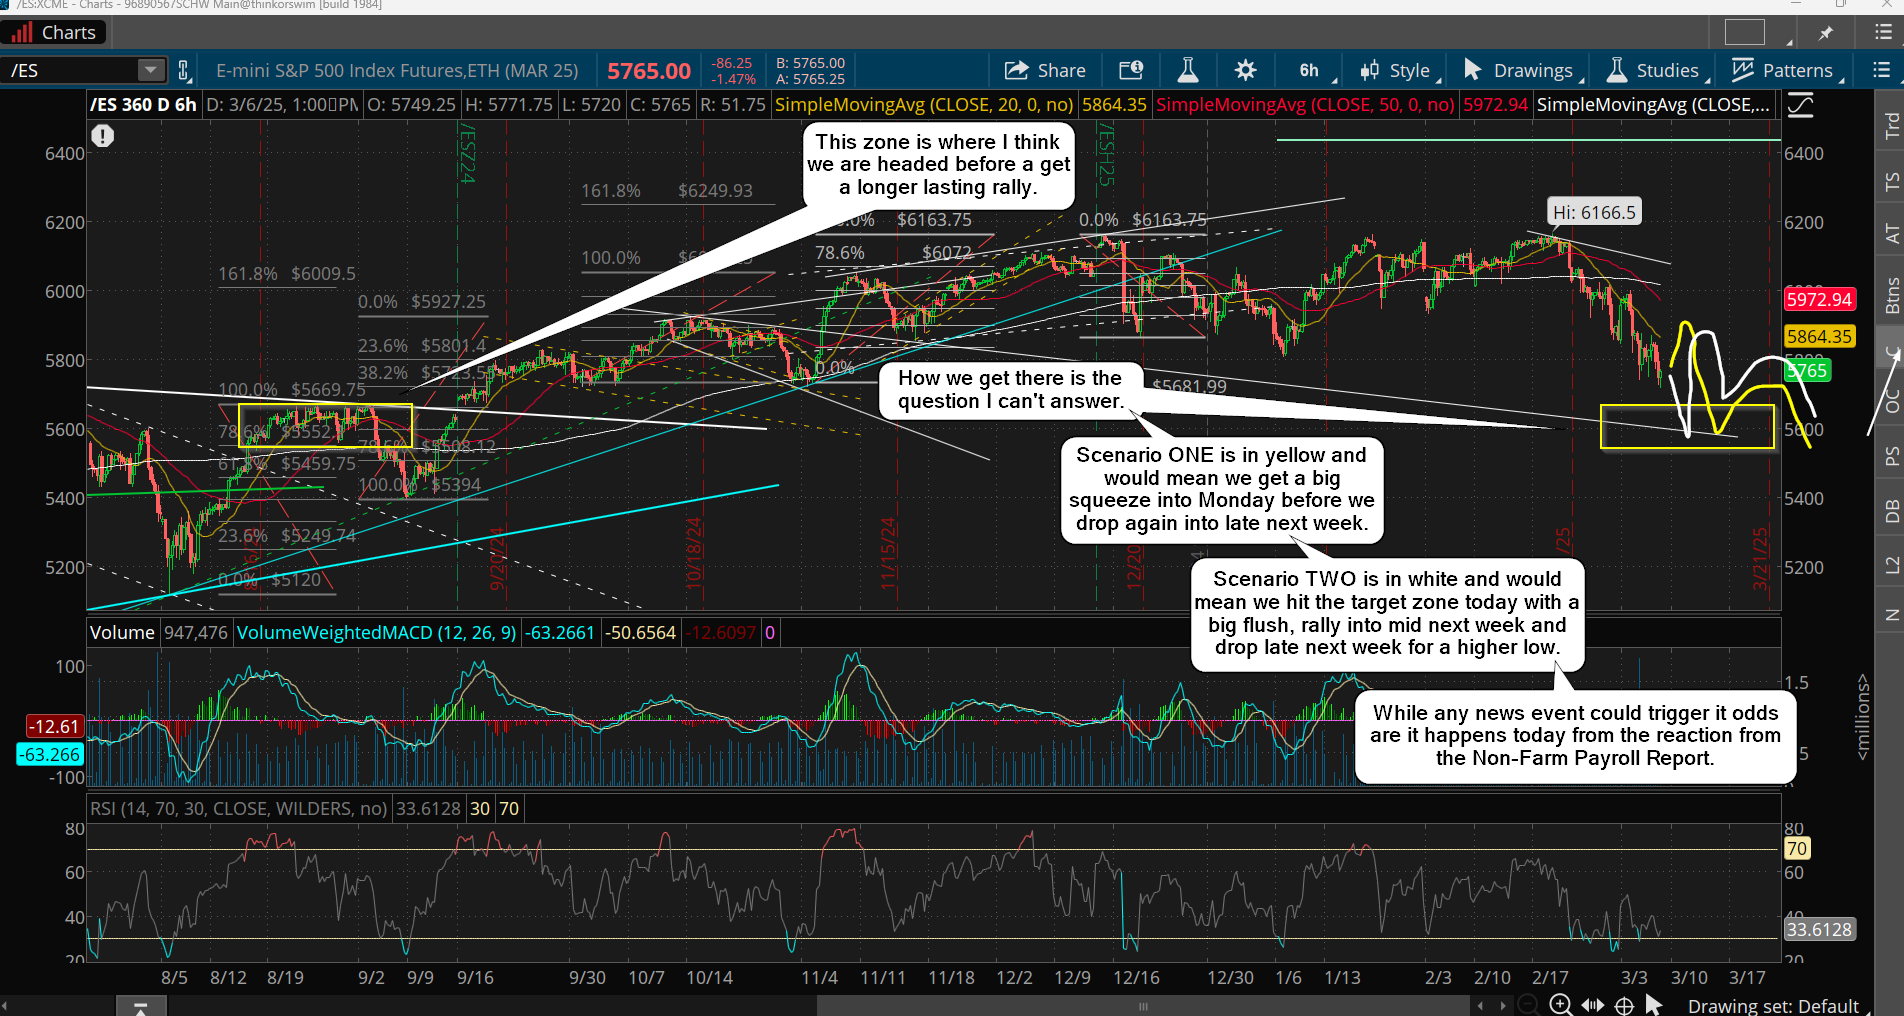
In this case we'd see the low-mid 5500's today and a huge intraday reversal back up to close green. If we see this happen everyone will be massively bearish and will short every move up. While there will still be more pullbacks they should not take out the low from a flush of that amount today. Which one will it be? We'll know after the 8:30 am Non-Farm Payroll Report as that's where the reaction will determine the direction.
Have a blessed day.


Well we finally dropped below the 200 day average but the SP500 finished the day bak above. The SP got down to the early November pre election low and then did the bounce which it did in a certain historical epoch when it reached a similar level.
The SP 500 also got down to its weekly lower Bollinger Band and to another weekly key indicator. Since the worst astrology is in the second half of March, I’m worried that we could get a big bounce. But a certain indicator will be passing a certain potential trigger point on Monday. When it passed a similar point in May 2010, a flash crash was triggered. The bars on Tuesday and Thursday were seen the day before the flash crash. When it finally broke the 50 day average,the SP500 tumbled. The 200 day average might be a similar trigger.
There is a big Ray Bradbury weekly numerology cycle next week and I might have been given a sign last nite….(if you read my texts then you know what I’m talking about).
There is also a lunar eclipse on Friday.
The averages dropped farther in 2020 before the first big bounce and that included a drop well below the weekly lower Bollinger Band. We’re already at 3 weeks down so we’re running out of time on the downside unless we’re doing the slower methodic decline of late September 1929 but we are even behind on that timeline unless you want to start with the Feb 19 high which would be a different pattern.