

Two Possible Moves Coming...
But both end with the same result... a BIG DROP!
Yesterday, in the chatroom I wrote the following...
Short term... I still think we pullback tomorrow and/or Friday, but it's probably a higher low then the recent one last week. That pullback probably finished S4 in a one wave move instead of an ABC like I had hoped. So we are likely in S5 up now, and if we don't make a higher high today we should have ended T1 up with the current high yesterday. That suggests we are in T2 down right now, which should subdivide into an ABC before finishing. Yesterdays' early pullback was the A wave, and we are in the B wave up before the open today. The C wave should happen tomorrow, and that would finish T2 down. After that we should see T3 up, T4, and T5 play out all of next week to complete S5.
7:18 AM
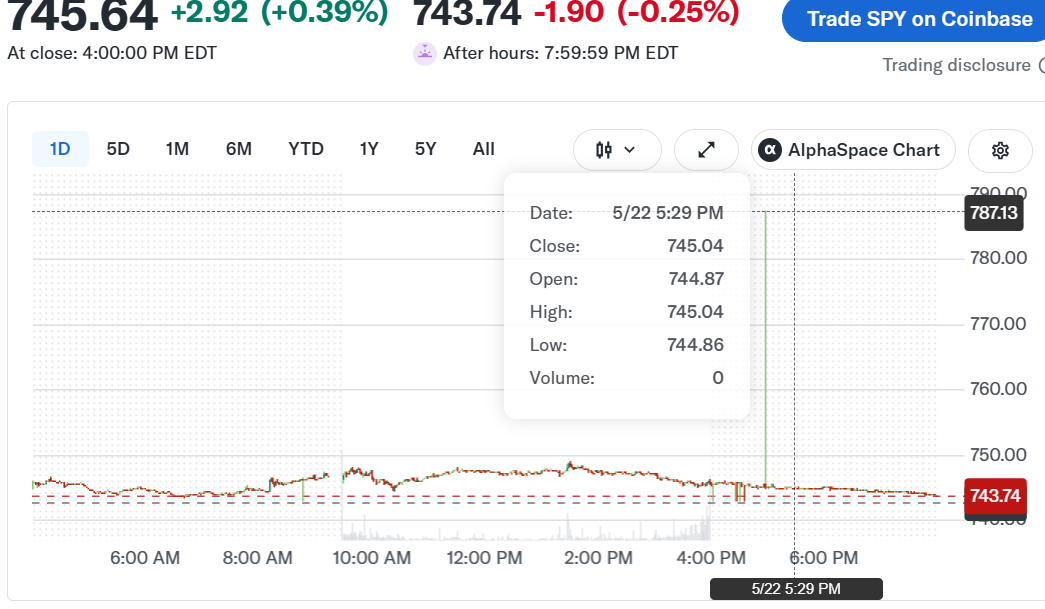
Now... with the new upside FP being put out I have to think that will be the rally up later this year, after the coming nasty correction in June/July. It suggests to me that we will ONLY hit the 759.35 FP on the SPY late next week (or the following week?), and then we do the big drop... which could reach the 600.14 FP? It's hard to say how deep it's going as that FP could also be saved for AFTER the new FP of 787.13? But... it's looking likely that whatever decline we get in June/July will be followed by another massive rally up in front of the midterm elections and Reza's new FP could be the target.
7:23 AM
So, what is this new FP of 787.13 you ask? Here it is below...
I think everyone knows how powerful Trumps posts or comments are when it comes to moving the stock market. While no one has the power to stop the bigger cycles from playing out the size of the decline can be reduced in a cycle, and the rallies can be extended.
Now I don't know how deep this coming decline will be, but we do have the FP on the SPY of 600.14 put out, so if we get a decline that deep everyone will be so bearish that no one will believe that we can go back up to a new all time high into the midterm elections... but the new 787.13 FP on the SPY suggests that will happen.
The problem with all FP's is that we never know the "when" part on hitting them. We have to use the cycles for that, and they don't say the depth or height... only the window where a turn down should happen, or a turn up. The majority of the cycles point to the window of June 1st-10th as still the likely period where this market will top out and turn down hard.
But it's not an exact science of course, and there's some cycles that point to the 5th-15th (more on that later). However, we have the 759.35 FP on the SPY that has a very high odds of hitting into this cycle top, so we have to give it time to play out. Once we hit the FP next week, or even into the following week, we know the top is in... but it still shouldn't fall off a cliff until we get into late June or July where the expected low for the entire correction should happen (the middle of July roughly).
For the near term there are two possible paths...
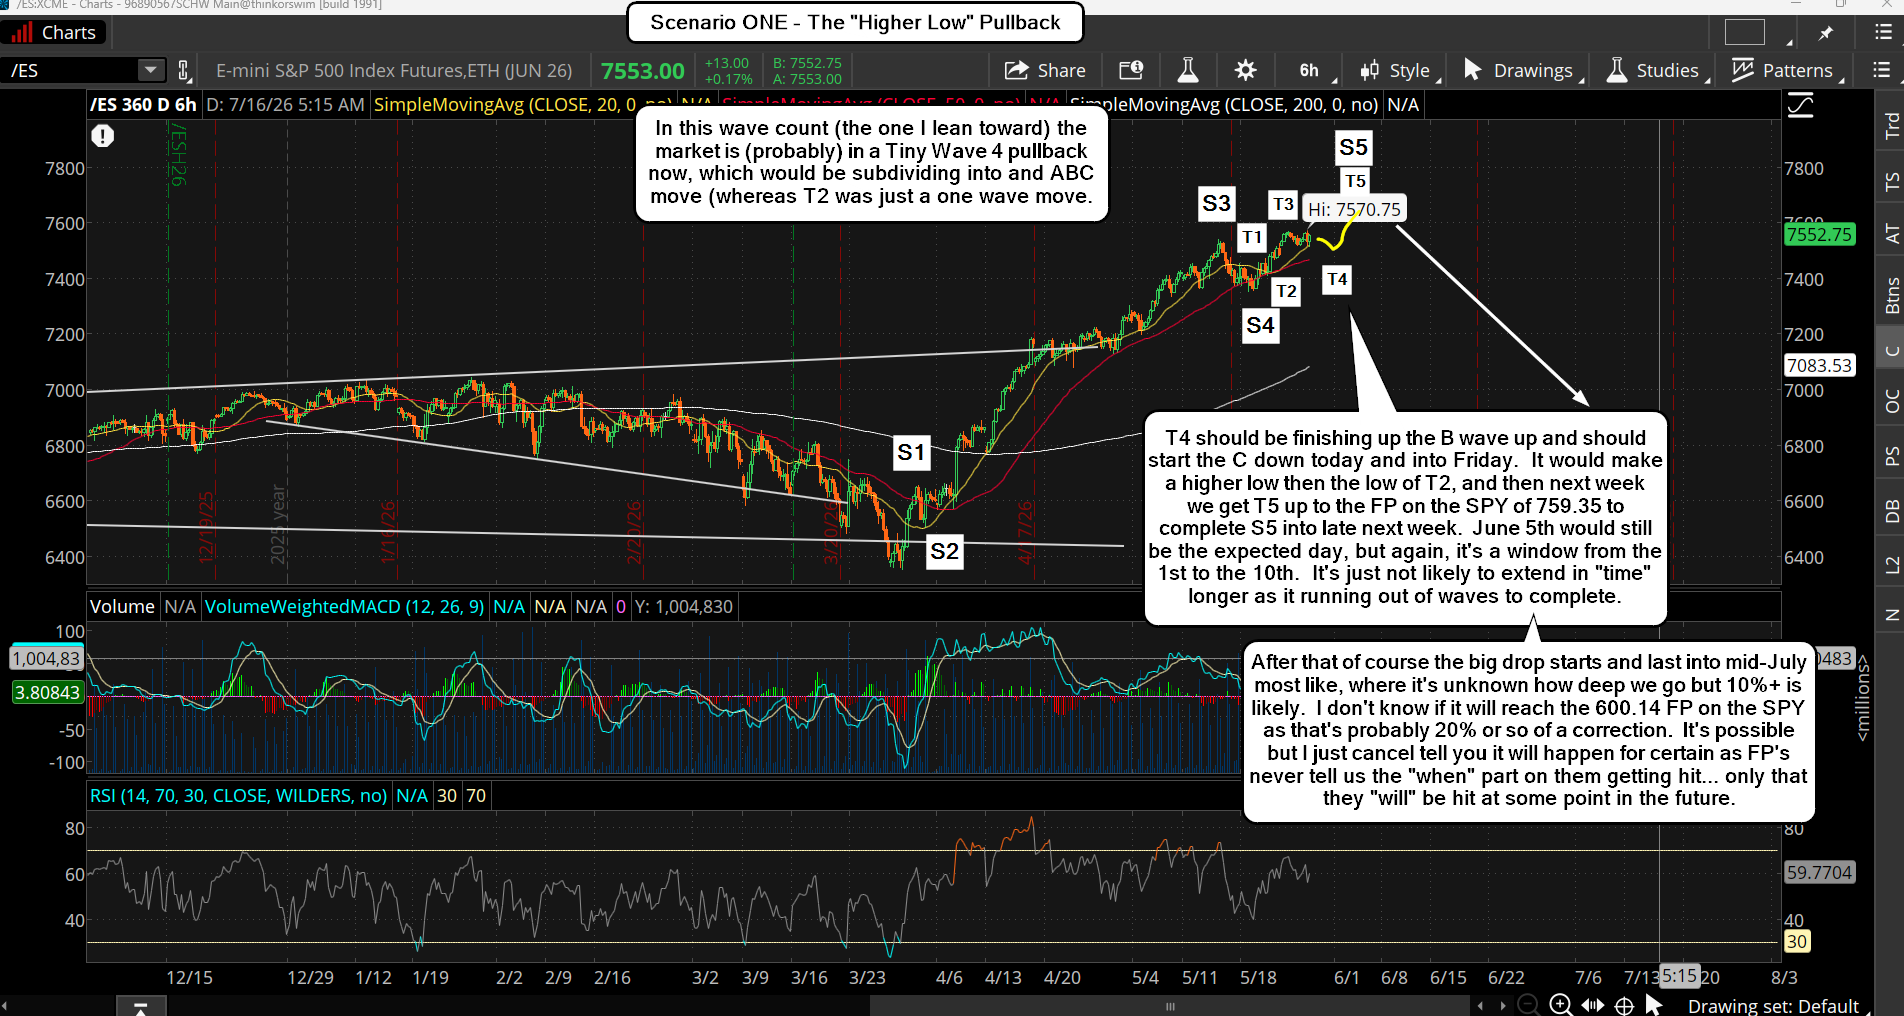
First one, which is the one I lean toward, I still think we pullback into the end of this week, but nothing big. The pullback would a higher low then last weeks low, which would be a Tiny Wave 2 (as I've previously said). Then up into late next week to finish it all off and hit the FP of 759.35 on the SPY into or around the June 5th date. Below is that chart and wave count...
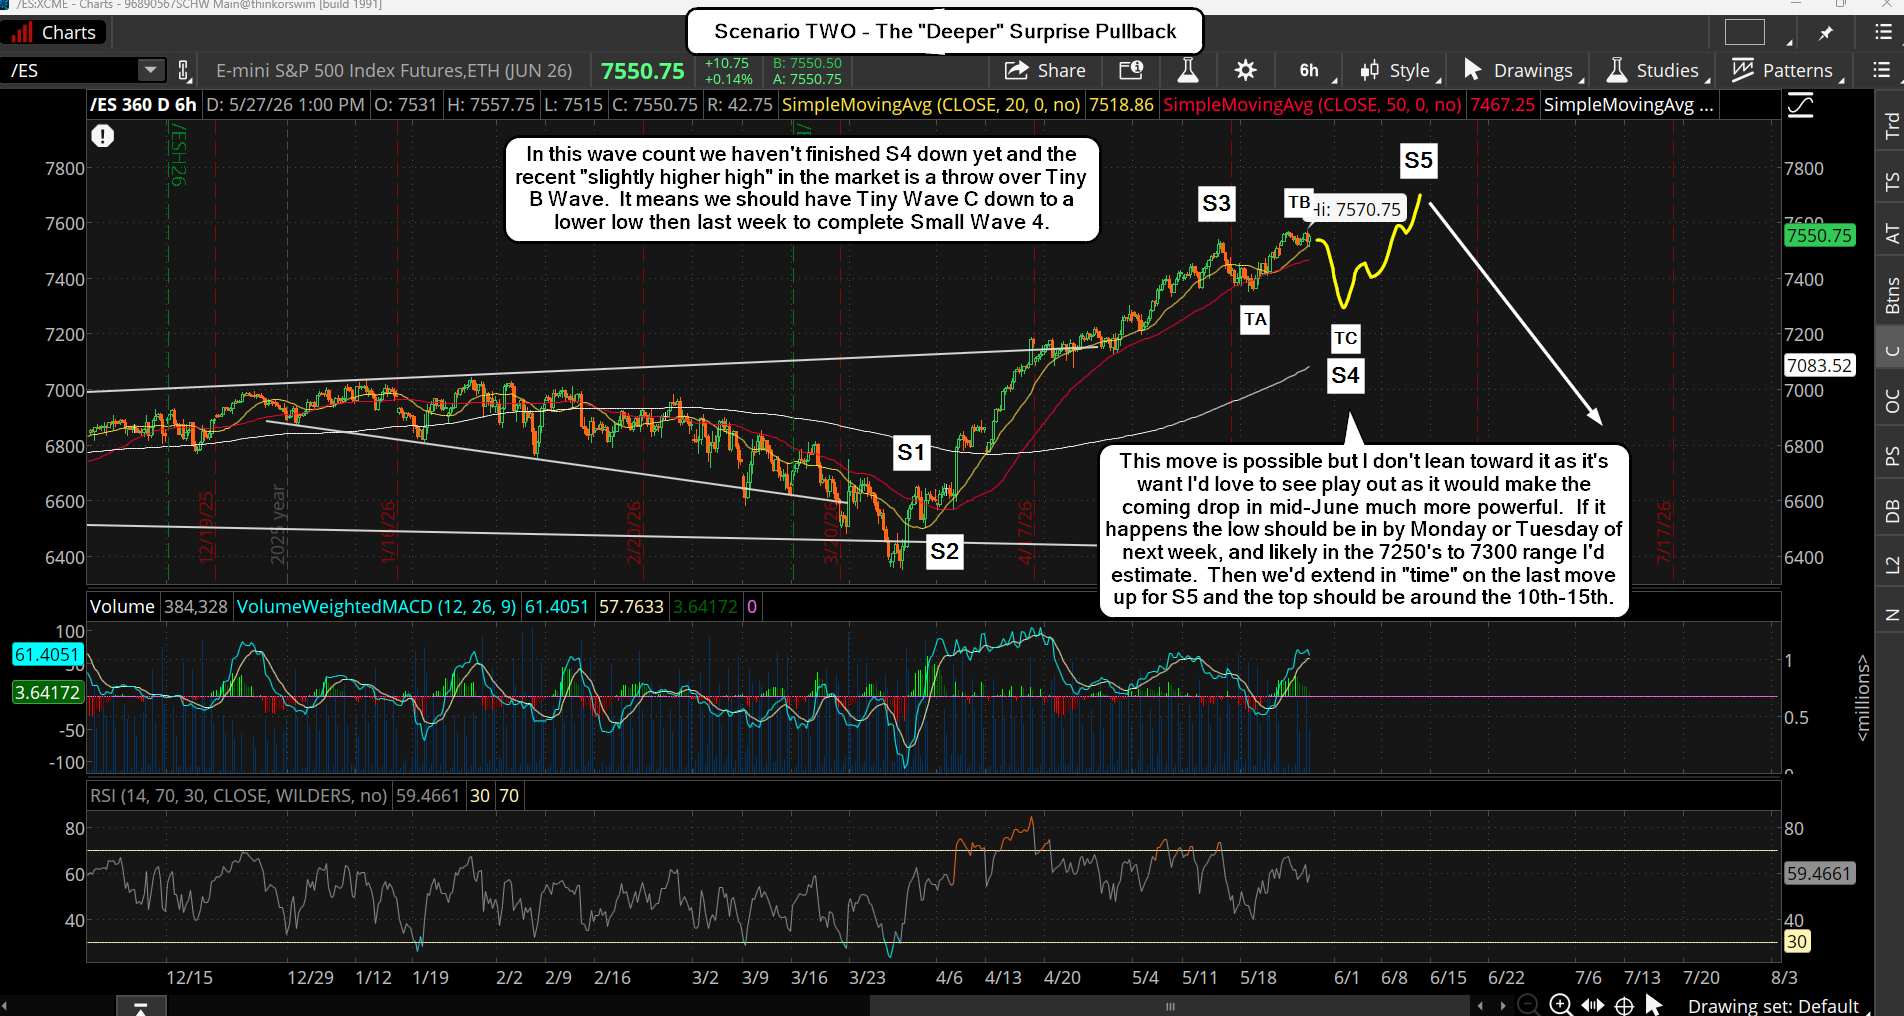
Or, second... the pullback is a deeper one that last into early next week and goes into the mid-7250's where support is at, and that completes Small Wave 4, which I'm not leaning toward happening, but would LOVE to see it. It would be the surprise move of course as most people are looking for more upside now, and if you take out the 5/19 low everyone will think the top is in and will short the market hard.
But... that should not be the case as the 759.35 FP on the SPY has not been hit yet, and the "time window" for the top (June 1st-10th) isn't hit yet. In fact, I'd then lean toward the 10th-15th for the top to happen as a move that deep would need more time to recover and there are some cycles that point to the 5th-15th as the window where the top should be.
And, we'd have a triple negative divergence on the daily chart from the MACD's and RSI if that were to happen, which doesn't have to of course, but it would be a more powerful setup for the coming big drop. Here's the wave count below...
Yes, we could top early from the cycle (meaning we've already topped) but since I have the FP on the SPY still not hit yet I have to think the odds are stronger that it will be hit and that the cycle window of either the 1st-10th (the small pullback scenario) or the extended 5th-15th window will be when it happens. I do not know which scenario will play out... but again, if it's a small pullback for a higher low then odds favor around the 5th or so. If it's a deeper pullback then time will get pushed out into the 10th-15th most likely.
Meaning, this coming top can drag out in "time" and frustrate bulls and bears both before it finally ends and rolls over. We just need to be patience and focus on the FP as it should be hit within the next week or two, and of course it will be pierced through. That's when I'll look to short it, and give myself enough time (July 31st) to allow the entire correction to play out.
But I just can't see that 600.14 FP getting hit in the coming decline... yet it's out there, and very likely real. We'll have to wait and see I guess as forecasting the future is impossible. A realistic correction would be 61.8% from the coming high, and starting at the March low, up to the coming high, would only be into the 6800's... but maybe that's too obvious and that's why the 600.14 FP was put out? Who knows for sure.
Lastly, the VIX and the ES contract expiration and roll...
If the market decides to go for the deeper pullback, then the June quarterly expiration of the ES, and the VIX will be important and the market usually likes to crush the VIX into expiration, and since it expires on June 17th, and the ES on the 20th (but the roll on the 15th), it's lines up nicely that the final high on the ES/SPX will go into the 10th-15th window to cause any VIX longs to expire worthless.
This is the perfect setup for any longs in the June ES Futures contract to get trapped too as we roll into the new September contract, which smart money will be shorting looking for the big drop into July. I must point this out as I can't get married to the idea that we will only pullback small in the next few days as a deeper drop into the 7250's is certainly possible... even if it's a wildcard.
Friday Bonus Update - Scenario THREE

Posted in the chatroom yesterday...
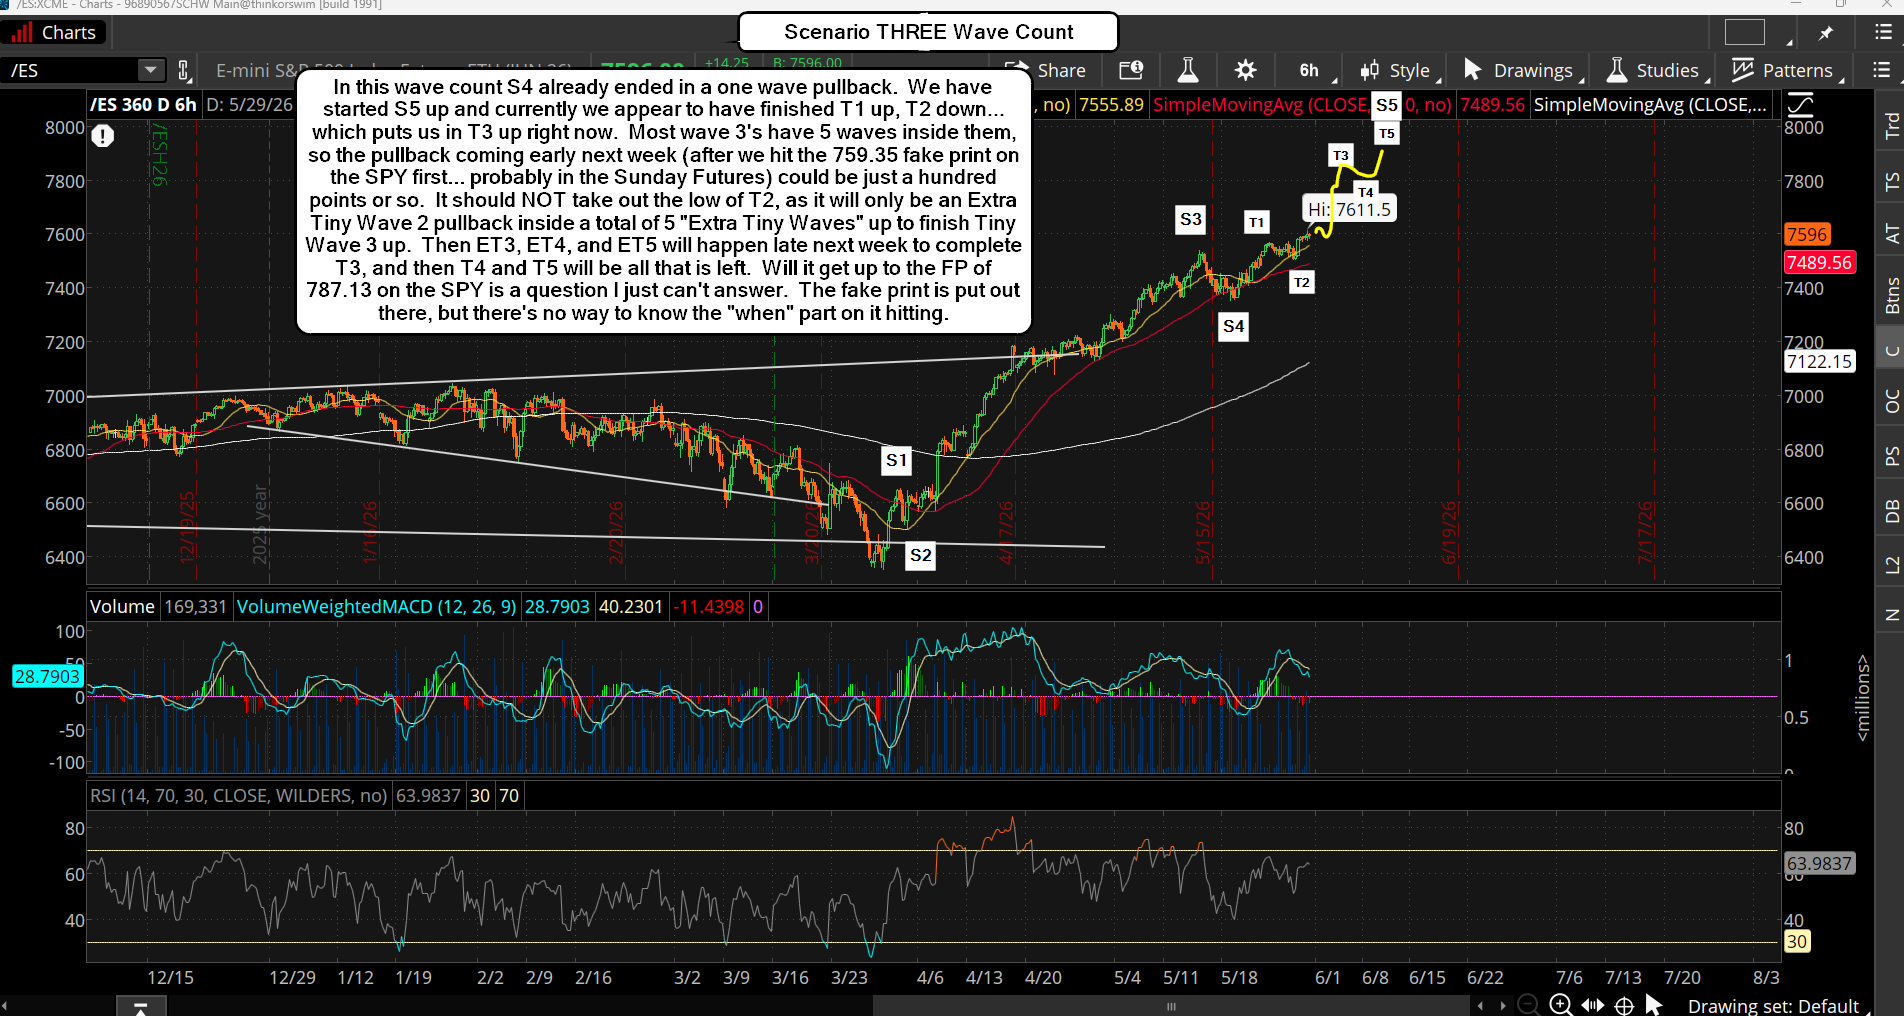
I think I know what they are going to do gang... if my hunch is right they are going to hit the 759.35 FP on the SPY sometime next week. Then they are going to pullback some (5%?) for a wave 4, and then do one final move up into the 15th area where they hit the 787.13 FP on the SPY. Then crash it into mid-July where they hit the 600.14 FP on the SPY. It's the perfect trap as if we get a 5% pullback everyone that missed it will short the move back up. But it won't be a lower high. It will keep on squeezing and squeezing until it hits the 787.13 FP, and all bears will give up then, and start calling for 8000. It might be right into the 17th where the new Fed Chief Warsh comes in. I don't know if he's going to do something crazy or not to cause the crash.. or if it's some other news event that gets blamed. But the timing is perfect for it to play out like this...
Wave Count for Scenario THREE...
Have a great weekend.


Great technical analysis on the SPX setup. The MACD alignment on the 6-hour chart is something I’ve been tracking as well. Appreciate the detailed breakdown of the support and resistance levels.
Thanks… it’s not easy but I’m getting a better feel for it now.
I spotted that symmetrical triangle you marked on the ES chart, and I’m leaning bullish on the breakout. I’ve been using Leonardo AI to generate quick trading memes for my own journal—the style consistency saves so much time. Curious if you think volume will confirm the move higher.
Volume usually gets lower and lower as we approach a top… but I do still think we have another push higher still left. I don’t think it will reach the 787.13 FP on the SPY, but I do think we’ll see 7700+ on the ES before June 15th.
Great analysis on the ES setup! I know trading mornings can get hectic, but after seeing your detailed breakdowns I started thinking about how much time I waste on meal prep instead of studying charts. Tried CookGo to organize quick recipes and it’s been a game changer for staying focused. Definitely worth checking out if you’re always on the go.
Great observation on the support levels holding through the morning session. The way you’re tracking those momentum shifts on the ES charts is something I keep coming back to. Do you find the volume profile shifts more reliable than pure price action for identifying those reversal points?
I don’t pay much attention to the volume. I mainly just look at the cycles as a guide to when a turn should happen. Mid-June is still the likely period, so between now and then we could stay in a wide range. Volume does tend to dry up as the rally gets exhausted. But there needs to be a bearish cycle appear for any really good correction to happen. That should appear the second half of June.
Interesting analysis on the ES setup for today. The technical picture you’re describing aligns with what I’ve been watching too. If you ever need to save trading webinars or market analysis videos from various platforms, VidMate makes it pretty easy to download them in HD.
Great breakdown on the ES morning setup. Those XCME charts really help visualize the overnight range. Quick question — are you seeing any key resistance levels forming around the previous session’s high? Would love to hear your take before the cash session opens. Always appreciate the detailed technicals you share here. Check out ProductHubX for more AI-powered tools that might complement your trading workflow.
The ES charts look solid for this morning setup. I’ve been watching the same resistance zones hold lately – the overnight range structure gives a clear roadmap. Quick question: are you seeing the same choppy action below the key level, or is this showing cleaner structure than yesterday’s session? Always appreciate the clear标注 in your chart work. Keep posting these updates – VidsHunt has become my go-to for market context alongside the trade calls.