
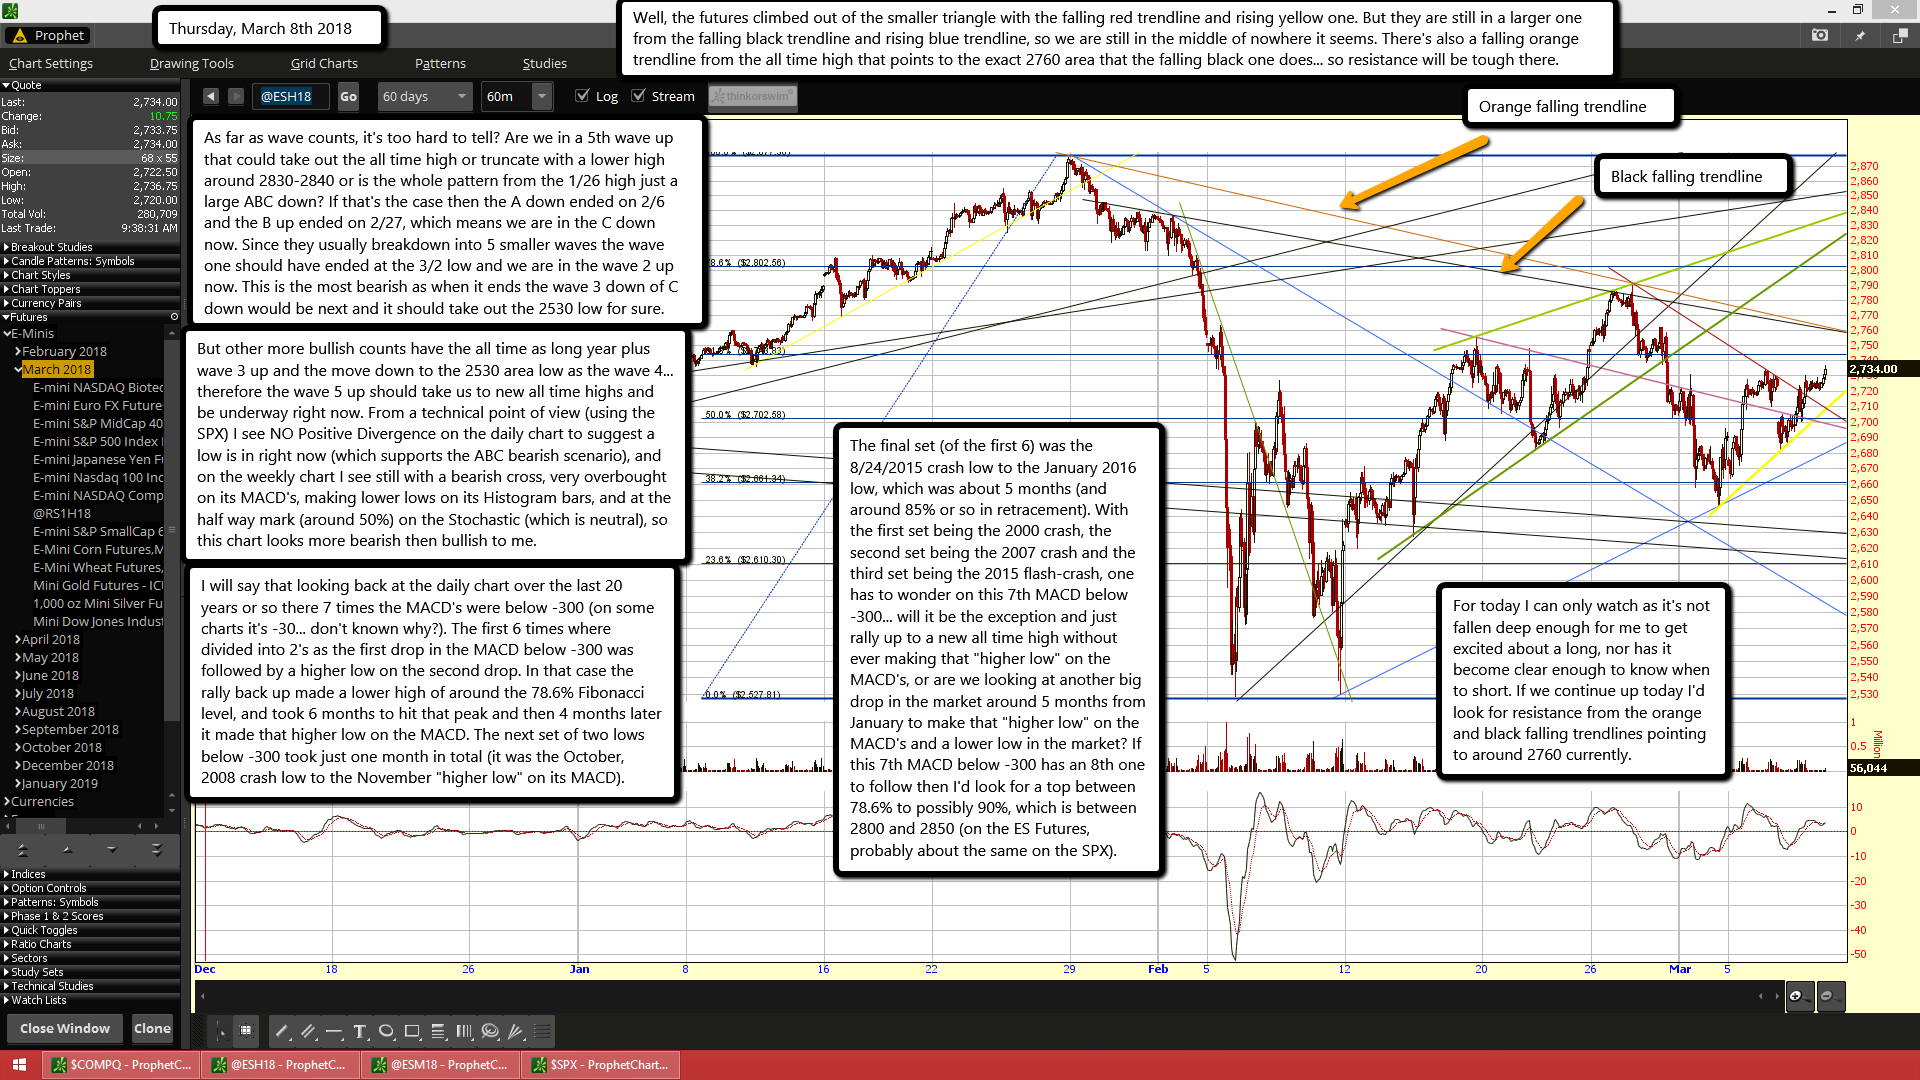
Well, the futures climbed out of the smaller triangle with the falling red trendline and rising yellow one. But they are still in a larger one from the falling black trendline and rising blue trendline, so we are still in the middle of nowhere it seems. There's also a falling orange trendline from the all time high that points to the exact 2760 area that the falling black one does... so resistance will be tough there.
As far as wave counts, it's too hard to tell? Are we in a 5th wave up that could take out the all time high or truncate with a lower high around 2830-2840 or is the whole pattern from the 1/26 high just a large ABC down? If that's the case then the A down ended on 2/6 and the B up ended on 2/27, which means we are in the C down now. Since they usually breakdown into 5 smaller waves the wave one should have ended at the 3/2 low and we are in the wave 2 up now. This is the most bearish as when it ends the wave 3 down of C down would be next and it should take out the 2530 low for sure.
But other more bullish counts have the all time as long year plus wave 3 up and the move down to the 2530 area low as the wave 4... therefore the wave 5 up should take us to new all time highs and be underway right now. From a technical point of view (using the SPX) I see NO Positive Divergence on the daily chart to suggest a low is in right now (which supports the ABC bearish scenario), and on the weekly chart I see still with a bearish cross, very overbought on its MACD's, making lower lows on its Histogram bars, and at the half way mark (around 50%) on the Stochastic (which is neutral), so this chart looks more bearish then bullish to me.
I will say that looking back at the daily chart over the last 20 years or so there 7 times the MACD's were below -300 (on some charts it's -30... don't known why?). The first 6 times where divided into 2's as the first drop in the MACD below -300 was followed by a higher low on the second drop. In that case the rally back up made a lower high of around the 78.6% Fibonacci level, and took 6 months to hit that peak and then 4 months later it made that higher low on the MACD. The next set of two lows below -300 took just one month in total (it was the October, 2008 crash low to the November "higher low" on its MACD).
The final set (of the first 6) was the 8/24/2015 crash low to the January 2016 low, which was about 5 months (and around 85% or so in retracement). With the first set being the 2000 crash, the second set being the 2007 crash and the third set being the 2015 flash-crash, one has to wonder on this 7th MACD below -300... will it be the exception and just rally up to a new all time high without ever making that "higher low" on the MACD's, or are we looking at another big drop in the market around 5 months from January to make that "higher low" on the MACD's and a lower low in the market? If this 7th MACD below -300 has an 8th one to follow then I'd look for a top between 78.6% to possibly 90%, which is between 2800 and 2850 (on the ES Futures, probably about the same on the SPX).
For today I can only watch as it's not fallen deep enough for me to get excited about a long, nor has it become clear enough to know when to short. If we continue up today I'd look for resistance from the orange and black falling trendlines pointing to around 2760 currently.

