I was beginning to wonder if this market would ever pause and take a rest, but... like all living things, it did! The sell off was impressive, but still looked a little bit like it was "controled". I'm not complaining, as it allowed me to close out my USO short positions, but I'm not ready to "jump up and down"... screaming the "Bear is Back" yet either.
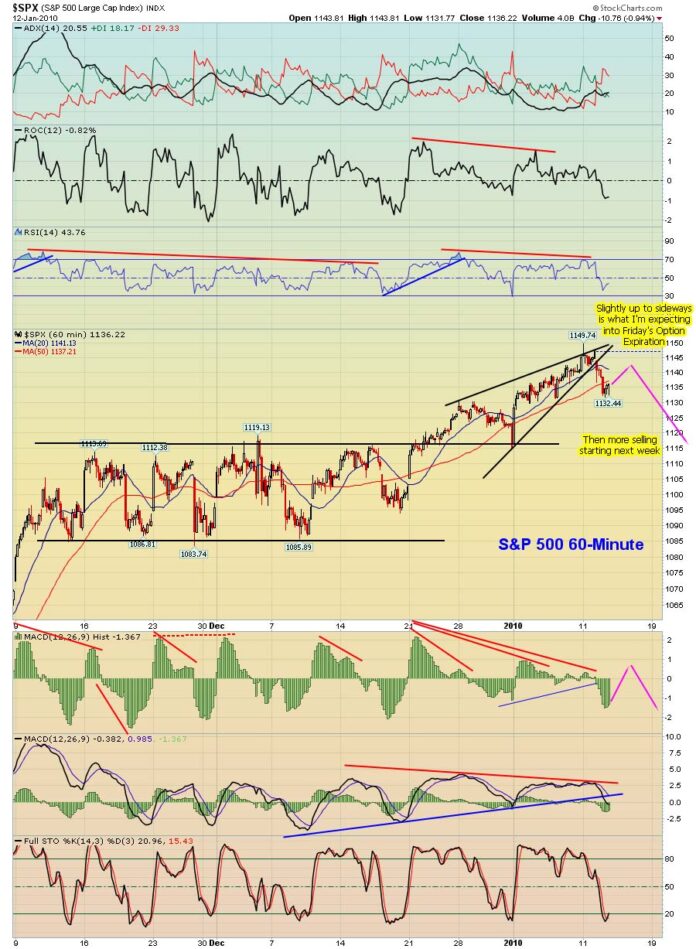
Volume was much better at around 166 million shares on the SPY. It's still below what I'd like to see... like 200-250 million, but it's a nice start none the less. So, what's next you ask? For that answer, I'm going to show you the chart below with my forecast as to where I think we are headed.
For the next 3 days, I'm expecting a sideways to slightly up market, as Option Expiration is Friday, and you know how those market makers don't want to pay out on those options. They will probably pin the close on an even number like 114 spy, or something. That would be considered your "B" wave (or 2 wave) re-tracement back up move. Then next week, I see the start of a "C" (3) wave.
Looking further out, I'm expecting the market to move lower into the end of the month, and rally back before the month is over, and into early February. Then I believe that early in February we will see a really large move down. Possibly a 100 point drop (not in one day), but it will be what Elliottwave chartists would call a "C" wave or "3" wave. Volume should be quite high then. I'd expect over 250 million shares as it goes down.
This first move down toward the end of the month should find support at the 108 SPY level. From there, I think we'll bounce back up about 50% (in a larger "B" or "2" wave), into early February. Then the larger "C" (3) wave will hit with about a 100 point drop or so. I'll have more detail as it gets closer.
For now, I'm looking to get back short by this Friday. It's option expiration week and I don't see any more large moves down (like today) until this week is over. That again means... a sideways to slightly up market for the next 3 days. If you are looking to go short, be patience and wait until Friday. The market could retrace back up 2-3 points each day from today, and be at about a 50% fib level by then (from the high yesterday to today's low). That would be around 1140 spx, or so. Regardless of what level it's at, I'll be looking to get short again.
Red


http://www.optionpain.com/OptionPain/Option-Pai…
TYPE IN QQQQ AND SPY THERE IS STILL DOWNWARD PRESSURE IMO
You need the “current pain” as the option pain takes into account every option traded since that contract was created. The current pain only takes into account the last 30 days… which is more accurate.
Remember, many of those positions have traded hands so many times that the market makers aren't going to lose any money on them. Only the recent one's that they have sold are of any concern to them.
They don't want to pay out on any of those positions, so they will try to pin the stock where they can payout the least amount. Of course you already know that, but you may not have known that the only thing that counts is the options sold in the last 30 days or so.
That's where the current pain is more accurate at predicting the final price. But, it doesn't work too well with ETF's, as they are harder to manipulate. It does stocks pretty well, as long as there aren't any earnings announcements during that last week. If so, then it can be way off.
Anna has a subscription to it, and she said it's not that accurate… especially etf's. (She's over at Hot Option Babe, in case you want to ask her. The link is on my blog roll).
love your blog keep up the good work
Thanks Ameronne…
My posts are a little different then the usual charts and statistics that other blogs put up (all still worth reading though), as I like to think of it as a mixture between a site that does a lot of Technical Analysis, and one that talks about the corruption in the system, politics, and things of that nature.
I'm somewhere in the middle? You might see a post that contains charts one day, and some conspiracy theory the next. But, it's all directed at figuring out where the market is going next… which is what everyone wants too know.
Red