
But if so the next move up should be a huge one...
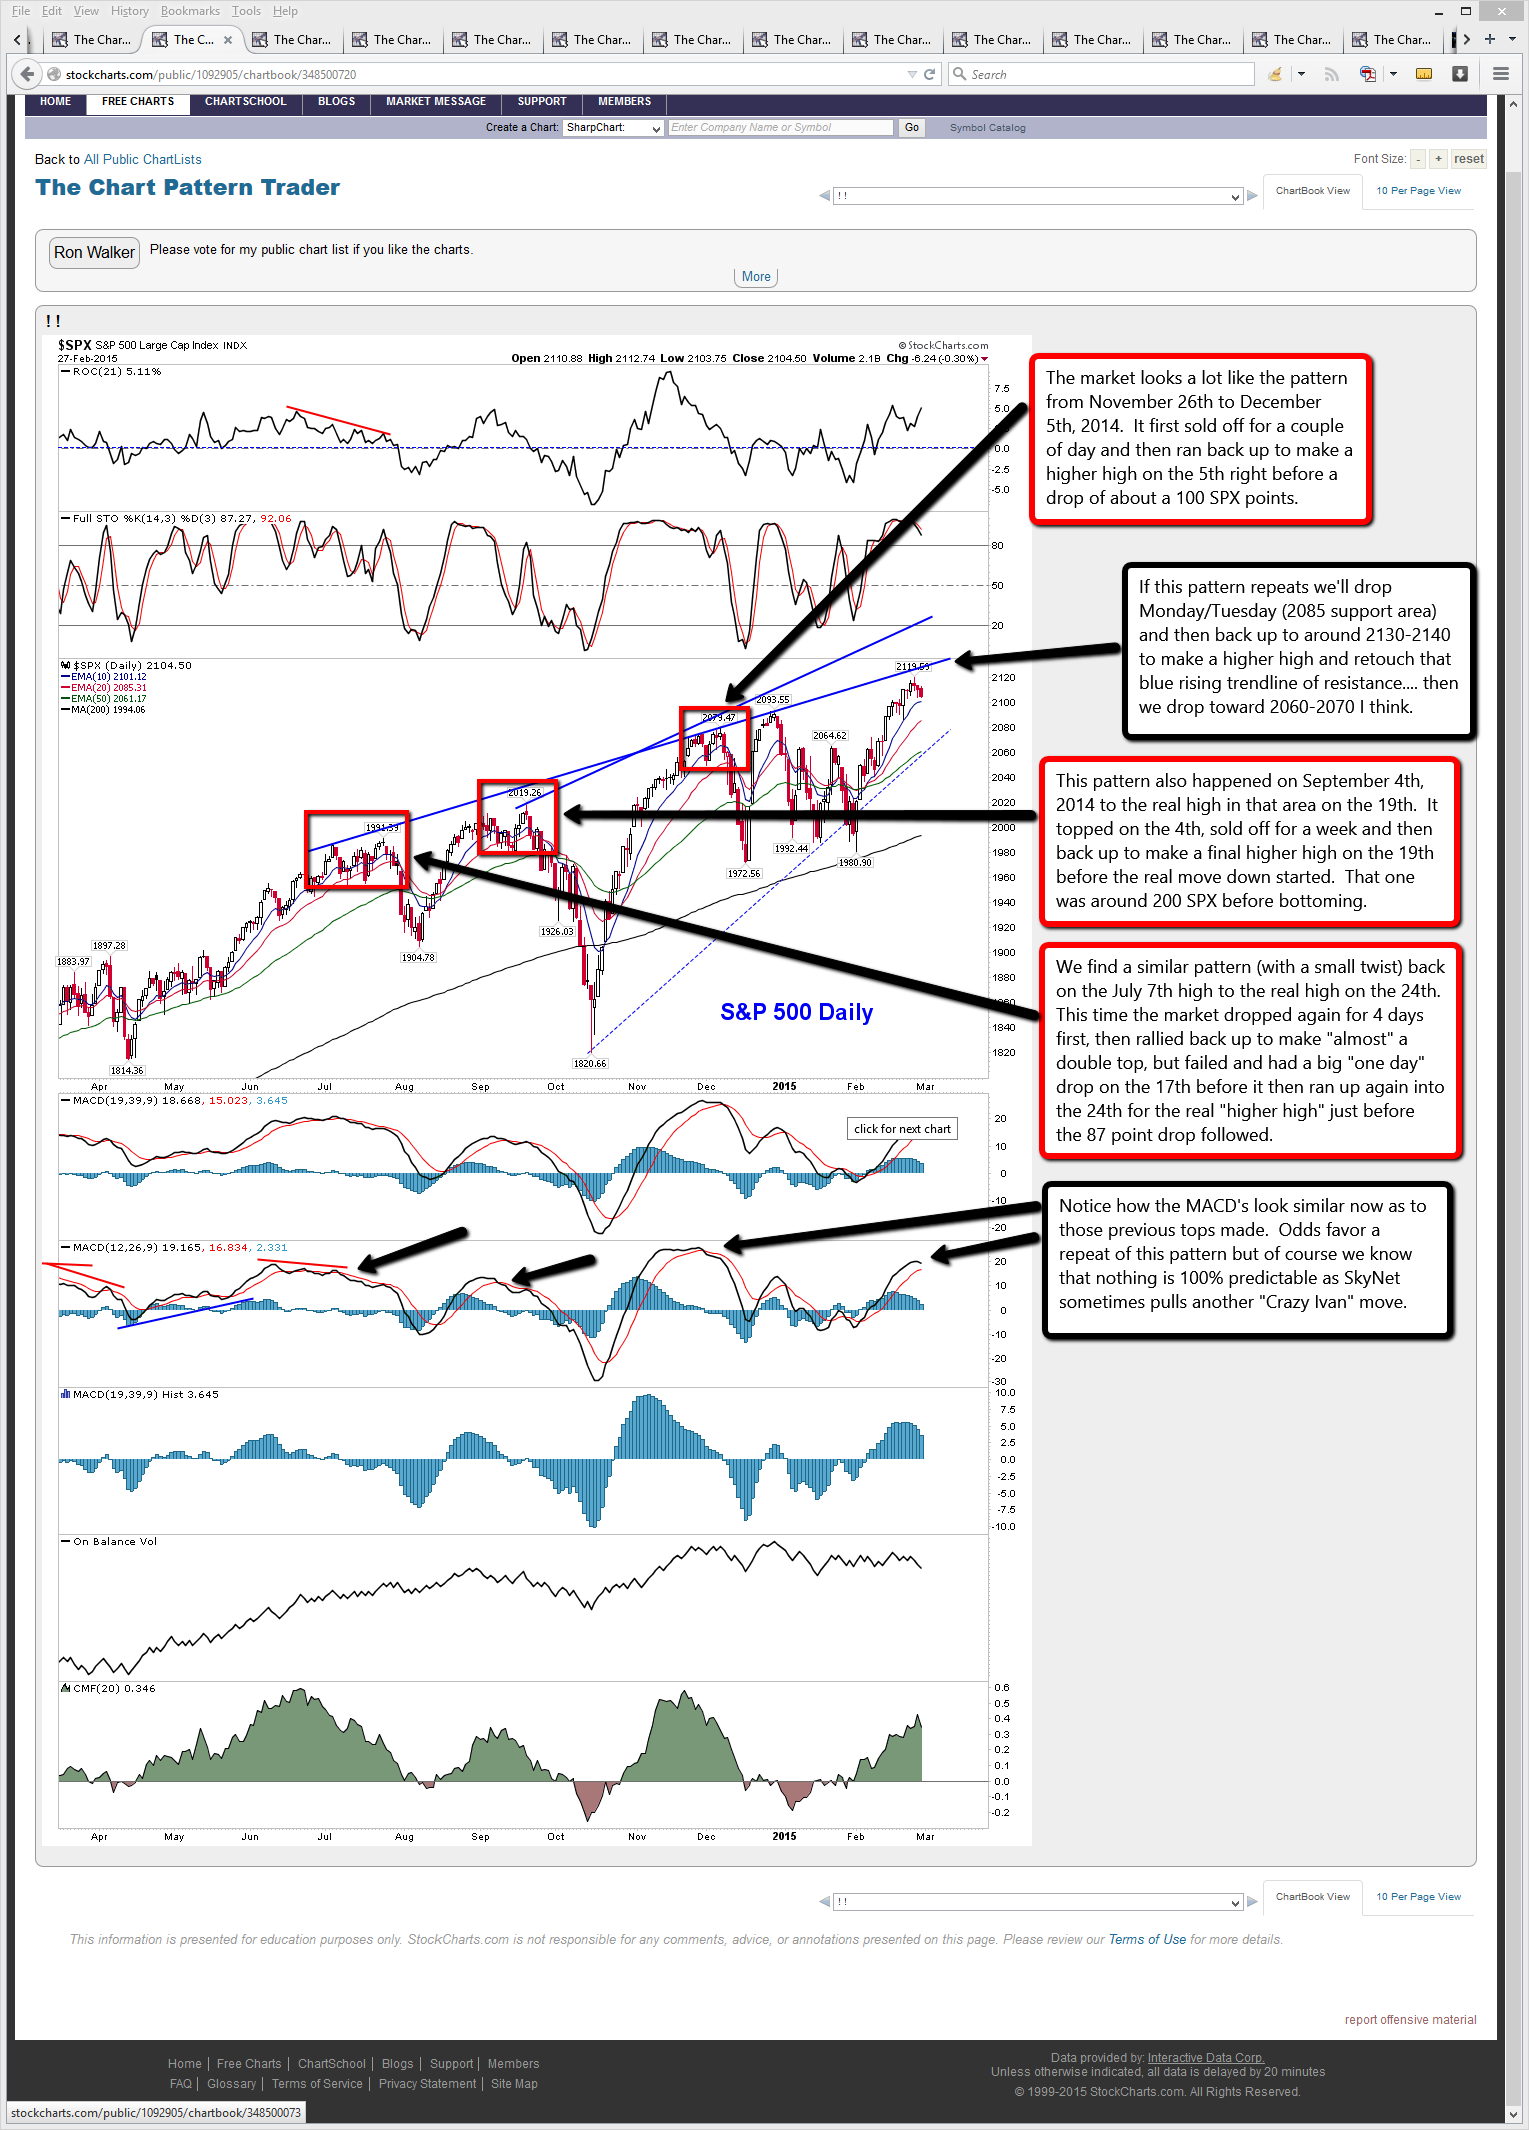
The market looks a lot like the pattern from November 26th to December 5th, 2014. It first sold off for a couple of day and then ran back up to make a higher high on the 5th right before a drop of about a 100 SPX points. This suggests we'll end the down move Monday/Tuesday (the 2085 area is good support) and go back up into the end of next week topping in the 2130-2140 area.
(to watch on youtube: www.youtube.com/watch?v=D5DVY_-B2d0)
This pattern also happened on September 4th, 2014 to the real high in that area on the 19th. It topped on the 4th, sold off for a week and then back up to make a final higher high on the 19th before the real move down started. That one was around 200 SPX before bottoming.
We find a similar pattern (with a small twist) back on the July 7th high to the real high on the 24th. This time the market dropped again for 4 days first, then rallied back up to make "almost" a double top, but failed and had a big "one day" drop on the 17th before it then ran up again into the 24th for the real "higher high" just before the 87 point drop followed.
Looking back even further in time I can see this pattern showing up many times with slight twists to it. Sometimes it did it's first drop for 2-3 days, then back up to a new high and other times it took over a week for the first drop to end. And some of the times there were 2 short drops before the final higher high with the real big drop that followed.
However, there were a few "fake outs" where it appeared that pattern was going to happen but it didn't. The October 30th, 2013 to November 7th was one such fake out. It did another fake out shortly afterwards on November 29th to December 9th, 2013 where each time the expected "big" down move to follow never happened.
The November 7th high was followed by a big bear squeeze for several weeks. The December 9th high did produce a few days of selling but it never dropped big like all the other periods where 80-120 points down usually followed. That drop from the 9th barely took out the first low that hit on the 4th of December.
After the move up first I'd look for about 2060-2070 area to be retested as that was a triple top area before the breakout...
It should last about 2 weeks I'd guess and then back up to start a huge wave 3 rally of some kind. Looking back again at the weekly chart and that rising trendline from the 2011 low of 1074 SPX I would expect it to hold again should they break through that triple top zone. The 20MA on it is at 2042 right now and the 40MA is at 2003... which is resting just about on that rising trendline.
If I had to guess I'd say that 3 weeks from now the trendline should be around 2030-2040, but with February having such a strong rally I'm not sure how far down they will allow the market to drop in March, but if they drop that far it should be over with by the 3rd week and allow a rally to start in the last week to recover most of the down move.
This was a twitter comment I read last week and if it's a "factual" statement then any early down move in March has high odds of being erased by the end of March.
 Chad Gassaway, CMT
 "Since 1950 the SPX has gained >5% in February only 5 times (1970, 1975, 1986, 1991, 1998). Added to gains in March all 5 times."
On an "elliottwave" count I think we are in some type of smaller wave 4 down now, that should complete on Monday or Tuesday. Then a final smaller wave 5 up to about 2130 area to end a larger wave 3 up (that started at the 2042 low). This would then complete a 5 wave pattern up from that 2042 low to an estimated 2130 area high.
Assuming this larger wave 3 up ends up being around 90 points in length it the following larger wave 4 down should be some Fibonacci level of 38.2% or even 50% in depth. If that count is right then it doesn't look too good for the 80-120 points move happening that I'm thinking will occur. So for that reason I do think that this chart from Tony Caldaro will be relabeled should my technical analysis be correct by seeing a back test of the triple top area in the 2060-2070 area (or Tony says it's an "acceptable" pullback to still qualify as a wave 4?)
While I like to read what others have as wave counts using EW I just don't find it very accurate on the short term. The gangsters that run this market don't play by EW rules as we all should know by now. Try to make sense of that straight up rally from the 1972 low in December 2014 to the 2093 high and give me your EW count there? Can't be done in my opinion.
Don't get me wrong, I like Tony and find his posts helpful a lot. But SkyNet (what I call the super computer that manipulates the market) is programmed to steal your money. So it's well aware of bloggers (and traders) that use technical analysis, elliottwave, fib. levels, astrology, T cycles, etc... to predict the future direction.
Which of course mean...
It's going to fool you by letting these charting methods work for awhile and just when you think you've figured it all out SkyNet just pulls a 180 on your wave count (and/or TA's, Fib. Level's, etc...) and has some crazy move out of the blue that no one can see coming. The move up from the 1820 SPX low to the 2079 high is a perfect example.
I read many tweets about it and hear people say that they'd never seen such a move in their 40 years of trading! And other stating that it had never happened before in the past! This should tell you that the more us sheep have access to various charting methods that used too work before the internet the more likely we are to see "Crazy Ivan" type moves happen as SkyNet has to adapt to us sheep figuring out the next move and being on the right side of the trade for once.
Since SkyNet can't steal the sheep's money and give it to the bankster gangsters that programed it the computer is forced to go hard in one direction or the other to hit all the buy and/or sell stops put in place by the sheep. What I'm saying here is that a typical wave 4 down should be around the same length as the wave 2 was (2072 down to 2041 on 2/9), and some smaller Fibonacci level like 23.6% or 38.2% as opposed to 50%-61.8% that I'd need for my thoughts of dropping back to that triple top area.
Regardless of the EW count I'm still leaning toward my forecast of a dip to 2085 area Monday/Tuesday, up to 2130 area and then down to 2060-2070 zone to retest the breakout point that has taken us up to the current new highs. That's my forecast for now and I'm sticking too it! LOL.
Red
P.S. I installed a new commenting system so now you can use Disqus, WordPress, Facebook, or Google Plus to leave your thoughts on the market. I'll set it to default to show the Disqus comments as that's what I've had on the blog since I started it in late 2009. Unfortunately you'll have to click on each of the 4 icons to read (or leave) comments using each of them as it does not combine them all together. There could be some comments under each one so click on all of them to see what's going on... Thanks.


double 11 comin up next week
Perfect amount of time to sell off to 2085 and go up to 2130-2140 area (or just go up without the pullback)
Hit 2085 on ES today…
The 2085 support I was speaking of was on the SPX, not the ES Futures. As for Thursday and Friday there’s a very strong chance that we’ll make a lower low on one of those days then Wednesday’s low.
What date?
Well, that new multi-commenting system has too many bugs in it so I just went back to Disqus for now. I’d like to find some kind of wordpress plugin to offer more then one system but that was on the only one I found and it hadn’t been updated in over 2 years. The search continues…
Although it doesn’t seem like anything will happen, I do have many hits for tomorrow. I see Jupiter is right next to the fullish moon now in the top of the sky, so could that be the trigger now?
Especially now that we are in high Luperci season???
Tomorrow, 3-3-15 is 66 or 12.or 26 The 3 rows of 7 photos at the end of the Shining (Nicholson July 4 1921 photo in the 11th photo) also trasncribes to 3-3-15 if one looks at them vertically ie 3-3-15(3×15). 12-12 also 33. Unfortunately it appears that today was 1212 tds from a certain little event 1762 days ago from tomorrow. Maybe my count is off but I did a cursory double check today.
1-2-3 as well, as some of the Luperci use to count down to SCREAM in a recent tribute cover of BB’s Sabotage in London. Which did take me back to watching some clips of the vintage action caper from the 70s, the Taking of Pelham 123, actually probably one of my top 50 movies of all time, and remade by Unstoppable director Tony Scott back in 2009 before Scott’s unfortunate demise back in August 19, 2012???. Unstoppable train #777, chase train #1206 and the train in To Live and Die in LA, 2626 where the daredevil anti-hero lead likes to jump from the San Vicente bridge.
The Greek situation has not been resolved. No money has been released to them and won’t be until they pass certain measures in parliament.
33 could come up later as well. or 3-2 or 311.
Today looks similar to July 17th, 2014… as I think we’ll repeat that pattern.
do you think we will still go down to 2085 area or have we bottomed and now on way up to 2135
Not sure yet? Looks like a 50/50 chance at this point. If the recent move up to 2117 was a failed wave (that should have gone to 2130-2140) then we should be heading down toward that 2060-2070 triple top area.
But if we rally up Wednesday strongly (like July 18th, 2014) then I’d say we have about a 60-70% chance of taking out the 2119 current high. Considering that we hit that all important 5000 on the Nasdaq just once I get a strong feeling that they will try to hit it again and go higher.
Regardless of if it goes higher slightly or just double tops it should carry the SPX with it… meaning it too should take out 2119, even if only by a few points. As much as I’m a bear at heart I have to think the bulls will make another run higher before allowing a bigger drop.
This DOW Transport chart tells me it’s trying to decide which way it wants to go.
http://stockcharts.com/c-sc/sc?s=%24TRAN&p=D&yr=0&mn=6&dy=0&id=p88516786335&a=367608902&r=47
It’s trapped in the middle of a lot of moving averages providing support from the 20MA and resistance from the 10MA. It’s pierced through the blue support line that makes up the top trendline of the channel it’s been it for many weeks and only recently broke out above it.
If it closes red and below the trendline tomorrow and the SPX closes green then chances of a move up to 2130 area are weakened. I’d like to see it put in several days of “doji” candles to make a nice multi-day bear flag while the SPX rises to the 2130 area.
That would be the best clue that the SPX move wouldn’t be supported by the Transports and therefore it would be highly like to fail up there and not continue in some bigger rally to 2200 or so…. meaning a drop to 2060-2070 would have stronger odds.
I’ll be looking for the Full Stochastic to get overbought on this chart tomorrow…
http://stockcharts.com/public/1092905/chartbook/335493930;
If they get up to the 80 area too quickly tomorrow and don’t close today’s gap down or at least the gap window it would be a sign of weakness for sure. I’d be leaning toward the move down to 2060-2070 happening after that bounce runs out of juice by midday or soon.
The Russell chart tells a different story it seems…
http://stockcharts.com/public/1092905/chartbook/244764519;
Notice how all the prior peaks rarely produced a slightly higher high within a few days of the first high? In most cases they just came up and put in a lower high and then started the bigger move down.
On that chart you’ll see only the 1221.44 high as being the “higher high” then a prior top just a few days before it (hard too see). The 1008, 1063, 1182, 1212, 1213, and now the 1243 highs stand all by themselves.
The 1183 high in September appears to have been a “higher high” then a prior one, but it was probably 2 weeks prior it and doesn’t fall into the same pattern as I explain in my video on the SPX and prior highs getting taken out within a few days.
So if the SPX shows weakness then the Russell should look even weaker. Therefore I’d look to short the IWM instead of the SPY if Wednesday turns out to be another weak day for the market.
ES Update: http://screencast.com/t/WMu6D9JU
Gold chart analysis: http://niftychartsandpatterns.blogspot.in/2015/03/gold-nearing-weekly-lows.html
SPX Update: http://screencast.com/t/I5Qm6SuBgy
ES Update: http://screencast.com/t/5HQeyOCx5x
We are at good support here. I wouldn’t be surprised if we don’t put in the low within the first hour or so and then rally into the close.
This is the chart I posted yesterday on the ES: http://screencast.com/t/5HQeyOCx5x I think we are in the “HOWEVER” statement.
Rally up tomorrow for 11 day?
Rally should start very soon… so “yes” it very likely to continue into Wednesday and top Thursday. Or it screams today and tops at the close? If we close green up near 2090 or so then I’d guess we will exhaust the move up and go back down Wednesday and Thursday. Let’s first see the rally start before I predict the end of it.
The way the market is acting and the fact that it’s down over 27 points on the SPX it might not start the rally until the last hour of the day? However, regardless of how high the rally goes today’s light trading volume so NO sign of “capitulation” on the downside yet. This implies a lower low is coming after any rally they get going.
While I don’t really see 2090 area being hit as it so far away now you just don’t know how many bears there are to squeeze? It’s really just about the “stops” overhead on how far they go up.
The bulls are very surprising and some how seem to go up higher then anyone can believe. But it happened before on that chart I posted so I won’t rule it out for happening again.
As of now there is a lot of damage done on a technical bases for the bulls so thinking there’s going to be a rally here could be just wishful thinking I guess. Until we see a higher low on the SPY (IWM currently still has one) I don’t see the bottom yet for today.
Let’s see what happens in that last hour of the day as we might start the rally then and carry it into Wednesday for a top, with a Thursday dump for a lower low then today.
Crude oil chart analysis: http://niftychartsandpatterns.blogspot.in/2015/03/crude-oil-testing-support-zone.html
At this point I doubt we’ll see much more then a 10 point or so rally before another drop into a Thursday/Friday.
Red, your 3/1 post nailed it …. NICE!
I could see us drifting lower to 1990 on $SPX
Off a little on the targets but it did follow the plan and pattern I was implying I think.
Dollar index on a historic bullish streak. https://twitter.com/WildcatTrader/status/575343415652548608
I guess Lindsey Williams’ new source has just been misleading him so we sheep would be caught shorting the dollar. Good that I don’t play it… LOL
“The dollar is going to rise and rise and rise, and then die suddenly.” – Jim Willie
Dollar to be devalued, militarized police, vaccines to deliver patented bioweapons
(A 43-minute interview repeated several times for some unknown reason)
https://www.youtube.com/watch?v=3myk0L8f4Vc
At about 31 minutes into he talks about the children of Sandy Hook that were most likely given to the elite as food sacrifice’s in their crazy rituals! He’s problem dead on right there! … and the fact that the school was closed for months prior to the event doesn’t surprise me as it’s clearly another staged “false flag” event in my opinion.
closed in 2008, a stage in 2012 http://www.veteranstoday.com/2014/04/15/sandy-hook-elementary-school-closed-in-2008-a-stage-in-2012/
… still wonder about the involvement of crisis actors.
Actors everywhere I think… Sandy Hook, Columbine, Batman Theater, Beheadings in the middle-east, etc…
It’s natural to expect a “pause” day here so we could chop like this all day. If we do get a rally going then I’d expect a peak in the noon to 2pm (EST) time period between 10-15 points higher. There’s a falling trendline of resistance that will likely hold the market back. It will be around 206.30 area SPY in that time zone.
If we don’t hit it today and instead just drop more then we might hit it Thursday morning on some fakeout bull move up. Hard too predict what SkyNet is going to do here. But tomorrow or Friday should put in the low for the week.
I’m looking for a quick move down Thursday morning to put in the low where I think the next move will be up strongly. I’d exit all shorts by today or in the morning tomorrow as the bulls are about ready to wake up.
SPY Chart analysis: http://niftychartsandpatterns.blogspot.in/2015/03/spy-analysis-before-opening-bell_12.html
SPY Update: http://screencast.com/t/x6IEV352z
We could chop around again today between 2 trendlines and then breakout Friday.
Any idea how much of a breakout?
SPX Update: http://screencast.com/t/526HK4u2a
The SPX and SPY have broken through the falling trendline of resistance now. This means it’s highly likely that the low was put in yesterday and the best we could expect to see is a small move down later today to backtest this trendline (which will be at a lower level as it’s falling) somewhere around the 206.00 SPY zone (depending on when (and “if”) it hits it.
If this happens then what we have likely seen today with the gap up open is some kind of wave 1 up with this forecasted small pullback later today to be the wave 2 down. This implies we’ll see a big squeeze up Friday for the wave 3 up.
Of course this wave 2 down could have simply been the sideways chop we had earlier before the break of the trendline and we could see the wave 3 starting now? Hard too say for sure but regardless I’m expecting a move up toward 2090 or more on the SPX into next week.
Charts tell me this is just a bounce and not a new strong rally that will make a new “higher high” like all the previous rallies in the last 3 months that came off their lows strong and all made higher highs. I suspect this one will be different and will only make a lower high before dropping lower sometime next week and heading below the recent 2040 area low yesterday.
Of course charts can be manipulated…
i am looking for 2020
My only concern on making bearish forecasts using TA’s is that the Fed’s have a history of manipulating the market to the bullish side. So the upside to 2090 area seems highly likely but the selloff back down isn’t something I put too much money on as they rarely give the bears a chance to win.
The moves down no long come in nice ABC wave patterns but simply drop all in one big wave while the bears sleep. Once they awake and look for the B wave rally to short they find it never comes as the Fed’s manipulate it to a new higher high.
Happy Friday the 13th (39) conjunct the Pluto Uranus square tomorrow. 1816 weeks from the release of Kubrick’s grand ritual classic, the Shining or 34 (3-13??)years 9 months 18 days ago (799). They moved the Moby Dick flick off its original 3-13 release date.
Looking hopefully for a certain little indicator to drop below its 50 day average tomorrow and will go below its lower BB if it does so. That would make for an UBER bearish sell signal. Today seems to have been a technical bounce off the lower BB for the stock indices. $ndx finally got to its lower BB yesterday.
Notice the action in the euro lately sans today.
3-15==18 and #18, Popgun, has a birthday coming up.
I’m a little surprised they allowed the bearish setup work. If the low from Wednesday is taken out then I’ll have to redo the estimated upside target for next week. So far we are still just making a higher low (or double bottom). And since it’s now in the noon time period with Europe closing we should see the selling pressure let up. Let’s see if we get a bounce started…
One thing for sure..that was a very quick “give back” of yesterdays 250 pt rally. The triple digit “down” days have mostly been larger than the triple digit “up” days the last week. Case in point last Friday was down 300 pts..and last Tues was down almost 340 pts….so we working lower here so far. As far as how we close today..the jury is out but I think it’s safe to say we could easily close down another 300+ pts today.- Perma bulls will want to see SPX 2040 hold like concrete thru next week.
Just riding a trendline of support now… if it breaks then it could get ugly!
As much as I think we should be going up into this Wednesday’s FOMC meeting the chart suggest a short here today. Several trendlines of resistance are currently being hit here at the open. Failure to get over them with a gap open usually leads to a market rolling over and pulling back. Possibly we go down today from the open and turn back up Tuesday and into Wednesday?
SPX Update: http://screencast.com/t/thKNg5coV
Ok, yesterday we hit the upper falling trendline that I suggested we’d hit in the chart I posted. I then thought we’d go down to the area we are at now. So at this point I think we’ll find our low by noon today and then go back up into tomorrow.
While I’m not expecting another big move up I am expecting very little selling with an upward bias until after the FOMC minutes are release at 2pm Wednesday. Since I’m not expecting them to say anything to scare the market I’m also not expecting any big move to immediately follow.
History tells us that 80-90% of the FOMC days close day near the highs for that day. Then 1-2 days later we usually see a turn back down. The charts could be nice and overbought by then and if allowed to work then we could have another down Friday this week too? Don’t know yet but as for right now I’m expecting a bottom very soon here and a move up into Wednesday.
Historically we all know that most FOMC days close positive and near the high for the day. So will this time be different? I don’t know the answer there but even if we do close up I’m just not believing that we are going to continue up toward new highs the rest of this week and into next week.
The monthly and weekly charts don’t look the same as they did during the previous rallies. They are currently much more bearish looking and I don’t get the feeling we have much more left on the upside. Possibly we do rally into the close today from whatever the Fed’s say at 2pm but I don’t see the rest of the week and some big continuation squeeze up.
In fact I wouldn’t be surprised if we don’t stay under the falling trendline of resistance I’ve shown several times that’s currently in the 2082 area on the SPX. If we hit it into the close today (or even Thursday morning) I’m going to become bearish again and look to short it.
These trendlines of resistance are usually broken with some type of news prior to the market open so they can just gap over the level as opposed to attempting to pierce through them. Since I don’t see much more “market moving news” this week (the Jobless Claims Thursday at 8:30am doesn’t pull much weight anymore it seems) the current FOMC minutes being released today at 2pm should give the market the biggest adrenaline shot.
Once it wears off (probably by the close) you have ask yourself what’s going to spark a further rally on Thursday or Friday? If the market was oversold then that might be a reason but the market is neutral to becoming overbought on the short term and very overbought on the monthly and weekly charts.
Then there’s “What would SkyNet do?” (not to be confused with “what would Seth Godin do”… LOL). I think too many people here are expecting another blowoff rally to happen just like how the last 3 months produced those insane moves up with no decent pullbacks to ride the bulls’ back.
As we all remember those crazy moves up they were relentless without any compassion to let a trapped bear out or a want-a-bee bull in. This current rally feels (and looks) different. There’s no energy in it. The volume levels are ridiculously low, which should tell you that the big institutions aren’t buying much stock at these levels.
So I’m going with a short should the SPX go up and hit this falling trendline around 2082 currently. I see nothing tomorrow to spark a further rally. Any move up today into that zone should exhaust the bulls and leave them open for a move down to start on Thursday. This all assumes there’s nothing major said at the FOMC meeting today.
http://screencast.com/t/dBUH4gR7
wow over 2100
Yeah… obviously I didn’t go short after I seen it blow through that 2082 area like hot butter! At this point I’m just waiting to see what the end of the day does. It might go a little higher Thursday morning too? Hard too say right now? A double top seems like the plan of action but they still might back down for a day or so before blasting through?
Well a day like today would be expected to clear out the shorts before a big move down and I have a LOT of hits for tomorrow 3-19. The Greek stock market was down 4% and approaching its recent lows despite today’s hoopla in the US markets.
3-19 will be the last time we’ll see a 22 for the year or a Fahrenheit 4-15 or 46 (Tebow 316—3-19 will be 3years2monts11(511) days from his big 316 playoff game against the Steelers. Plus, we know they love their #19s especially in conjunction with moments of denouement. Especially on the eve of a solar eclipse on the vernal equinox with a Pluto Uranus square in hand.
3-19 also 3-10 or 13 or even Kubrick’s 1921 Photo from the Shining.
Tomorrow is also 1519 tds from the 3-6-9 low or 6years 13 days (64) ago. So So much more numerology but let’s see how things materialize.
It looks like they finally did some stop clearing in the euro as well.
Based on the power of the move up yesterday most of the bearish charts are now negated. The monthly is still bearish but it’s such a long time frame that we could still go up the rest of the month and it not move much at all. They are turning the weekly back up and daily.
So while I’m expecting them to pull back today I do expect this to only be a “pullback” and nothing more. Probably by the noon time period I’d guess they will turn them back up into Friday. Next week should also be bullish as well, but it’s possible they chop around for awhile before they pierce through the formal highs.
However, considering that the Russell already made a new high yesterday I don’t think it will take too long for the S&P500 and the Nasdaq to breakout to new highs. Once again it seems the Fed’s save the day and stop another big drop. It certainly makes you wonder what level we’d be at without them manipulating the market?
But it will all come to a horrible ending for the bulls when the final top it put in during the 3rd or 4th quarter of 2016, followed by a 1929 style crash in 2017. It’s been planned for many many years and it’s still set for that time period as of now. But until we get there we’ll have to just play the bull side 80% of the time and the bear side the other 20% of the time.
So I’ll be looking for a long today as the short couldn’t be took since we are going to gap down at the open. Typical move where you have to go short the day before and exit in the opening first few hours.
Downside support is around 2075 on the ES Futures and 2080 on the SPX. Should we get down there today I see it as a buy into Friday and next week with the next move up likely being the one that pierces through prior resistance and makes another new high.
Tomorrow 3-20 is the possible infamous 2012???? 32 ie 33 or 23. The recent history of Fridays immediately following a new moon have been harrowing experiences as was the case 2 years 8 months ago or one 21 weeks later. Since its a new moon/solar eclipse on the vernal equinox could it be the dawning of the Age of Aquarius???
I know they like using the 12 as a 5 or half so that 2012 also works as 25 (55). But we still might have to wait for a Taco Tuesday.
I know Willem Dafoe likes to play with 3 20 dollar bills in To Live and Die in LA.
Friday is “super moon” day occurring on the same day as the equinox and a solar eclipse. Add up the celestial events and then consider that Tuesday the market put in another Hindenburg Omen. That makes 3 confirmed Hindi’s since December. That’s fairly odd too. Add in some of the short term cycle indicators like the Fibonacci turn cluster, and you can hear the twilight zone music in the background.
Could it get stranger? It can and it does. Friday is also quadruple witching day for options and futures. It’s also the first day of the Hebrew calendar. I find it fitting that the world is bickering over the word patience, during the very week all this “extraneous” stuff is going on.
Hmmm… not sure what to think about those Hindenburg Omen’s. Tomorrow “should” go up as the Russell has already made a new high, the Nasdaq is at a double top and ready to make a new high and the the S&P500 and the Dow are the only lagers.
With the ES banging on the double (or triple?) top right now it looks destined to breakout… and I’d expect it to happen today! The SPX is lagging behind still but the Russell and Nasdaq already have new highs. The DOW is coming in 4th place but I suspect it will finish the race too. LOL!
Hmmm some fractal similateries to historical topping patterns most recently to 3 years 7+ months ago as well as one ($ndx, $rut) from double7years 5 months ago. It looks like it’s going to be the ultimate Bradley date.
When is the next Bradley turn date Geccko?
May 10
http://bradleysiderograph.com/2015-turn-dates-sp500/
http://bradleysiderograph.com/overview-of-the-bradley-turn-dates/
1987 NCAA champ Indiana eliminated from the tourney in the first round today. Star guard on that Indiana team Steve Alford, now UCLA coach, leads his team to a victory led by his son’s hot shooting (8 3pointers). 1987 Final Four particpant Rick Pitino sees his Louisville team squeak by UC Irvine. 1987 Finalist ,Syracuse coach, Jim Boeheim, goes on a tirade against the NCAA after his team is sanctioned for violations. The other 1987 Final Four coach, Jerry Tarkanian (UNLV) passed away in January. I am wating for a Bobby Knight ritual.
More later on the Duke (Kentucky) /Christian Laettner (#32) ritual that the sports media is currently going overboard on.
SPY Weekend update: http://niftychartsandpatterns.blogspot.in/2015/03/spy-weekend-update_21.html
Befuddling the pundits and basketball intelligentsia, UCLA moves on to the Sweet 16 led once again by 1987 College Player of the Year Steve Alford’s son, who I believe ended up with 19 points. (Remember #19 scored the World Cup winning goal for the Germans last year).
The pundits (reading their cue cards) universally admonished the selection committee for placing UCLA in the tournament (which never made sense). UCLA received the #11 seed so let’s see if they end up as the “dark” horse of the tournament. Haven’t bothered to see who they play next.
Parker led UCLA in scoring with 28pts. UCLA could potentially play Iowa next round which would be one of Alford’s former teams. I know Iowa is the 29th state. But Gonzaga (Iowa’s opponent) seems too strong this year.
Did see them flash 11-10s and 14 5s in the game as well as the ultimate Bradley date with a 0 added.
Based on what I see in the charts I think we could squeek a little higher today at some point even though we might drift down a little in the morning (not worth playing as early downside seems small). But after another move up we should be hitting the rising trendline on the Nasdaq and the Russell, which is where I’d expect a pullback on all the ETF’s.
Since it’s a rising trendline I don’t have a target as it moves with time. But on the IWM I’d guess it’s in the 126.50-127.00 zone… so not much. On the Nasdaq it appears to be in the 5050-5075 range. On the SPY and SPX I’d guess it’s around the double top area. Possibly we chop all day today and pop up to hit those levels on Tuesday and then do our pullback? I’m not expecting anything big, maybe 20 points on the SPX? Hard too know right now.
Popgun’s 39th birthday tomorrow.
Iowa lost to Gonzaga so no funky Iowa-UCLA matchup.
Divergences on all time frames today from 60mins down for RSIs.
The market is looking tired here. We could see it rollover today at some point. On the downside I’d look for the 209 area to be support on the SPY. There’s a rising trendline of support coming in around 208.75 which also is the gap fill area as well. That should be a magnet to the market if we rollover today.
I’d look for a small downward sloping trendline to be hit on the upside for the best shorting spot. Right now it’s coming in around 210.50 SPY and about 2108-2109 SPX (depending on when it’s hit). It might not hit until later though… maybe before noon?
With the light volume expected to continue today this suggests that we could chop around early in the day before we hit that falling trendline and then rollover. This move down though shouldn’t be much to get excited about as I’m sure next week they will make another run up to make news highs again on all the indexes.
Well, got up to 2107.63 SPX (210.40 SPY) before rolling over and dropping to the 208.74 SPY low… not a bad guess.
I see a nice MA pattern in the SPY, SPX, etc…, which is bearish. But with the extremely light volume I think I’ll pass on shorting today.
Stinks that I didn’t take a short on this down move. But now I’ll be looking for a long after one more down move… probably next Monday?
Red, Monday/Tuesday AM should close to near 2040 then up to 2075-80 before Blood Moon then we head down until mid May to see 1930ish.
Makes sense Scott. I see another push down too (a wave 5 of some kind) to end this first larger sell off from the recent high. Then a few days of rallying into later in the week. I’m not sure if they are going to roll back over and make another move down to below 2000 or not?
I will say that the monthly and weekly charts are both bearish and do support another larger drop. But you and I know how manipulated this market is to the bullsh@t side… LOL! So I’ll just take it one day at a time. First a short to 2040 area and then a long for a rally up to somewhere. After that… I don’t know?
Interesting thoughts.
Certainly, if we see some early Monday gains into the sp’2070s, I’ll be tempted to launch a short-term short… with a target of 2040.
Anyway…. have a good weekend
Yeah… if we rally up on Monday then I’d expect a peak on “Turn-around-Tuesday” where I’d look to short.
CRUDE Oil Weekend update: http://niftychartsandpatterns.blogspot.com/2015/03/crude-oil-weekend-update_28.html
Biofuel policies reduce CO2 emissions by starving the poor. http://www.eurekalert.org/pub_releases/2015-03/pu-dbp032715.php
“The impacts on food consumption result not from a tailored tax on
excess consumption but from broad global price increases that will
disproportionately affect some of the world’s poor”
I read somewhere (about 3-4 years ago I think?) that the poor could be feed world wide for something like only $400 Billion per year. Of course we know they are still putting into the market probably $50-$100 Billion per month secretly and the EU of course has their QE program still going… so feeding the poor would be easy to do. But if they did that how could they keep them working as their slaves? So you know they will continue to make sure the poor stay poor… and hungry!
facebook got me here! haha
https://www.facebook.com/reddragon.leo
Facebook isn’t posting my disqus comments anymore it seems. When I make a comment here I click on the share button and repost it on twitter and then I try to repost it on facebook. But with facebook you have to copy your comment as it doesn’t auto-fill like with twitter… and you have to fill out a stupid captcha now! WTF?
I was doing all of that up until last week when friend told me that I had not posted anything new on facebook for many weeks and I told him I was reposting these comments there everyday, going through all the stupid hoops and everything. But apparently they still weren’t being posted? So I just stopped reposting on facebook about a week ago now it was working. But I still do the twitter reposting.
Anywyay… how’s life my old friend?
i’m back to calling market top pullbacks, (we got us some volatility, finally), with pin point accuracy, past 1.4 years…makes trading a lot easier ….I’ll come by and leave the link, at the next pullback, if i see the signal…..still a lot of artistic license involved, so —oh well, same as it ever was….
SPY Update: http://screencast.com/t/95f8lgLa
ES Update: http://screencast.com/t/DkVToTEr6
Give me a gap up Tuesday and I’d short this pig as fast as you can say oink oink! LOL
I just wonder how they drilled the hole in the middle up from the stairs to the top? http://reddragonleo.com/wp-content/uploads/best-zombie-apocalypse-fortress-ever.jpg
The market looks to me like it’s going to chop around the rest of this week not making much traction on the upside or downside. Possibly they get it up to 2080-2090 SPX area by Thursday’s close but I wouldn’t be surprised if we don’t drop to 2060 at some point before bouncing back up.
I just don’t see a clear direction either way as the charts are all mixed, which is why I think we’ll be in a zone from 2060-2090 the rest of this week. The BIG concerns is the Non-Farm Payroll report being released on Friday at 8:30am when the market is closed. I remember several years back when they had a holiday weekend and pulled that Dubai trick.
I think that was Thanksgiving if I recall? The market was closed on Thursday and only open for half the day on Friday. Traders all left for the 4 day weekend and that Friday they announced the Dubai news (been so long I forgot what it was… a possible default I think?). The market tanked hard in the futures from the news but by the time they reopened on Monday it was barely down.
We could see a similar plan here with them possibly releasing bad news with the NFP report this Friday when every trader is gone for the 3 day weekend. Then they’d have all weekend to have their paid puppet actors spin the news as “not so bad” with their propaganda TV mind control weapon.
So we could see them save the market Monday as they get the charts very oversold during that 3 day period but hold the actual price level up. That means Monday it could be down just 10 or 20 points instead of 50 or 100 points.
Hard too know the plan here but currently the charts are lining up bearish going into next week. We all know how they manipulate them but possibly they won’t be able to juice the market up to all time new highs this time and can only keep the fall to a minimum?
I get the feeling that this will be the time that we finally break the rising trendline of support on the weekly chart starting back in 2011. We broke it once back in Sept/Oct of 2014 intra-week but recovered by that Friday to close on the line and leave a nice long bottoming tail. But the market looks like it’s really struggling to hold that line currently.
The monthly chart is very tired too I think and doesn’t look like it can help save the weekly chart this time around as it’s actually slightly negative on it’s Histogram bars (-0.93) whereas it was still in positive territory last year. Even-though we are starting a new month this April there is still some downward pressure on the market being applied from the monthly chart.
That, along with the weak (and negative histogram bars) on the weekly chart tells me we might just see it give up that rising trendline of support it’s rode on since 2011. This would be bearish at first but later it would allow the market to rally up and backtest that broken trendline months into the futures.
http://stockcharts.com/public/1092905/chartbook/312846787
Went deeper then I thought they’d allow it to go this week. At this point we should have a bounce sometime today and then one more move lower to the 2020 area before we start a rally back up toward 2100 area. We are at a triple bottom now which “they” say triple tops and bottom rarely hold and almost always get broken.
My big concern now is that weekly rising trendline from 2011, which will be broken if they go down into Thursday and don’t start that up move from say 2020 area toward 2100. I actually think now that’s the plan… to hit that bottom area later today or Thursday morning and then rip higher the rest of the day to save the weekly trendline.
If I were SkyNet I’d gap up tomorrow, go back down to make a lower low, then rip it back up the rest of the day.
everyone bearish because of the blood moon as bad omen. The FED always make fools of us. I won’t be surprised a bit we move higher from Thu and into next week to see 2100. Hell we may see us hit all time high. for that reason i went long the SPX.
Tough call… but I still see a lower low tomorrow at some point. From there I’d expect a rally to squeeze out some bears. How high… don’t know? But if they don’t breakout to a new high next week then we are likely going to break that rising trendline on the weekly chart, and that should lead to a surprise sell off during a very bullish month of April.
so far sooooooooooooo good! Let’s see if we close above 2090 then we move to 2100 is a heart beat.
Should happen today if we are to drop into Thurs/Fri…
I see no clear direction in the market. Bulls should have broken out today, but they haven’t. That’s bearish going into next week.