
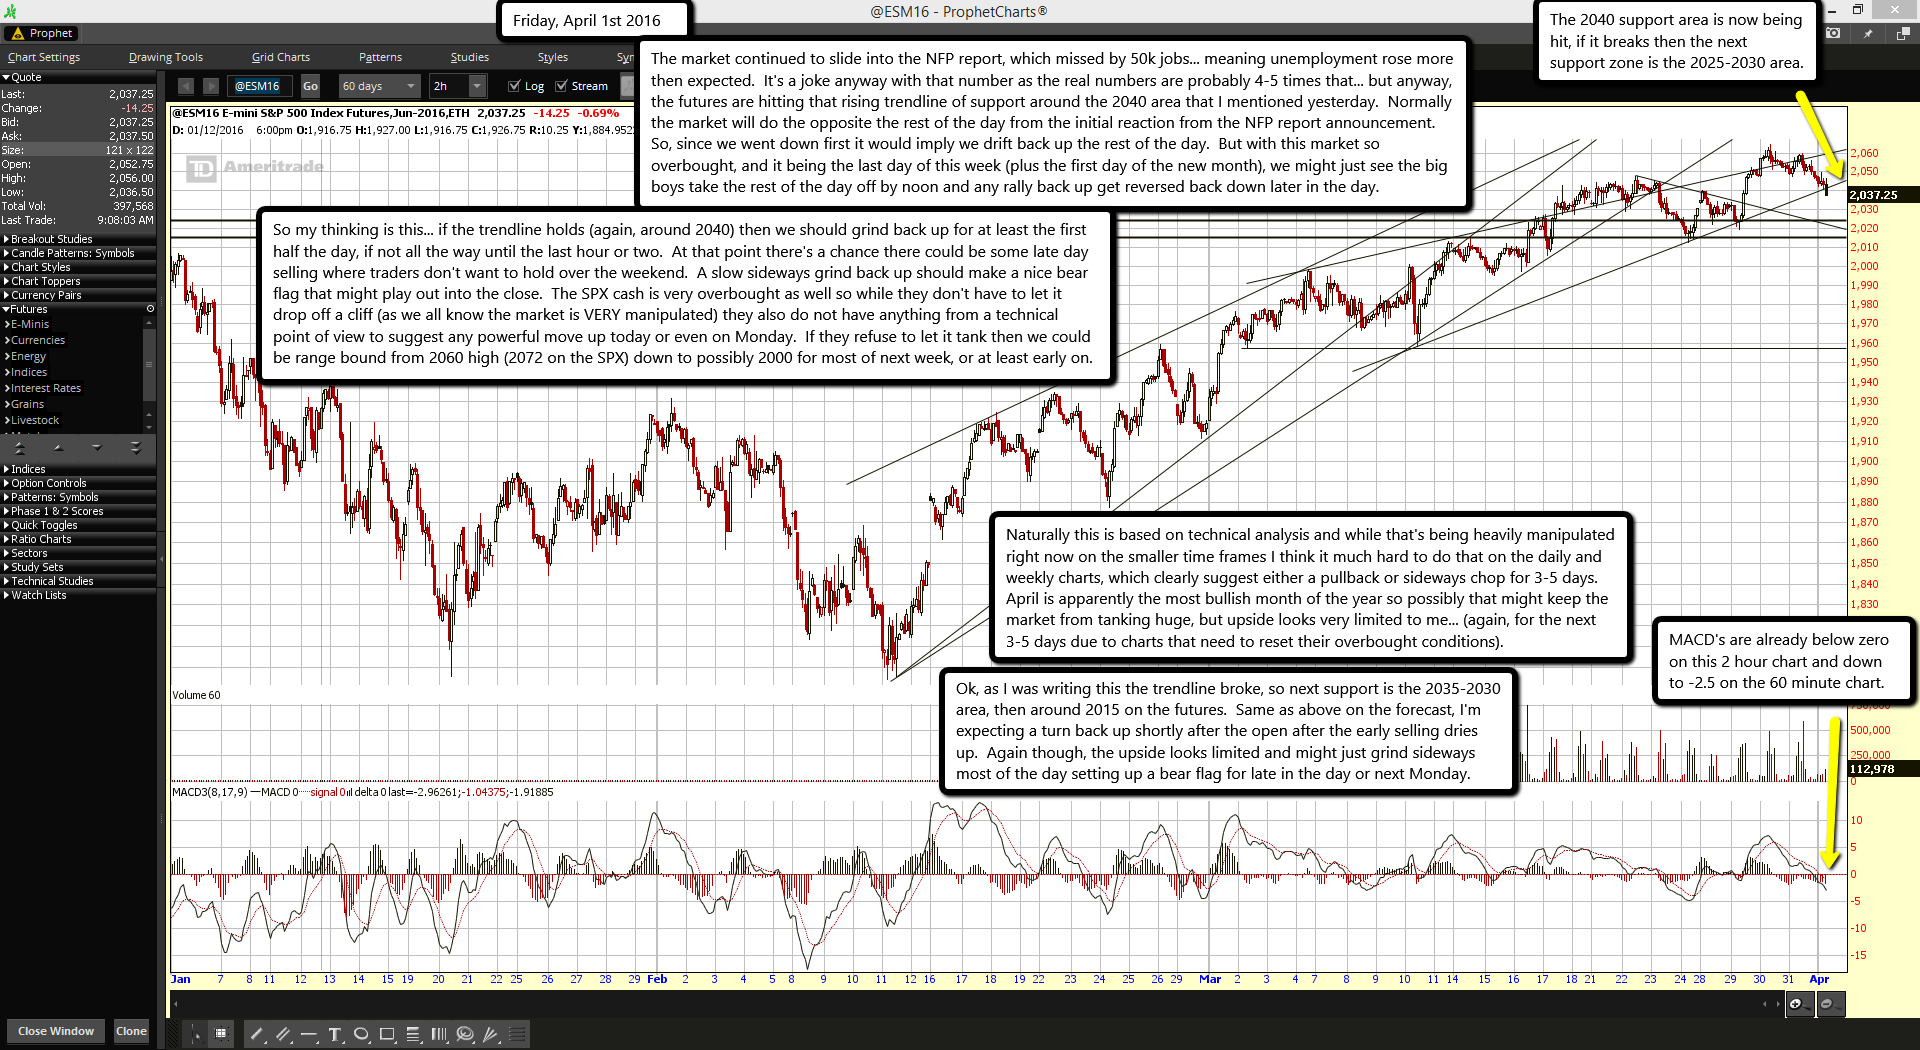
The 2040 support area is now being hit, if it breaks then the next support zone is the 2025-2030 area.
MACD's are already below zero on this 2 hour chart and down to -2.5 on the 60 minute chart.
The market continued to slide into the NFP report, which missed by 50k jobs... meaning unemployment rose more then expected. It's a joke anyway with that number as the real numbers are probably 4-5 times that... but anyway, the futures are hitting that rising trendline of support around the 2040 area that I mentioned yesterday. Normally the market will do the opposite the rest of the day from the initial reaction from the NFP report announcement. So, since we went down first it would imply we drift back up the rest of the day. But with this market so overbought, and it being the last day of this week (plus the first day of the new month), we might just see the big boys take the rest of the day off by noon and any rally back up get reversed back down later in the day.
So my thinking is this... if the trendline holds (again, around 2040) then we should grind back up for at least the first half the day, if not all the way until the last hour or two. At that point there's a chance there could be some late day selling where traders don't want to hold over the weekend. A slow sideways grind back up should make a nice bear flag that might play out into the close. The SPX cash is very overbought as well so while they don't have to let it drop off a cliff (as we all know the market is VERY manipulated) they also do not have anything from a technical point of view to suggest any powerful move up today or even on Monday. If they refuse to let it tank then we could be range bound from 2060 high (2072 on the SPX) down to possibly 2000 for most of next week, or at least early on.
Naturally this is based on technical analysis and while that's being heavily manipulated right now on the smaller time frames I think it much hard to do that on the daily and weekly charts, which clearly suggest either a pullback or sideways chop for 3-5 days. April is apparently the most bullish month of the year so possibly that might keep the market from tanking huge, but upside looks very limited to me... (again, for the next 3-5 days due to charts that need to reset their overbought conditions).
Ok, as I was writing this the trendline broke, so next support is the 2035-2030 area, then around 2015 on the futures. Same as above on the forecast, I'm expecting a turn back up shortly after the open after the early selling dries up. Again though, the upside looks limited and might just grind sideways most of the day setting up a bear flag for late in the day or next Monday.

