
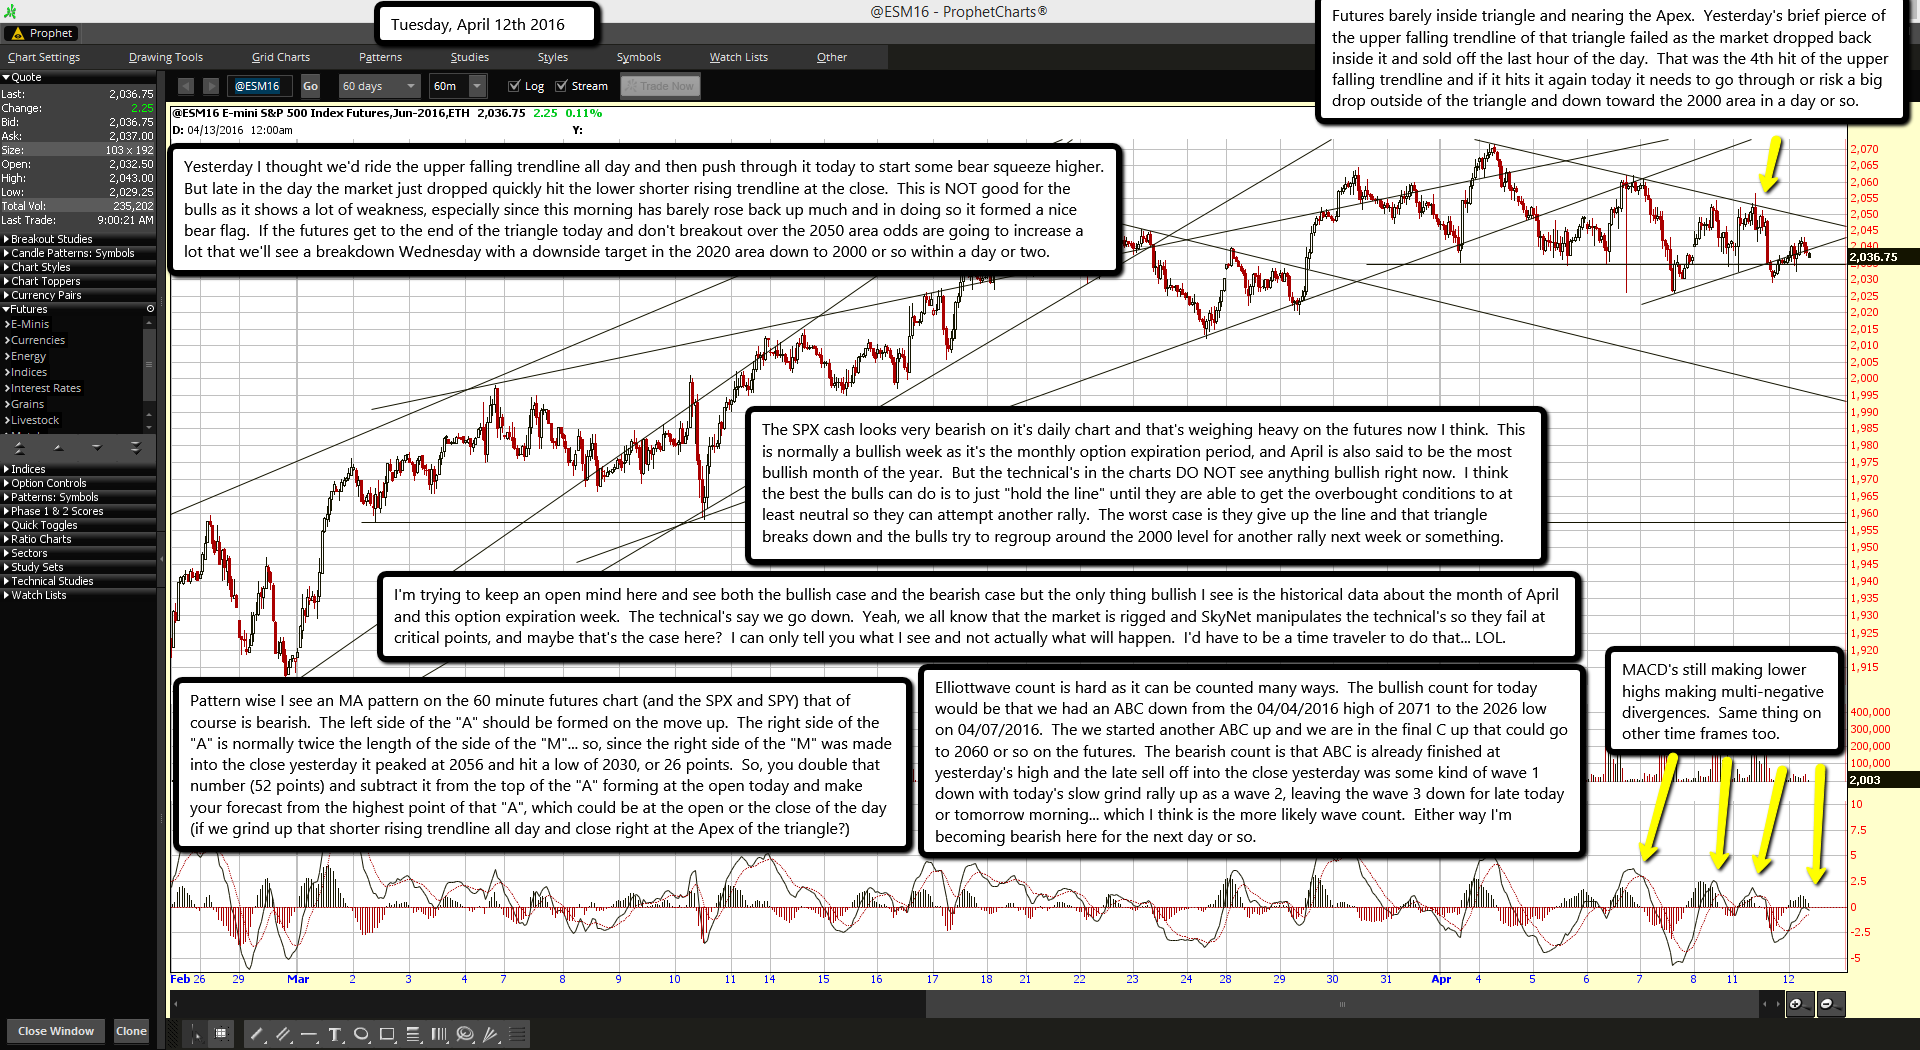
Futures barely inside triangle and nearing the Apex. Yesterday's brief pierce of the upper falling trendline of that triangle failed as the market dropped back inside it and sold off the last hour of the day. That was the 4th hit of the upper falling trendline and if it hits it again today it needs to go through or risk a big drop outside of the triangle and down toward the 2000 area in a day or so.
MACD's still making lower highs making multi-negative divergences. Same thing on other time frames too.
Yesterday I thought we'd ride the upper falling trendline all day and then push through it today to start some bear squeeze higher. But late in the day the market just dropped quickly hit the lower shorter rising trendline at the close. This is NOT good for the bulls as it shows a lot of weakness, especially since this morning has barely rose back up much and in doing so it formed a nice bear flag. If the futures get to the end of the triangle today and don't breakout over the 2050 area odds are going to increase a lot that we'll see a breakdown Wednesday with a downside target in the 2020 area down to 2000 or so within a day or two.
The SPX cash looks very bearish on it's daily chart and that's weighing heavy on the futures now I think. This is normally a bullish week as it's the monthly option expiration period, and April is also said to be the most bullish month of the year. But the technical's in the charts DO NOT see anything bullish right now. I think the best the bulls can do is to just "hold the line" until they are able to get the overbought conditions to at least neutral so they can attempt another rally. The worst case is they give up the line and that triangle breaks down and the bulls try to regroup around the 2000 level for another rally next week or something.
I'm trying to keep an open mind here and see both the bullish case and the bearish case but the only thing bullish I see is the historical data about the month of April and this option expiration week. The technical's say we go down. Yeah, we all know that the market is rigged and SkyNet manipulates the technical's so they fail at critical points, and maybe that's the case here? I can only tell you what I see and not actually what will happen. I'd have to be a time traveler to do that... LOL.
Pattern wise I see an MA pattern on the 60 minute futures chart (and the SPX and SPY) that of course is bearish. The left side of the "A" should be formed on the move up. The right side of the "A" is normally twice the length of the side of the "M"... so, since the right side of the "M" was made into the close yesterday it peaked at 2056 and hit a low of 2030, or 26 points. So, you double that number (52 points) and subtract it from the top of the "A" forming at the open today and make your forecast from the highest point of that "A", which could be at the open or the close of the day (if we grind up that shorter rising trendline all day and close right at the Apex of the triangle?)
Elliottwave count is hard as it can be counted many ways. The bullish count for today would be that we had an ABC down from the 04/04/2016 high of 2071 to the 2026 low on 04/07/2016. The we started another ABC up and we are in the final C up that could go to 2060 or so on the futures. The bearish count is that ABC is already finished at yesterday's high and the late sell off into the close yesterday was some kind of wave 1 down with today's slow grind rally up as a wave 2, leaving the wave 3 down for late today or tomorrow morning... which I think is the more likely wave count. Either way I'm becoming bearish here for the next day or so.

