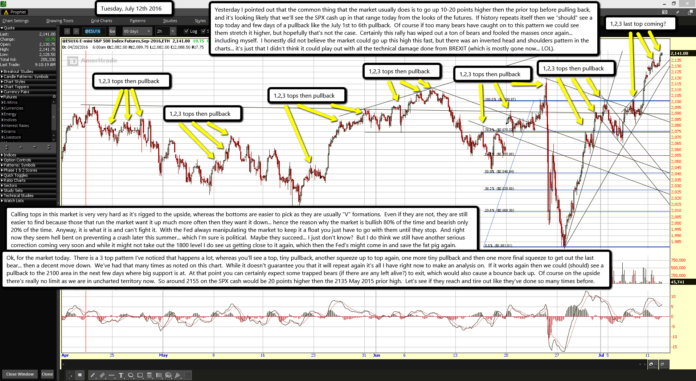
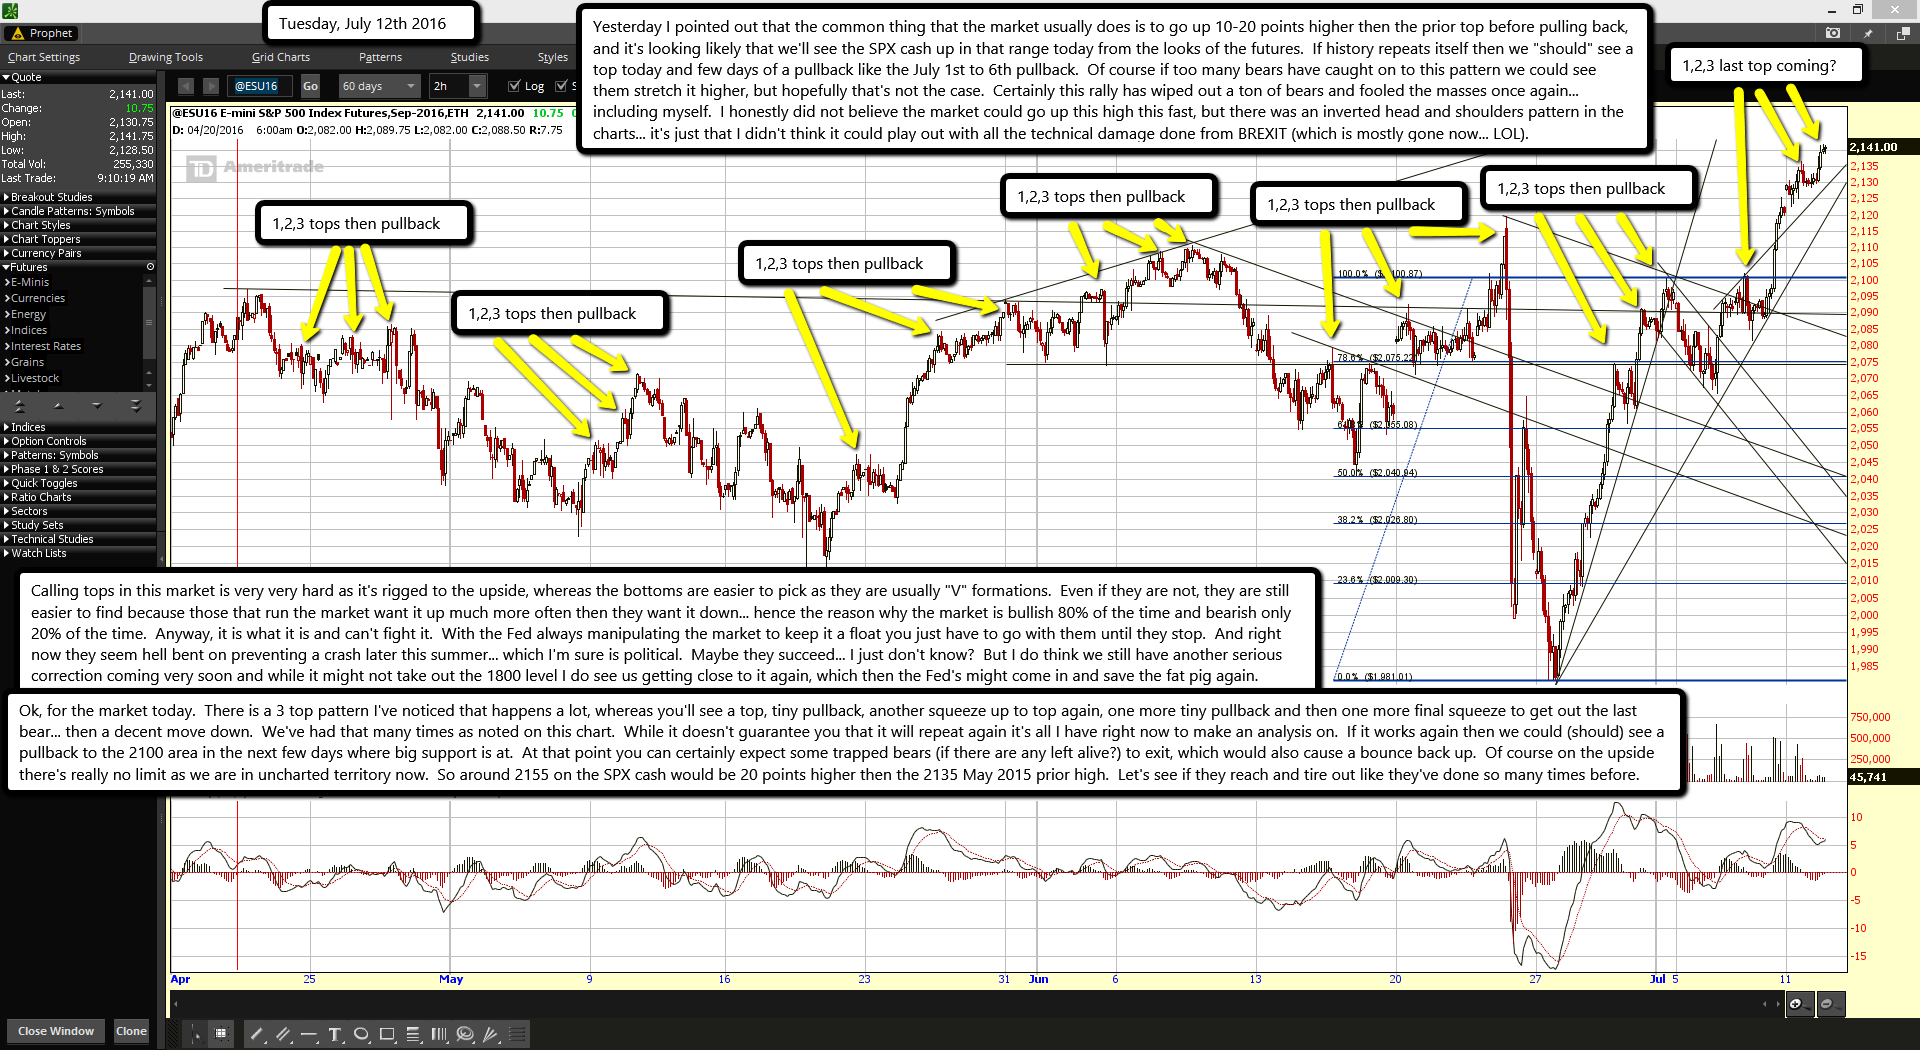
1,2,3 tops then pullback
Yesterday I pointed out that the common thing that the market usually does is to go up 10-20 points higher then the prior top before pulling back, and it's looking likely that we'll see the SPX cash up in that range today from the looks of the futures. If history repeats itself then we "should" see a top today and few days of a pullback like the July 1st to 6th pullback. Of course if too many bears have caught on to this pattern we could see them stretch it higher, but hopefully that's not the case. Certainly this rally has wiped out a ton of bears and fooled the masses once again... including myself. I honestly did not believe the market could go up this high this fast, but there was an inverted head and shoulders pattern in the charts... it's just that I didn't think it could play out with all the technical damage done from BREXIT (which is mostly gone now... LOL).
Calling tops in this market is very very hard as it's rigged to the upside, whereas the bottoms are easier to pick as they are usually "V" formations. Even if they are not, they are still easier to find because those that run the market want it up much more often then they want it down... hence the reason why the market is bullish 80% of the time and bearish only 20% of the time. Anyway, it is what it is and can't fight it. With the Fed always manipulating the market to keep it a float you just have to go with them until they stop. And right now they seem hell bent on preventing a crash later this summer... which I'm sure is political. Maybe they succeed... I just don't know? But I do think we still have another serious correction coming very soon and while it might not take out the 1800 level I do see us getting close to it again, which then the Fed's might come in and save the fat pig again.
Ok, for the market today. There is a 3 top pattern I've noticed that happens a lot, whereas you'll see a top, tiny pullback, another squeeze up to top again, one more tiny pullback and then one more final squeeze to get out the last bear... then a decent move down. We've had that many times as noted on this chart. While it doesn't guarantee you that it will repeat again it's all I have right now to make an analysis on. If it works again then we could (should) see a pullback to the 2100 area in the next few days where big support is at. At that point you can certainly expect some trapped bears (if there are any left alive?) to exit, which would also cause a bounce back up. Of course on the upside there's really no limit as we are in uncharted territory now. So around 2155 on the SPX cash would be 20 points higher then the 2135 May 2015 prior high. Let's see if they reach and tire out like they've done so many times before.


