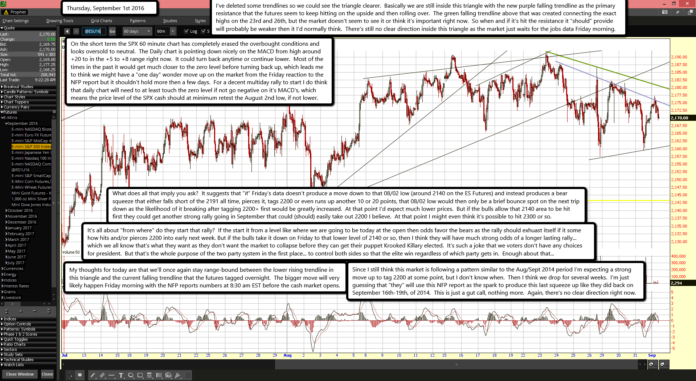
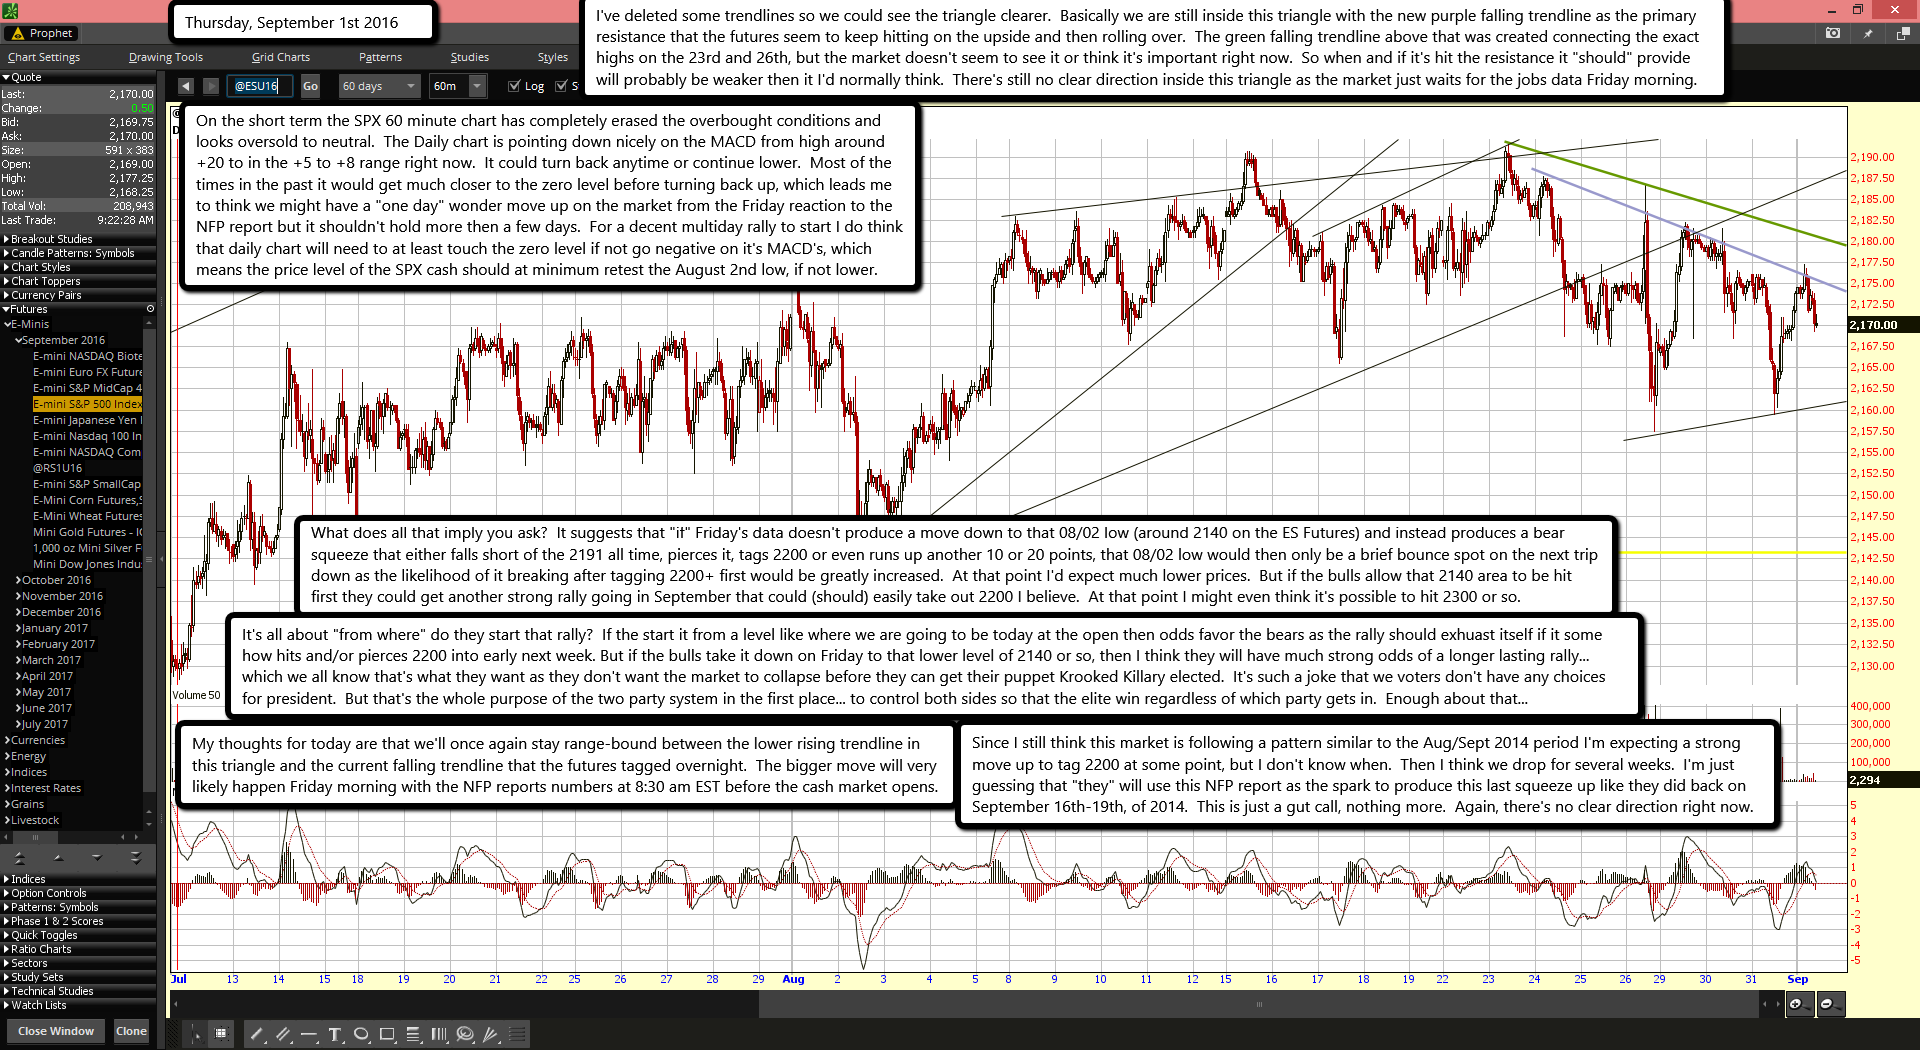
I've deleted some trendlines so we could see the triangle clearer. Basically we are still inside this triangle with the new purple falling trendline as the primary resistance that the futures seem to keep hitting on the upside and then rolling over. The green falling trendline above that was created connecting the exact highs on the 23rd and 26th, but the market doesn't seem to see it or think it's important right now. So when and if it's hit the resistance it "should" provide will probably be weaker then it I'd normally think. There's still no clear direction inside this triangle as the market just waits for the jobs data Friday morning.
On the short term the SPX 60 minute chart has completely erased the overbought conditions and looks oversold to neutral. The Daily chart is pointing down nicely on the MACD from high around +20 to in the +5 to +8 range right now. It could turn back anytime or continue lower. Most of the times in the past it would get much closer to the zero level before turning back up, which leads me to think we might have a "one day" wonder move up on the market from the Friday reaction to the NFP report but it shouldn't hold more then a few days. For a decent multiday rally to start I do think that daily chart will need to at least touch the zero level if not go negative on it's MACD's, which means the price level of the SPX cash should at minimum retest the August 2nd low, if not lower.
What does all that imply you ask? It suggests that "if" Friday's data doesn't produce a move down to that 08/02 low (around 2140 on the ES Futures) and instead produces a bear squeeze that either falls short of the 2191 all time, pierces it, tags 2200 or even runs up another 10 or 20 points, that 08/02 low would then only be a brief bounce spot on the next trip down as the likelihood of it breaking after tagging 2200+ first would be greatly increased. At that point I'd expect much lower prices. But if the bulls allow that 2140 area to be hit first they could get another strong rally going in September that could (should) easily take out 2200 I believe. At that point I might even think it's possible to hit 2300 or so.
It's all about "from where" do they start that rally? If the start it from a level like where we are going to be today at the open then odds favor the bears as the rally should exhuast itself if it some how hits and/or pierces 2200 into early next week. But if the bulls take it down on Friday to that lower level of 2140 or so, then I think they will have much strong odds of a longer lasting rally... which we all know that's what they want as they don't want the market to collapse before they can get their puppet Krooked Killary elected. It's such a joke that we voters don't have any choices for president. But that's the whole purpose of the two party system in the first place... to control both sides so that the elite win regardless of which party gets in. Enough about that...
My thoughts for today are that we'll once again stay range-bound between the lower rising trendline in this triangle and the current falling trendline that the futures tagged overnight. The bigger move will very likely happen Friday morning with the NFP reports numbers at 8:30 am EST before the cash market opens
Since I still think this market is following a pattern similar to the Aug/Sept 2014 period I'm expecting a strong move up to tag 2200 at some point, but I don't know when. Then I think we drop for several weeks. I'm just guessing that "they" will use this NFP report as the spark to produce this last squeeze up like they did back on September 16th-19th, of 2014. This is just a gut call, nothing more. Again, there's no clear direction right now.


