
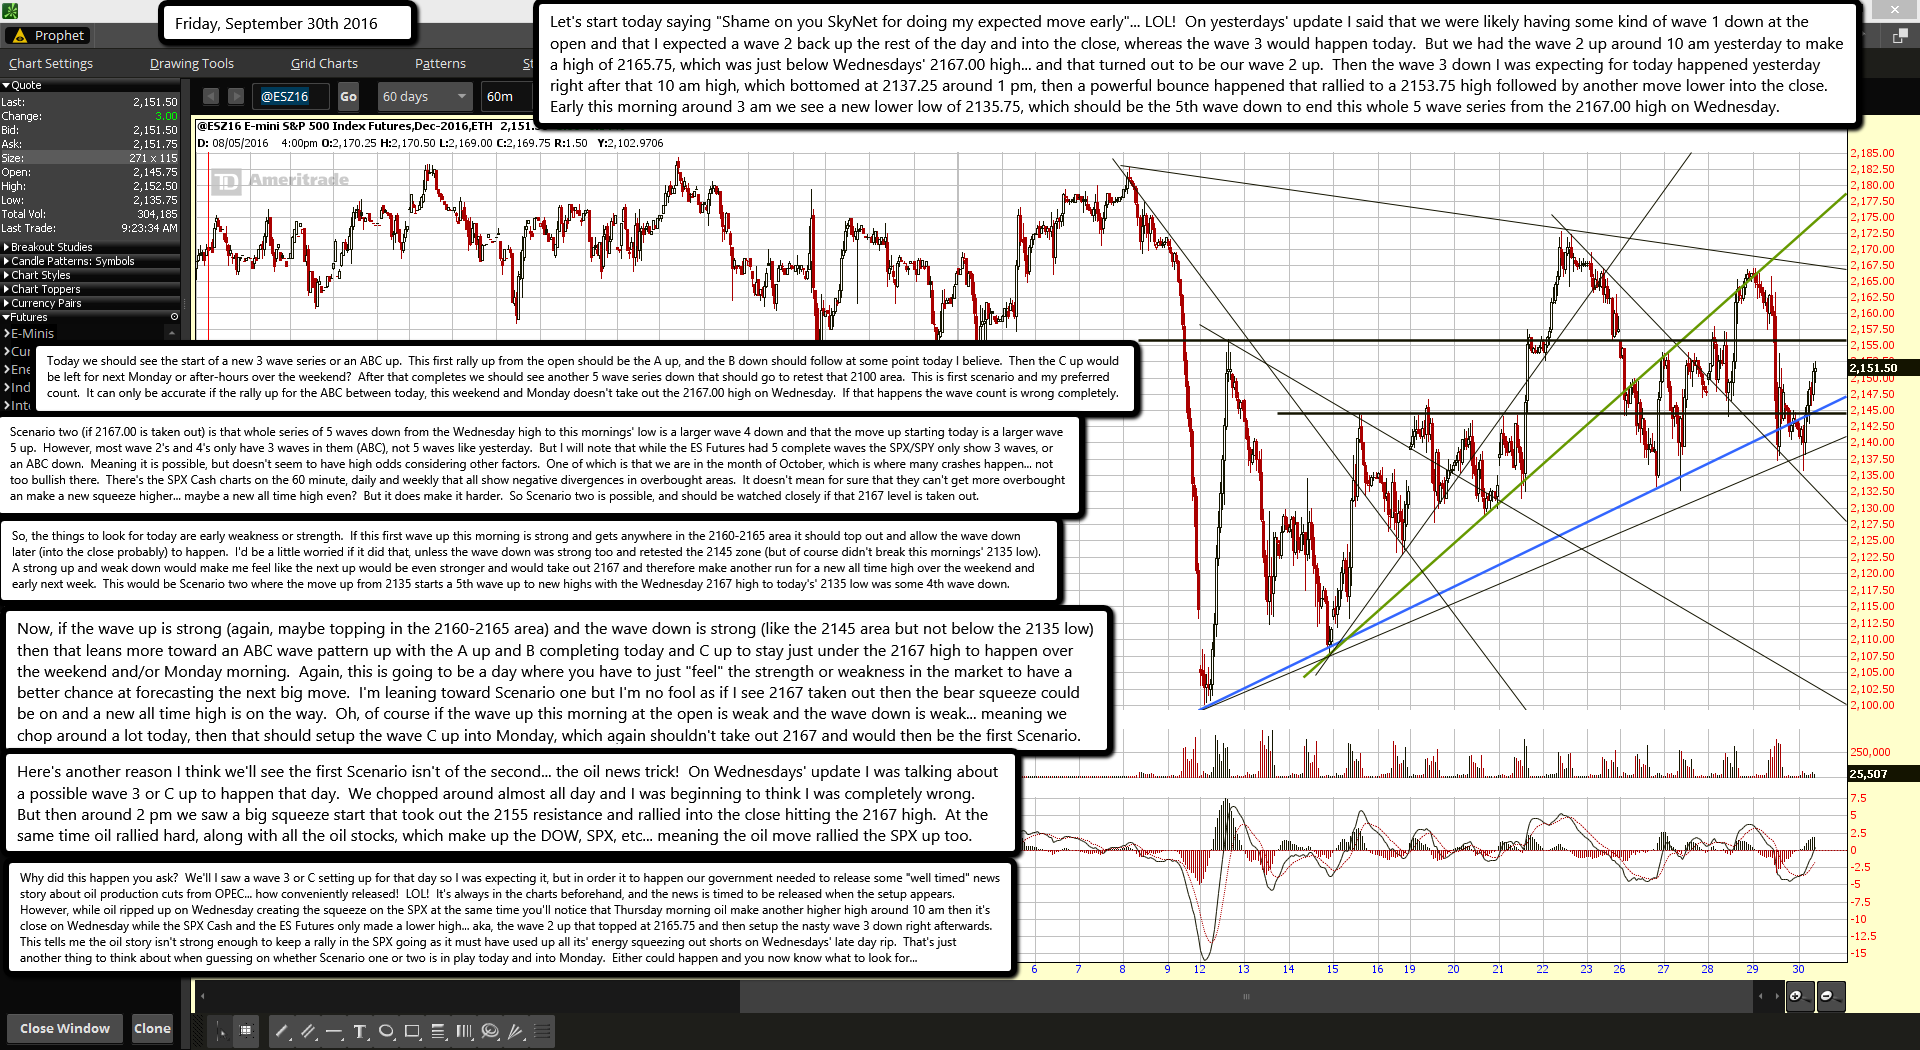
Let's start today saying "Shame on you SkyNet for doing my expected move early"... LOL! On yesterdays' update I said that we were likely having some kind of wave 1 down at the open and that I expected a wave 2 back up the rest of the day and into the close, whereas the wave 3 would happen today. But we had the wave 2 up around 10 am yesterday to make a high of 2165.75, which was just below Wednesdays' 2167.00 high... and that turned out to be our wave 2 up. Then the wave 3 down I was expecting for today happened yesterday right after that 10 am high, which bottomed at 2137.25 around 1 pm, then a powerful bounce happened that rallied to a 2153.75 high followed by another move lower into the close. Early this morning around 3 am we see a new lower low of 2135.75, which should be the 5th wave down to end this whole 5 wave series from the 2167.00 high on Wednesday.
Today we should see the start of a new 3 wave series or an ABC up. This first rally up from the open should be the A up, and the B down should follow at some point today I believe. Then the C up would be left for next Monday or after-hours over the weekend? After that completes we should see another 5 wave series down that should go to retest that 2100 area. This is first scenario and my preferred count. It can only be accurate if the rally up for the ABC between today, this weekend and Monday doesn't take out the 2167.00 high on Wednesday. If that happens the wave count is wrong completely.
Scenario two (if 2167.00 gets taken out) is that whole series of 5 waves down from the Wednesday high to this mornings' low is a larger wave 4 down and that the move up starting today is a larger wave 5 up. However, most wave 2's and 4's only have 3 waves in them (ABC), not 5 waves like yesterday. But I will note that while the ES Futures had 5 complete waves the SPX/SPY only show 3 waves, or an ABC down. Meaning it is possible, but doesn't seem to have high odds considering other factors. One of which is that we are in the month of October, which is where many crashes happen... not too bullish there. There's the SPX Cash charts on the 60 minute, daily and weekly that all show negative divergences in overbought areas. It doesn't mean for sure that they can't get more overbought an make a new squeeze higher... maybe a new all time high even? But it does make it harder. So Scenario two is possible, and should be watched closely if that 2167 level is taken out.
So, the things to look for today are early weakness or strength. If this first wave up this morning is strong and gets anywhere in the 2160-2165 area it should top out and allow the wave down later (into the close probably) to happen. I'd be a little worried if it did that, unless the wave down was strong too and retested the 2145 zone (but of course didn't break this mornings' 2135 low). A strong up and weak down would make me feel like the next up would be even stronger and would take out 2167 and therefore make another run for a new all time high over the weekend and early next week. This would be Scenario two where the move up from 2135 starts a 5th wave up to new highs with the Wednesday 2167 high to today's' 2135 low was some 4th wave down.
Now, if the wave up is strong (again, maybe topping in the 2160-2165 area) and the wave down is strong (like the 2145 area but not below the 2135 low) then that leans more toward an ABC wave pattern up with the A up and B completing today and C up to stay just under the 2167 high to happen over the weekend and/or Monday morning. Again, this is going to be a day where you have to just "feel" the strength or weakness in the market to have a better chance at forecasting the next big move. I'm leaning toward Scenario one but I'm no fool as if I see 2167 taken out then the bear squeeze could be on and a new all time high is on the way. Oh, of course if the wave up this morning at the open is weak and the wave down is weak... meaning we chop around a lot today, then that should setup the wave C up into Monday, which again shouldn't take out 2167 and would then be the first Scenario.
Here's another reason I think we'll see the first Scenario isn't of the second... the oil news trick! On Wednesdays' update I was talking about a possible wave 3 or C up to happen that day. We chopped around almost all day and I was beginning to think I was completely wrong. But then around 2 pm we saw a big squeeze start that took out the 2155 resistance and rallied into the close hitting the 2167 high. At the same time oil rallied hard, along with all the oil stocks, which make up the DOW, SPX, etc... meaning the oil move rallied the SPX up too.
Why did this happen you ask? We'll I saw a wave 3 or C setting up for that day so I was expecting it, but in order it to happen our government needed to release some "well timed" news story about oil production cuts from OPEC... how conveniently released! LOL! It's always in the charts beforehand, and the news is timed to be released when the setup appears. However, while oil ripped up on Wednesday creating the squeeze on the SPX at the same time you'll notice that Thursday morning oil make another higher high around 10 am then it's close on Wednesday while the SPX Cash and the ES Futures only made a lower high... aka, the wave 2 up that topped at 2165.75 and then setup the nasty wave 3 down right afterwards. This tells me the oil story isn't strong enough to keep a rally in the SPX going as it must have used up all its' energy squeezing out shorts on Wednesdays' late day rip. That's just another thing to think about when guessing on whether Scenario one or two is in play today and into Monday. Either could happen and you now know what to look for...

