
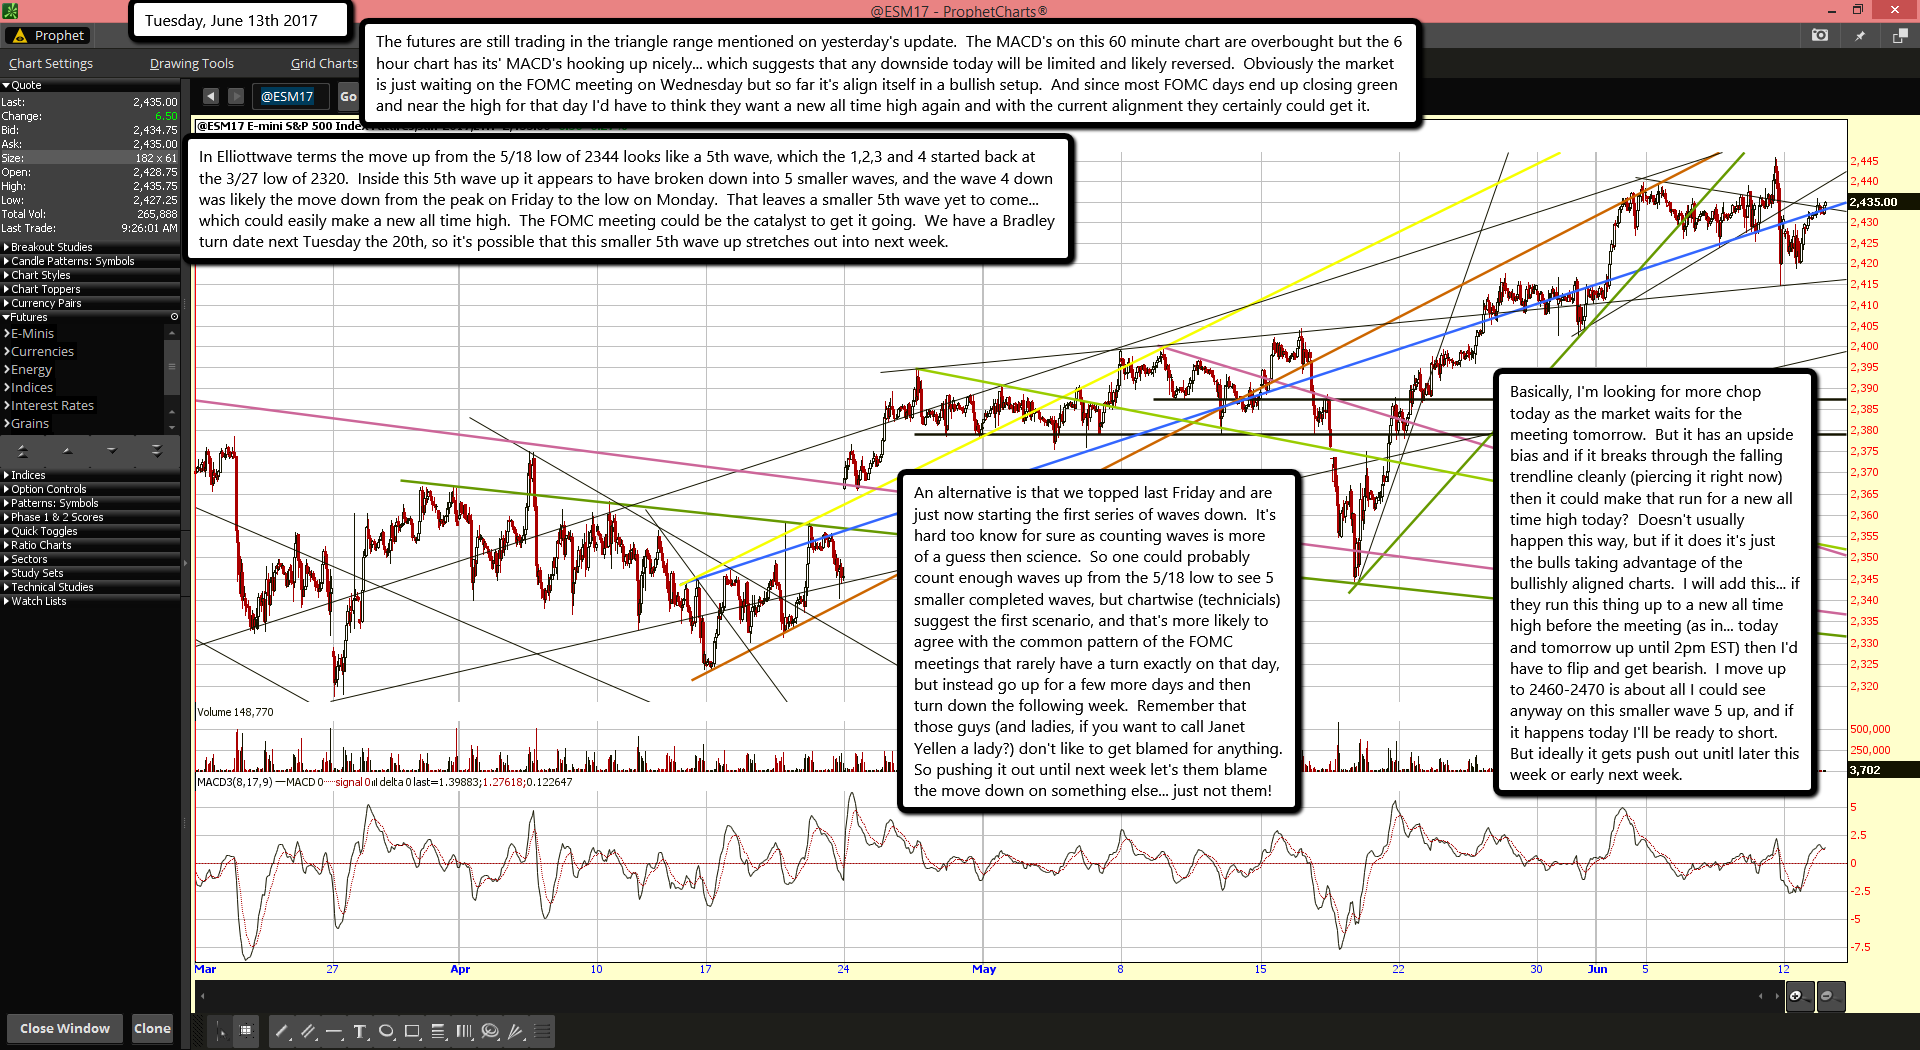
The futures are still trading in the triangle range mentioned on yesterday's update. The MACD's on this 60 minute chart are overbought but the 6 hour chart has its' MACD's hooking up nicely... which suggests that any downside today will be limited and likely reversed. Obviously the market is just waiting on the FOMC meeting on Wednesday but so far it's align itself in a bullish setup. And since most FOMC days end up closing green and near the high for that day I'd have to think they want a new all time high again and with the current alignment they certainly could get it.
In Elliottwave terms the move up from the 5/18 low of 2344 looks like a 5th wave, which the 1,2,3 and 4 started back at the 3/27 low of 2320. Inside this 5th wave up it appears to have broken down into 5 smaller waves, and the wave 4 down was likely the move down from the peak on Friday to the low on Monday. That leaves a smaller 5th wave yet to come... which could easily make a new all time high. The FOMC meeting could be the catalyst to get it going. We have a Bradley turn date next Tuesday the 20th, so it's possible that this smaller 5th wave up stretches out into next week.
An alternative is that we topped last Friday and are just now starting the first series of waves down. It's hard too know for sure as counting waves is more of a guess then science. So one could probably count enough waves up from the 5/18 low to see 5 smaller completed waves, but chartwise (technicials) suggest the first scenario, and that's more likely to agree with the common pattern of the FOMC meetings that rarely have a turn exactly on that day, but instead go up for a few more days and then turn down the following week. Remember that those guys (and ladies, if you want to call Janet Yellen a lady?) don't like to get blamed for anything. So pushing it out until next week let's them blame the move down on something else... just not them!
Basically, I'm looking for more chop today as the market waits for the meeting tomorrow. But it has an upside bias and if it breaks through the falling trendline cleanly (piercing it right now) then it could make that run for a new all time high today? Doesn't usually happen this way, but if it does it's just the bulls taking advantage of the bullishly aligned charts. I will add this... if they run this thing up to a new all time high before the meeting (as in... today and tomorrow up until 2pm EST) then I'd have to flip and get bearish. I move up to 2460-2470 is about all I could see anyway on this smaller wave 5 up, and if it happens today I'll be ready to short. But ideally it gets push out unitl later this week or early next week.

