
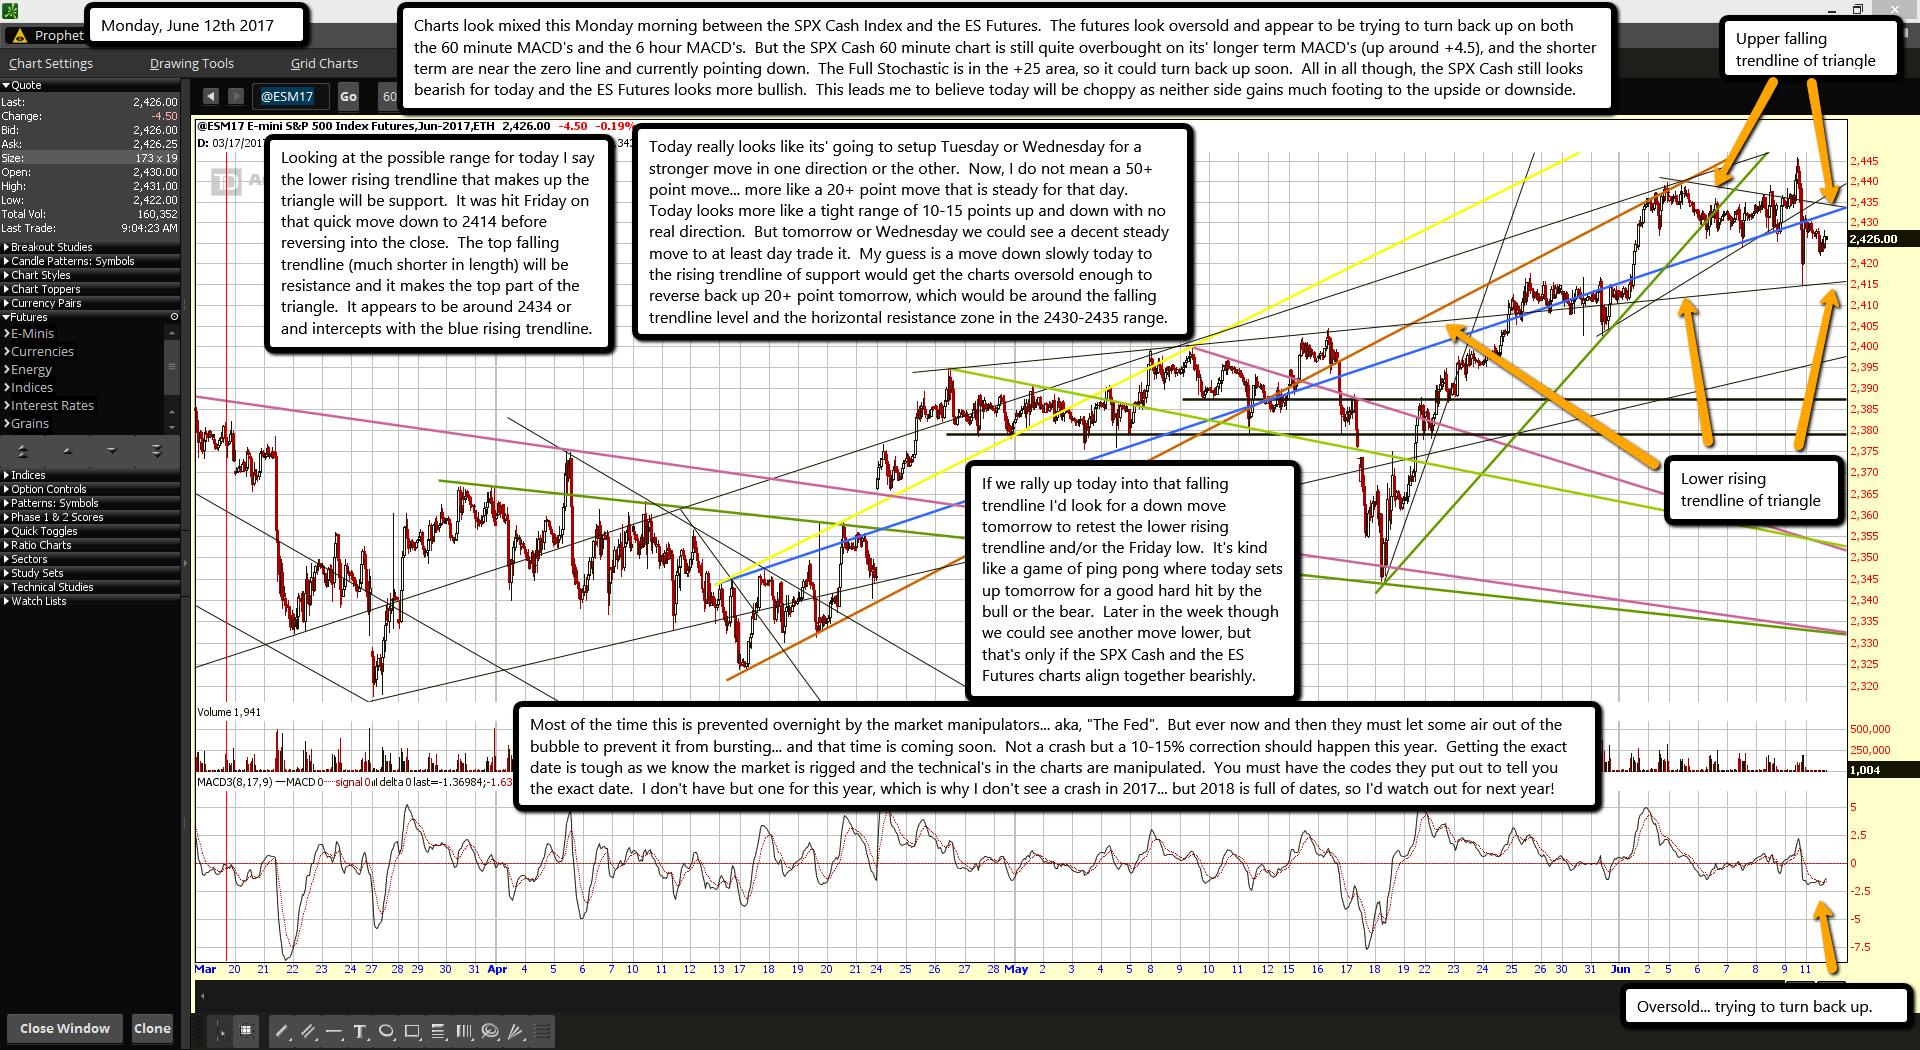
Charts look mixed this Monday morning between the SPX Cash Index and the ES Futures. The futures look oversold and appear to be trying to turn back up on both the 60 minute MACD's and the 6 hour MACD's. But the SPX Cash 60 minute chart is still quite overbought on its' longer term MACD's (up around +4.5), and the shorter term are near the zero line and currently pointing down. The Full Stochastic is in the +25 area, so it could turn back up soon. All in all though, the SPX Cash still looks bearish for today and the ES Futures looks more bullish. This leads me to believe today will be choppy as neither side gains much footing to the upside or downside.
Looking at the possible range for today I say the lower rising trendline that makes up the triangle will be support. It was hit Friday on that quick move down to 2414 before reversing into the close. The top falling trendline (much shorter in length) will be resistance and it makes the top part of the triangle. It appears to be around 2434 or and intercepts with the blue rising trendline.
Today really looks like its' going to setup Tuesday or Wednesday for a stronger move in one direction or the other. Now, I do not mean a 50+ point move... more like a 20+ point move that is steady for that day. Today looks more like a tight range of 10-15 points up and down with no real direction. But tomorrow or Wednesday we could see a decent steady move to at least day trade it. My guess is a move down slowly today to the rising trendline of support would get the charts oversold enough to reverse back up 20+ point tomorrow, which would be around the falling trendline level and the horizontal resistance zone in the 2430-2435 range.
If we rally up today into that falling trendline I'd look for a down move tomorrow to retest the lower rising trendline and/or the Friday low. It's kind like a game of ping pong where today sets up tomorrow for a good hard hit by the bull or the bear. Later in the week though we could see another move lower, but that's only if the SPX Cash and the ES Futures charts align together bearishly.
Most of the time this is prevented overnight by the market manipulators... aka, "The Fed". But ever now and then they must let some air out of the bubble to prevent it from bursting... and that time is coming soon. Not a crash but a 10-15% correction should happen this year. Getting the exact date is tough as we know the market is rigged and the technical's in the charts are manipulated. You must have the codes they put out to tell you the exact date. I don't have but one for this year, which is why I don't see a crash in 2017... but 2018 is full of dates, so I'd watch out for next year!

