
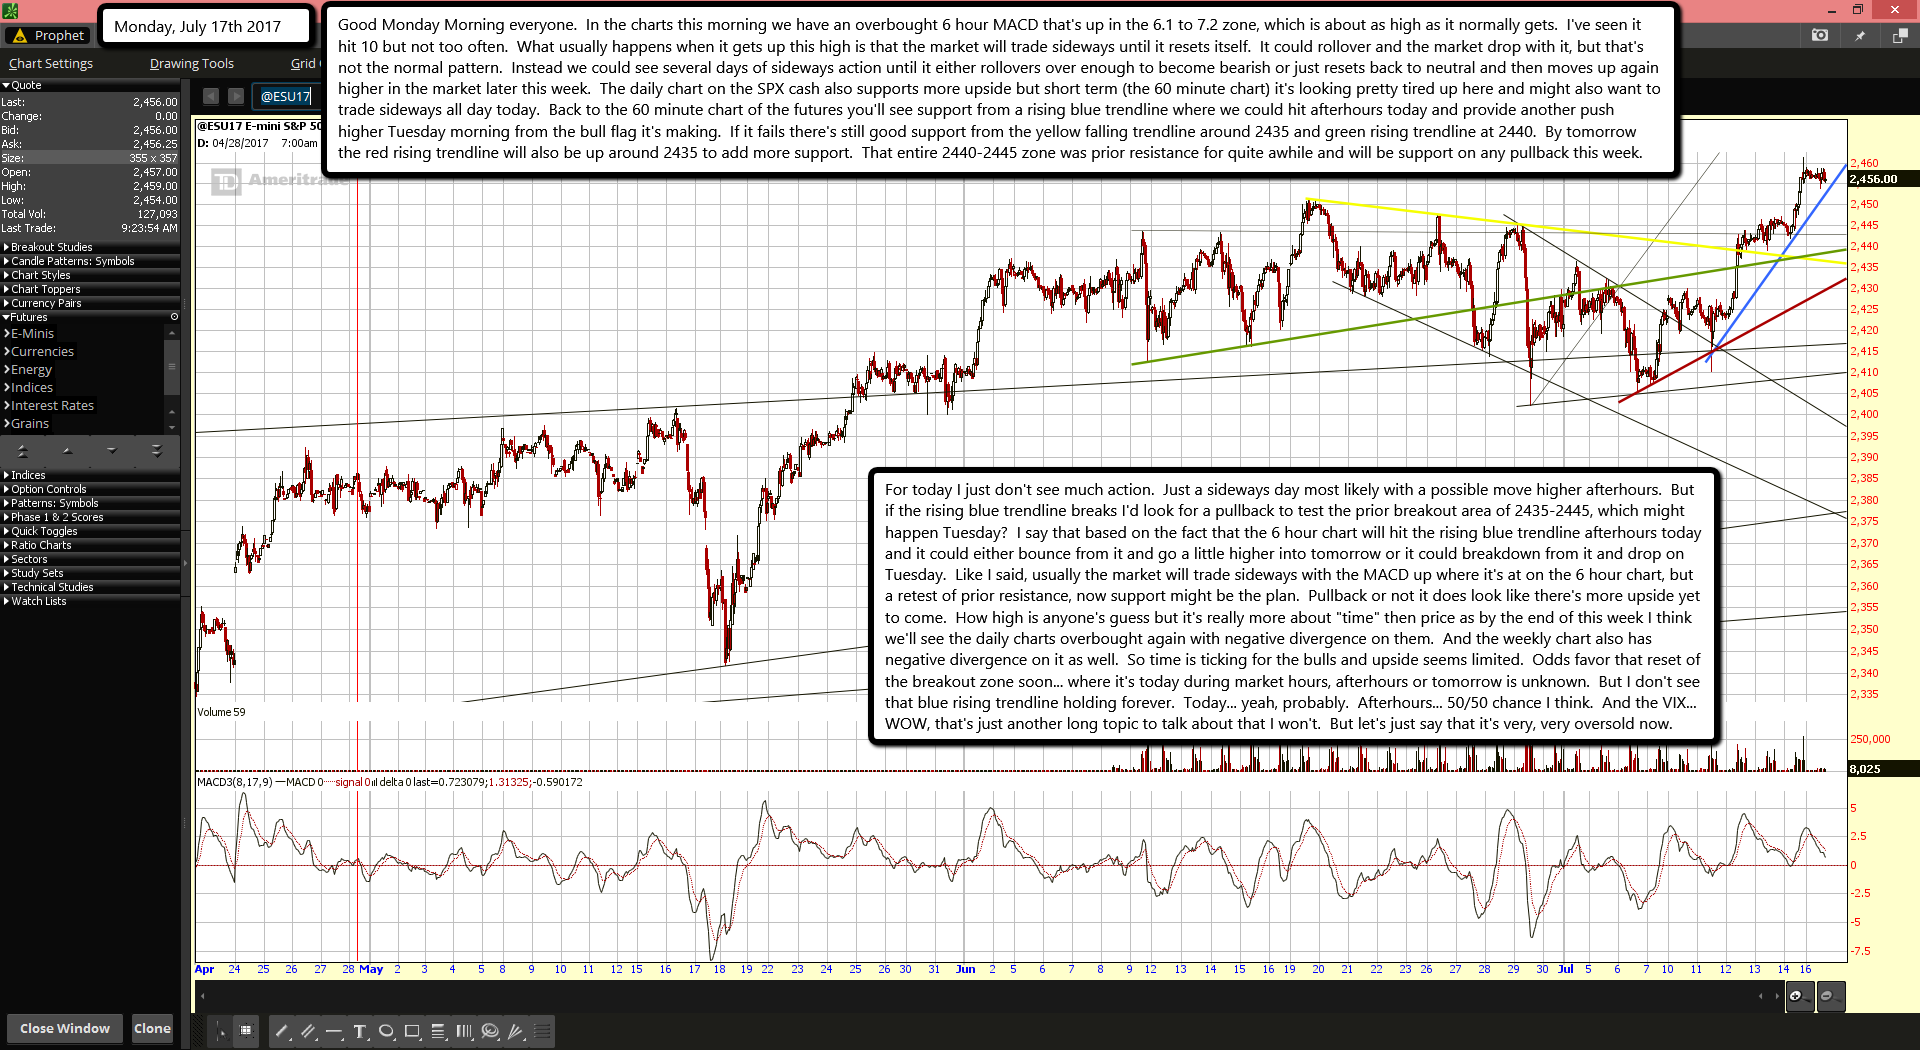
Good Monday Morning everyone. In the charts this morning we have an overbought 6 hour MACD that's up in the 6.1 to 7.2 zone, which is about as high as it normally gets. I've seen it hit 10 but not too often. What usually happens when it gets up this high is that the market will trade sideways until it resets itself. It could rollover and the market drop with it, but that's not the normal pattern. Instead we could see several days of sideways action until it either rollovers over enough to become bearish or just resets back to neutral and then moves up again higher in the market later this week. The daily chart on the SPX cash also supports more upside but short term (the 60 minute chart) it's looking pretty tired up here and might also want to trade sideways all day today. Back to the 60 minute chart of the futures you'll see support from a rising blue trendline where we could hit afterhours today and provide another push higher Tuesday morning from the bull flag it's making. If it fails there's still good support from the yellow falling trendline around 2435 and green rising trendline at 2440. By tomorrow the red rising trendline will also be up around 2435 to add more support. That entire 2440-2445 zone was prior resistance for quite awhile and will be support on any pullback this week.
For today I just don't see much action. Just a sideways day most likely with a possible move higher afterhours. But if the rising blue trendline breaks I'd look for a pullback to test the prior breakout area of 2435-2445, which might happen Tuesday? I say that based on the fact that the 6 hour chart will hit the rising blue trendline afterhours today and it could either bounce from it and go a little higher into tomorrow or it could breakdown from it and drop on Tuesday. Like I said, usually the market will trade sideways with the MACD up where it's at on the 6 hour chart, but a retest of prior resistance, now support might be the plan. Pullback or not it does look like there's more upside yet to come. How high is anyone's guess but it's really more about "time" then price as by the end of this week I think we'll see the daily charts overbought again with negative divergence on them. And the weekly chart also has negative divergence on it as well. So time is ticking for the bulls and upside seems limited. Odds favor that reset of the breakout zone soon... where it's today during market hours, afterhours or tomorrow is unknown. But I don't see that blue rising trendline holding forever. Today... yeah, probably. Afterhours... 50/50 chance I think. And the VIX... WOW, that's just another long topic to talk about that I won't. But let's just say that it's very, very oversold now.

