
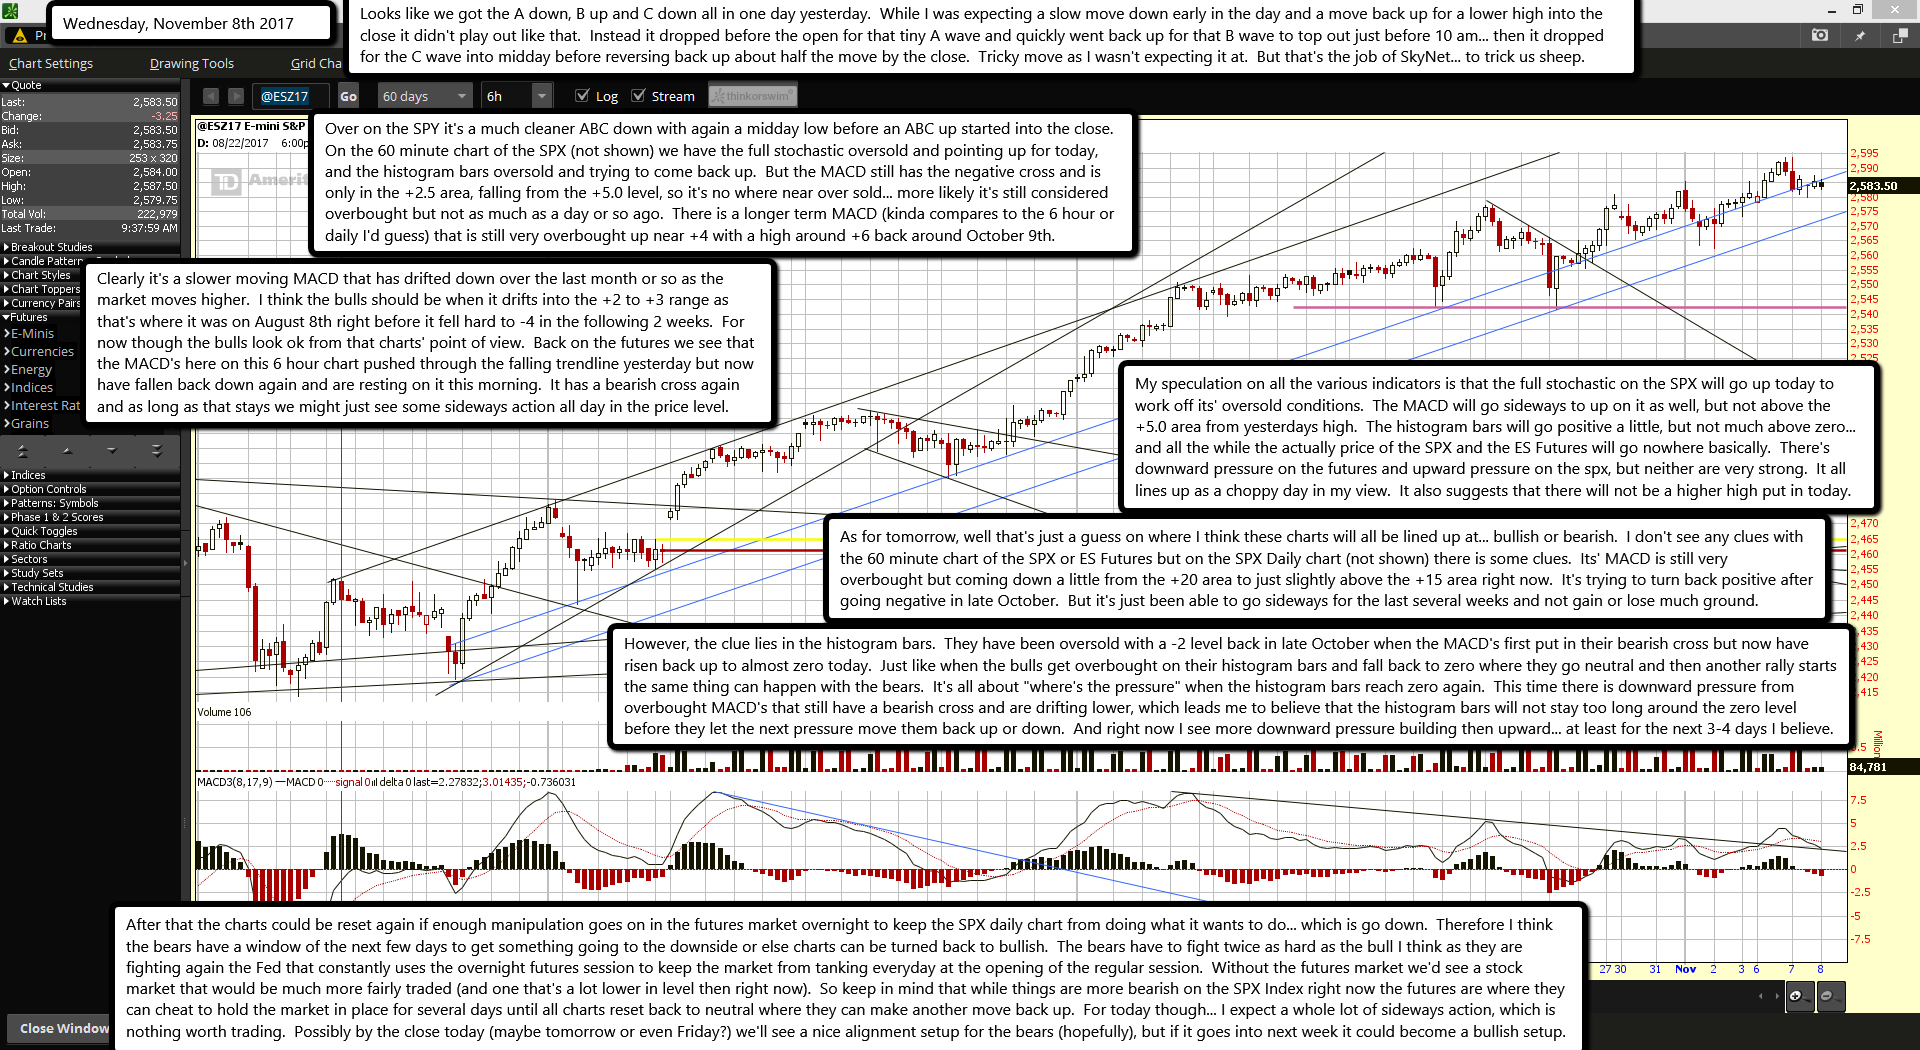
Looks like we got the A down, B up and C down all in one day yesterday. While I was expecting a slow move down early in the day and a move back up for a lower high into the close it didn't play out like that. Instead it dropped before the open for that tiny A wave and quickly went back up for that B wave to top out just before 10 am... then it dropped for the C wave into midday before reversing back up about half the move by the close. Tricky move as I wasn't expecting it at. But that's the job of SkyNet... to trick us sheep.
Over on the SPY it's a much cleaner ABC down with again a midday low before an ABC up started into the close. On the 60 minute chart of the SPX (not shown) we have the full stochastic oversold and pointing up for today, and the histogram bars oversold and trying to come back up. But the MACD still has the negative cross and is only in the +2.5 area, falling from the +5.0 level, so it's no where near over sold... more likely it's still considered overbought but not as much as a day or so ago. There is a longer term MACD (kinda compares to the 6 hour or daily I'd guess) that is still very overbought up near +4 with a high around +6 back around October 9th.
Clearly it's a slower moving MACD that has drifted down over the last month or so as the market moves higher. I think the bulls should be when it drifts into the +2 to +3 range as that's where it was on August 8th right before it fell hard to -4 in the following 2 weeks. For now though the bulls look ok from that charts' point of view. Back on the futures we see that the MACD's here on this 6 hour chart pushed through the falling trendline yesterday but now have fallen back down again and are resting on it this morning. It has a bearish cross again and as long as that stays we might just see some sideways action all day in the price level.
My speculation on all the various indicators is that the full stochastic on the SPX will go up today to work off its' oversold conditions. The MACD will go sideways to up on it as well, but not above the +5.0 area from yesterdays high. The histogram bars will go positive a little, but not much above zero... and all the while the actually price of the SPX and the ES Futures will go nowhere basically. There's downward pressure on the futures and upward pressure on the spx, but neither are very strong. It all lines up as a choppy day in my view. It also suggests that there will not be a higher high put in today.
As for tomorrow, well that's just a guess on where I think these charts will all be lined up at... bullish or bearish. I don't see any clues with the 60 minute chart of the SPX or ES Futures but on the SPX Daily chart (not shown) there is some clues. Its' MACD is still very overbought but coming down a little from the +20 area to just slightly above the +15 area right now. It's trying to turn back positive after going negative in late October. But it's just been able to go sideways for the last several weeks and not gain or lose much ground.
However, the clue lies in the histogram bars. They have been oversold with a -2 level back in late October when the MACD's first put in their bearish cross but now have risen back up to almost zero today. Just like when the bulls get overbought on their histogram bars and fall back to zero where they go neutral and then another rally starts the same thing can happen with the bears. It's all about "where's the pressure" when the histogram bars reach zero again. This time there is downward pressure from overbought MACD's that still have a bearish cross and are drifting lower, which leads me to believe that the histogram bars will not stay too long around the zero level before they let the next pressure move them back up or down. And right now I see more downward pressure building then upward... at least for the next 3-4 days I believe.
After that the charts could be reset again if enough manipulation goes on in the futures market overnight to keep the SPX daily chart from doing what it wants to do... which is go down. Therefore I think the bears have a window of the next few days to get something going to the downside or else charts can be turned back to bullish. The bears have to fight twice as hard as the bull I think as they are fighting again the Fed that constantly uses the overnight futures session to keep the market from tanking everyday at the opening of the regular session. Without the futures market we'd see a stock market that would be much more fairly traded (and one that's a lot lower in level then right now). So keep in mind that while things are more bearish on the SPX Index right now the futures are where they can cheat to hold the market in place for several days until all charts reset back to neutral where they can make another move back up. For today though... I expect a whole lot of sideways action, which is nothing worth trading. Possibly by the close today (maybe tomorrow or even Friday?) we'll see a nice alignment setup for the bears (hopefully), but if it goes into next week it could become a bullish setup.
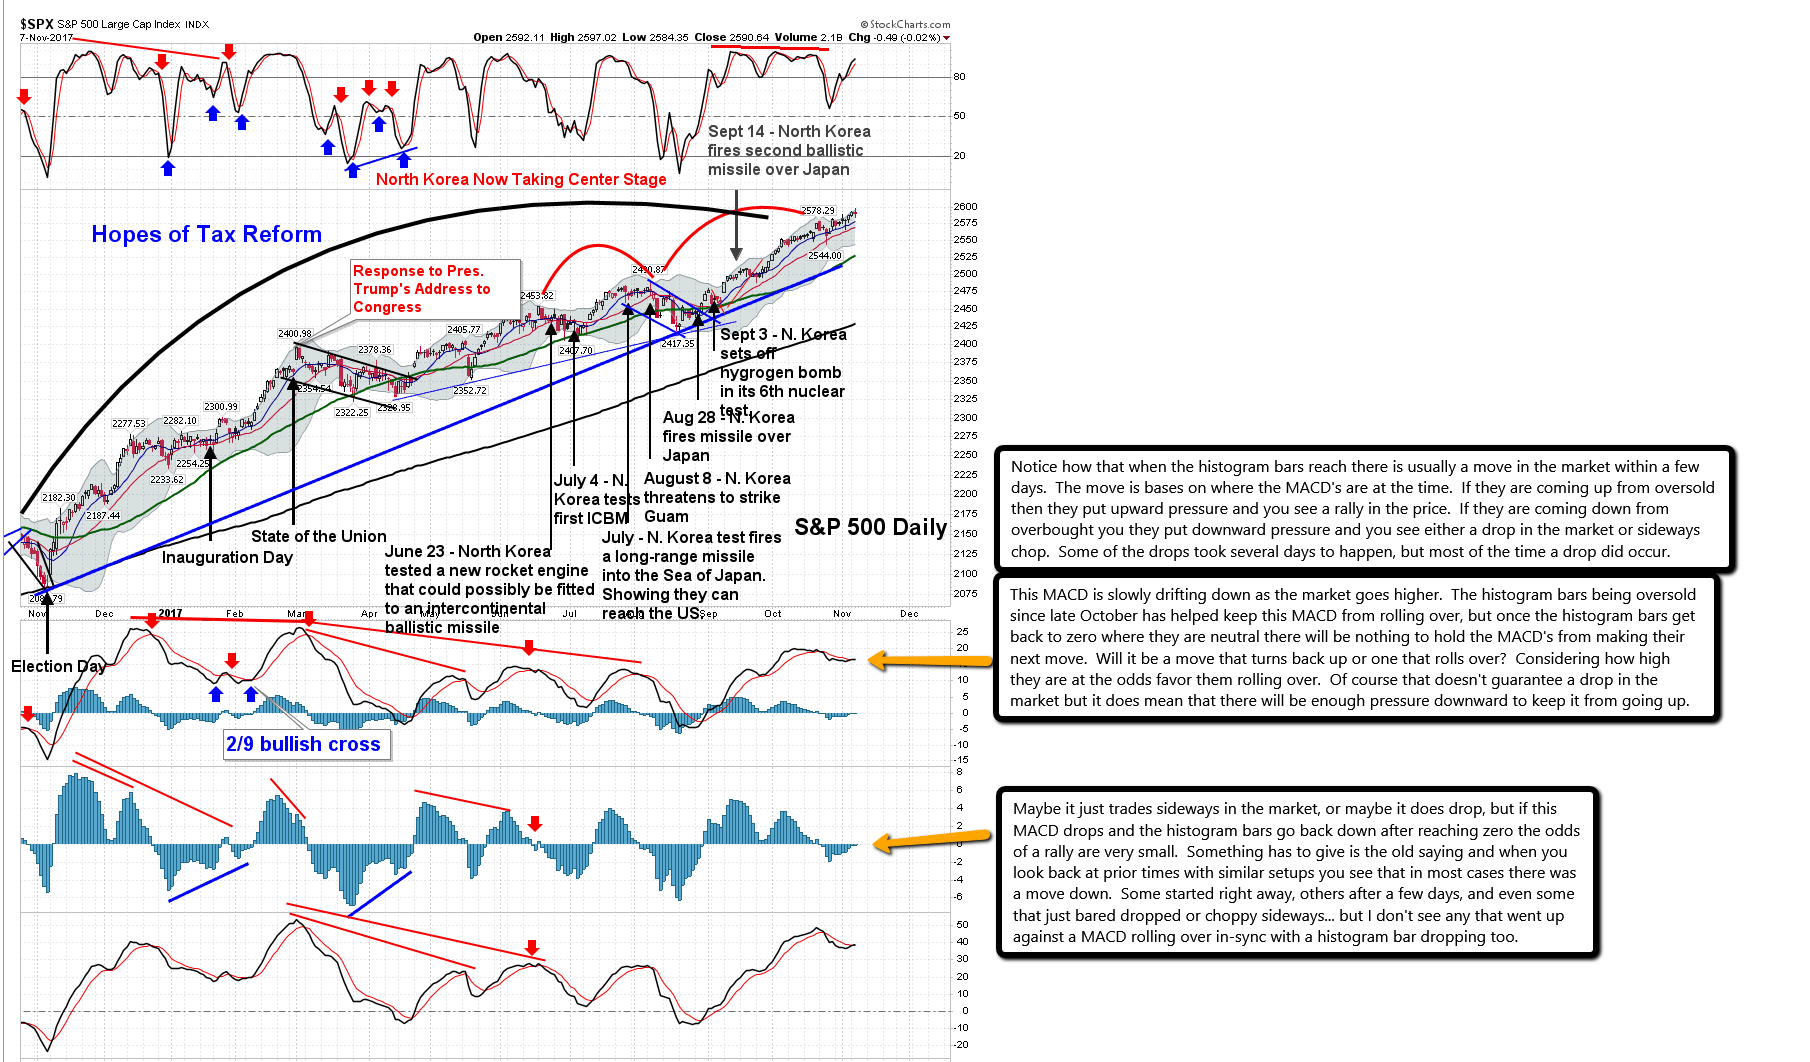
Notice how that when the histogram bars reach there is usually a move in the market within a few days. The move is bases on where the MACD's are at the time. If they are coming up from oversold then they put upward pressure and you see a rally in the price. If they are coming down from overbought you they put downward pressure and you see either a drop in the market or sideways chop. Some of the drops took several days to happen, but most of the time a drop did occur.
This MACD is slowly drifting down as the market goes higher. The histogram bars being oversold since late October has helped keep this MACD from rolling over, but once the histogram bars get back to zero where they are neutral there will be nothing to hold the MACD's from making their next move. Will it be a move that turns back up or one that rolls over? Considering how high they are at the odds favor them rolling over. Of course that doesn't guarantee a drop in the market but it does mean that there will be enough pressure downward to keep it from going up.
Maybe it just trades sideways in the market, or maybe it does drop, but if this MACD drops and the histogram bars go back down after reaching zero the odds of a rally are very small. Something has to give is the old saying and when you look back at prior times with similar setups you see that in most cases there was a move down. Some started right away, others after a few days, and even some that just bared dropped or choppy sideways... but I don't see any that went up against a MACD rolling over in-sync with a histogram bar dropping too.

