
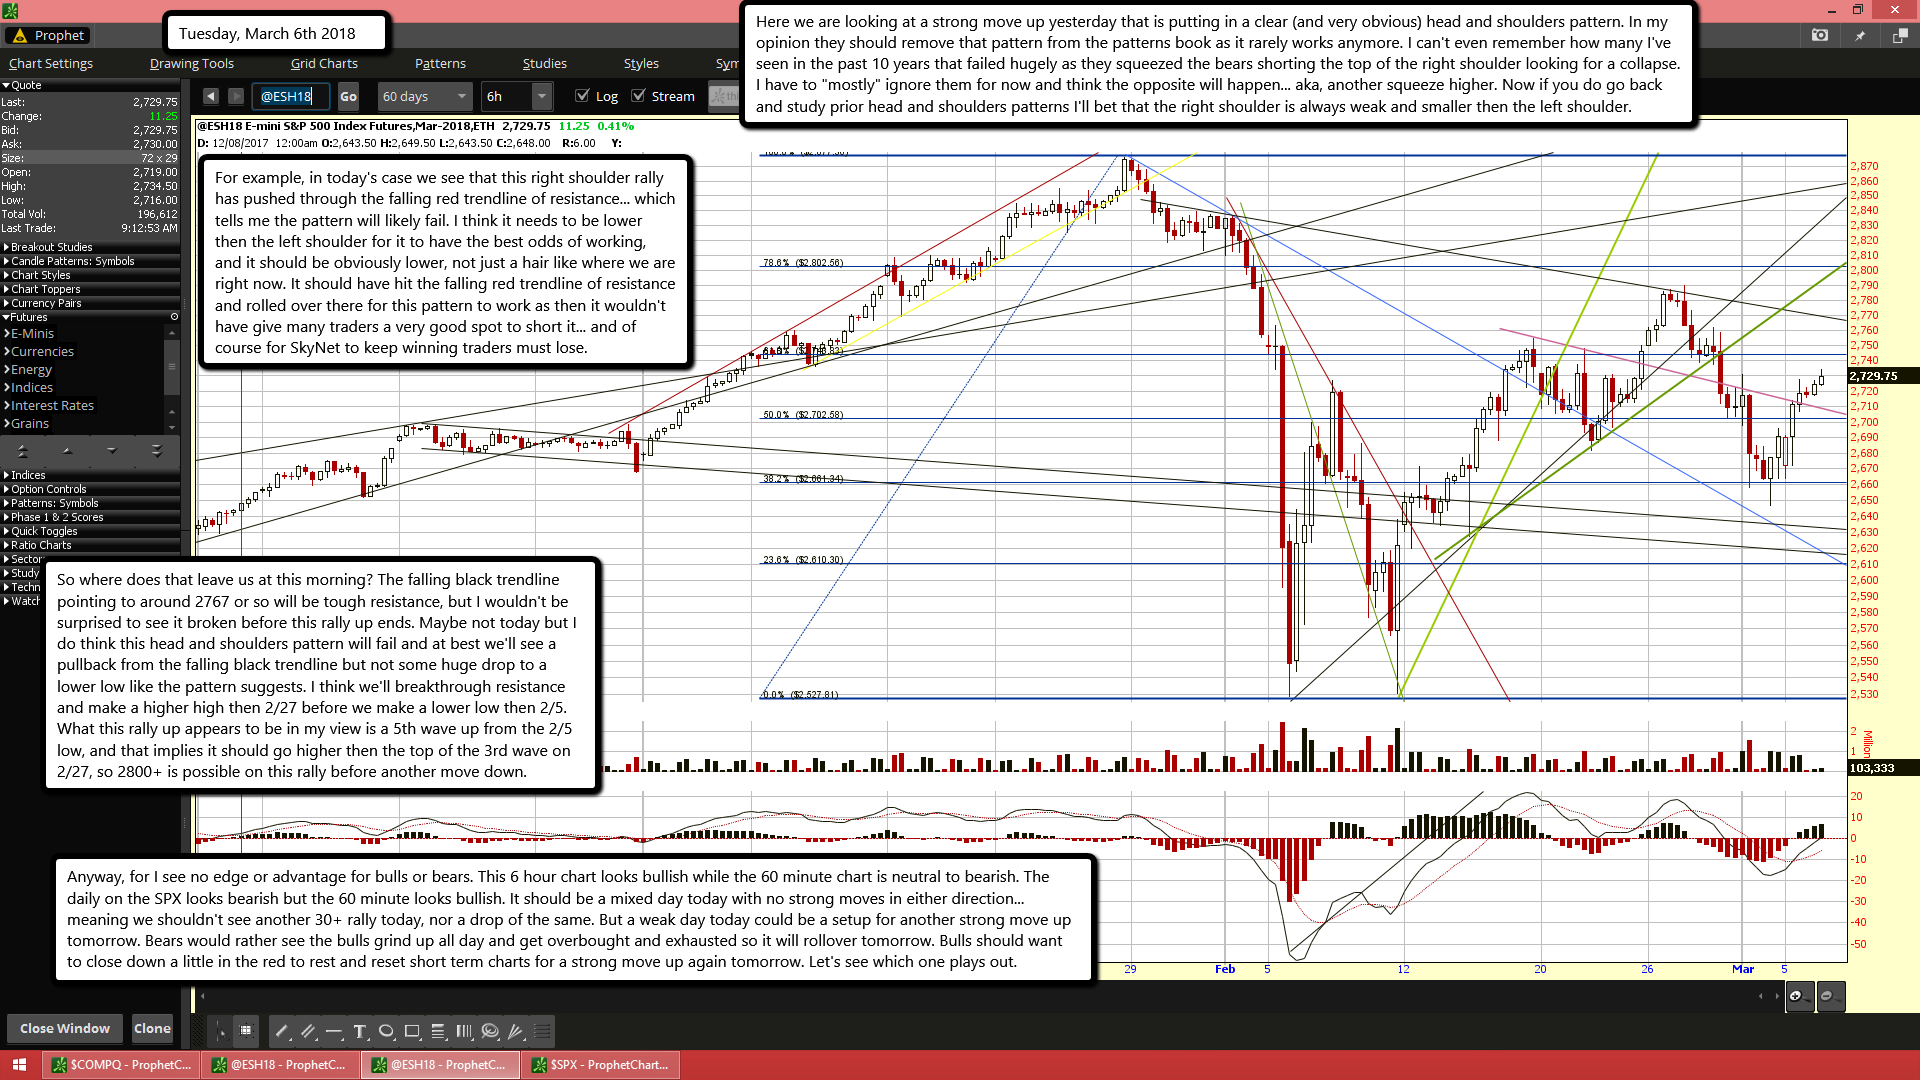
Here we are looking at a strong move up yesterday that is putting in a clear (and very obvious) head and shoulders pattern. In my opinion they should remove that pattern from the patterns book as it rarely works anymore. I can't even remember how many I've seen in the past 10 years that failed hugely as they squeezed the bears shorting the top of the right shoulder looking for a collapse. I have to "mostly" ignore them for now and think the opposite will happen... aka, another squeeze higher. Now if you do go back and study prior head and shoulders patterns I'll bet that the right shoulder is always weak and smaller then the left shoulder.
For example, in today's case we see that this right shoulder rally has pushed through the falling red trendline of resistance... which tells me the pattern will likely fail. I think it needs to be lower then the left shoulder for it to have the best odds of working, and it should be obviously lower, not just a hair like where we are right now. It should have hit the falling red trendline of resistance and rolled over there for this pattern to work as then it wouldn't have give many traders a very good spot to short it... and of course for SkyNet to keep winning traders must lose.
So where does that leave us at this morning? The falling black trendline pointing to around 2767 or so will be tough resistance, but I wouldn't be surprised to see it broken before this rally up ends. Maybe not today but I do think this head and shoulders pattern will fail and at best we'll see a pullback from the falling black trendline but not some huge drop to a lower low like the pattern suggests. I think we'll breakthrough resistance and make a higher high then 2/27 before we make a lower low then 2/5. What this rally up appears to be in my view is a 5th wave up from the 2/5 low, and that implies it should go higher then the top of the 3rd wave on 2/27, so 2800+ is possible on this rally before another move down.
Anyway, for I see no edge or advantage for bulls or bears. This 6 hour chart looks bullish while the 60 minute chart is neutral to bearish. The daily on the SPX looks bearish but the 60 minute looks bullish. It should be a mixed day today with no strong moves in either direction... meaning we shouldn't see another 30+ rally today, nor a drop of the same. But a weak day today could be a setup for another strong move up tomorrow. Bears would rather see the bulls grind up all day and get overbought and exhausted so it will rollover tomorrow. Bulls should want to close down a little in the red to rest and reset short term charts for a strong move up again tomorrow. Let's see which one plays out.

