We rallied as expected on Friday and hit the FP on the QQQ and then we pulled back about a third of the move up. I spent Friday looking closely at all the charts and while I said on Friday that we appear to be starting the much wanted 5-10% correction, I then posted on twitter that it's not ready yet.
Meaning that it's possible that there's one more higher high left before the correction starts. I'm not sure or not if we get it as there's a ton of resistance overhead in the 5280-5290 zone on the ES, and if... just "if" we can get through it we should squeeze up to a new high and then rollover and start the correction.
What do I think the odds are on that happening Monday or Tuesday? Probably only 10% or so. Therefore I think there's a 90% chance that zone will stop the bulls and that we'll rollover from there and start the correction. That drop on Thursday just buried the RSI on the short term charts and woke up too many bears I think, which is why we need to go up to hit that zone first to scare them out.
I've been studying the weekly and daily charts over the weekend and everything is setup for the bears to start the 5-10% correction now. How fast it drops I don't know?
It might be similar to the 7/27/23 to 10/27/23 correction. I don't think it's going to last that long but it could I guess? Or something more like 8/31/21 to 10/1/21 for the correction, which again may or may not last the same amount of time as that one did back then. The only problem is that both of those periods were long and drawn out in time, and typically the market will flip back and forth between fast drops and slow one's... meaning we are overdue for a fast one.
Short term I'm thinking we'll rally up to the 5280-5290 zone today or Tuesday and then pullback from there, which might be into the CPI Wednesday before the open. Or, we could skip the rally and just do the pullback into the CPI, but with everyone short now, and looking for a large drop because of the Solar Eclipse, I have too think we need that last rally before any large drop.
If we go up today, or into the close on Tuesday, and reach the 5280-5290 zone, then we should pullback from it as I just don't see the market getting through that tough resistance zone. After that we should go down. Whether that's in front of the CPI or after it I don't know. My point is that the market will likely go the opposite direction after the CPI, from the direction it goes into it.
I will add though that if we rally into the CPI the risk is much higher that the drop will be ugly... meaning it could take out the low from last Thursday. I'm talking about a mini-crash where we get down that 5-10% in a few days. Yes, that's possible, but I have no way to predict that in advance so I'll adjust to whatever is given.
My Fibonacci Extension Target is pretty much hit as it is at 5334.39 and the high is 5333.50, so it's shy by less then a point, which is a direct hit in my book. Of course one more higher high to pierce it would be a wonderful short, but I don't see it happening.
Timing is super important. If the market "bases" for a week under that level and then rips higher then it can continue as it will have formed a lot of support and will have reset larger term overbought charts. But if it does it today, it's not built a base and will fail to hold and will rollover. Could it do so into the CPI Wednesday... sure but that's been done many times in the past where the CPI produced a big turn, so I give it very low odds. More then likely we won't get through 5280-5290 and it will be hit Monday.
I'm trying to cover all the possible moves the next few days and will just adjust to whichever one plays out. If we go down into the CPI we'll get more oversold, and it should produce a rally back up from it. But that will only be short term as the daily and weekly charts are very overbought, so another lower high from the CPI would be likely.
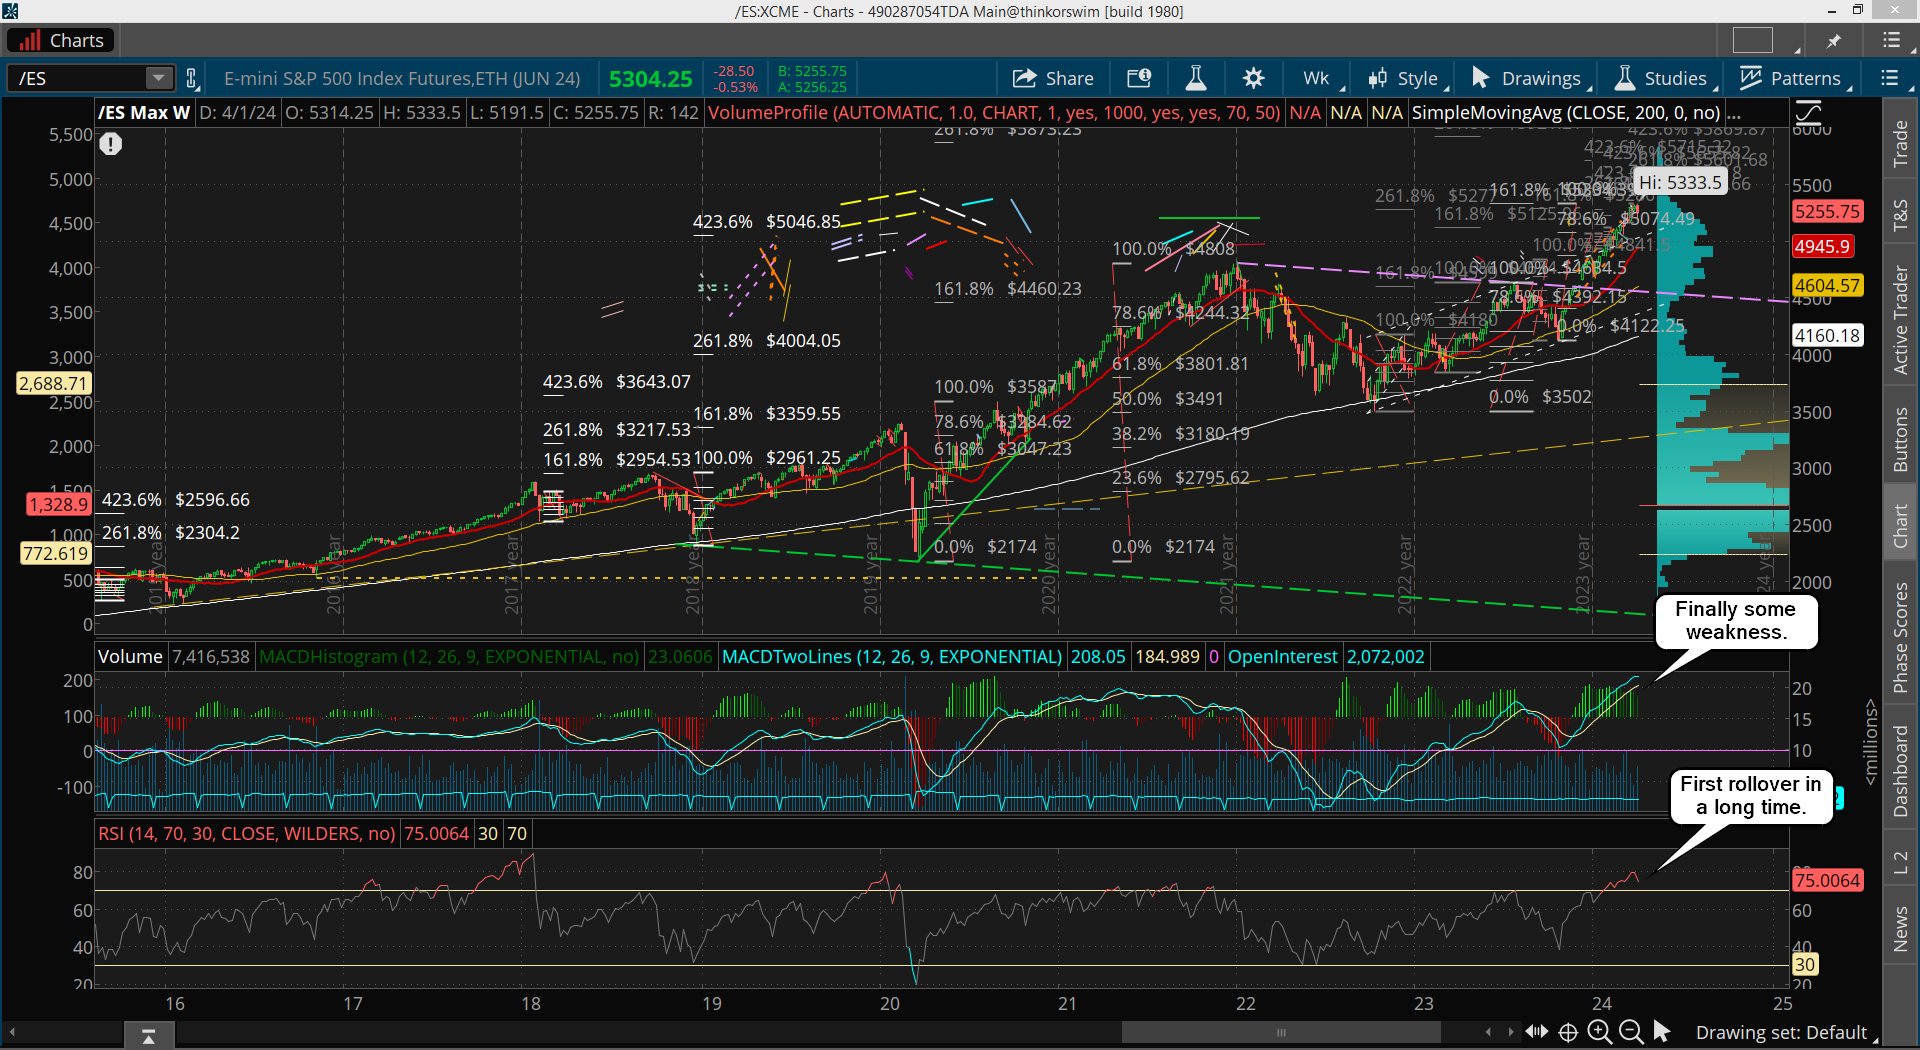
Let's go over some charts now. First is the weekly...
Notice how the RSI has finally turned down from going up and up and up for what seems like forever. The MACD is also "hooking over" now, which is a sign to me that the market is tired and needs a deeper pullback before racing off to 6000 and beyond.
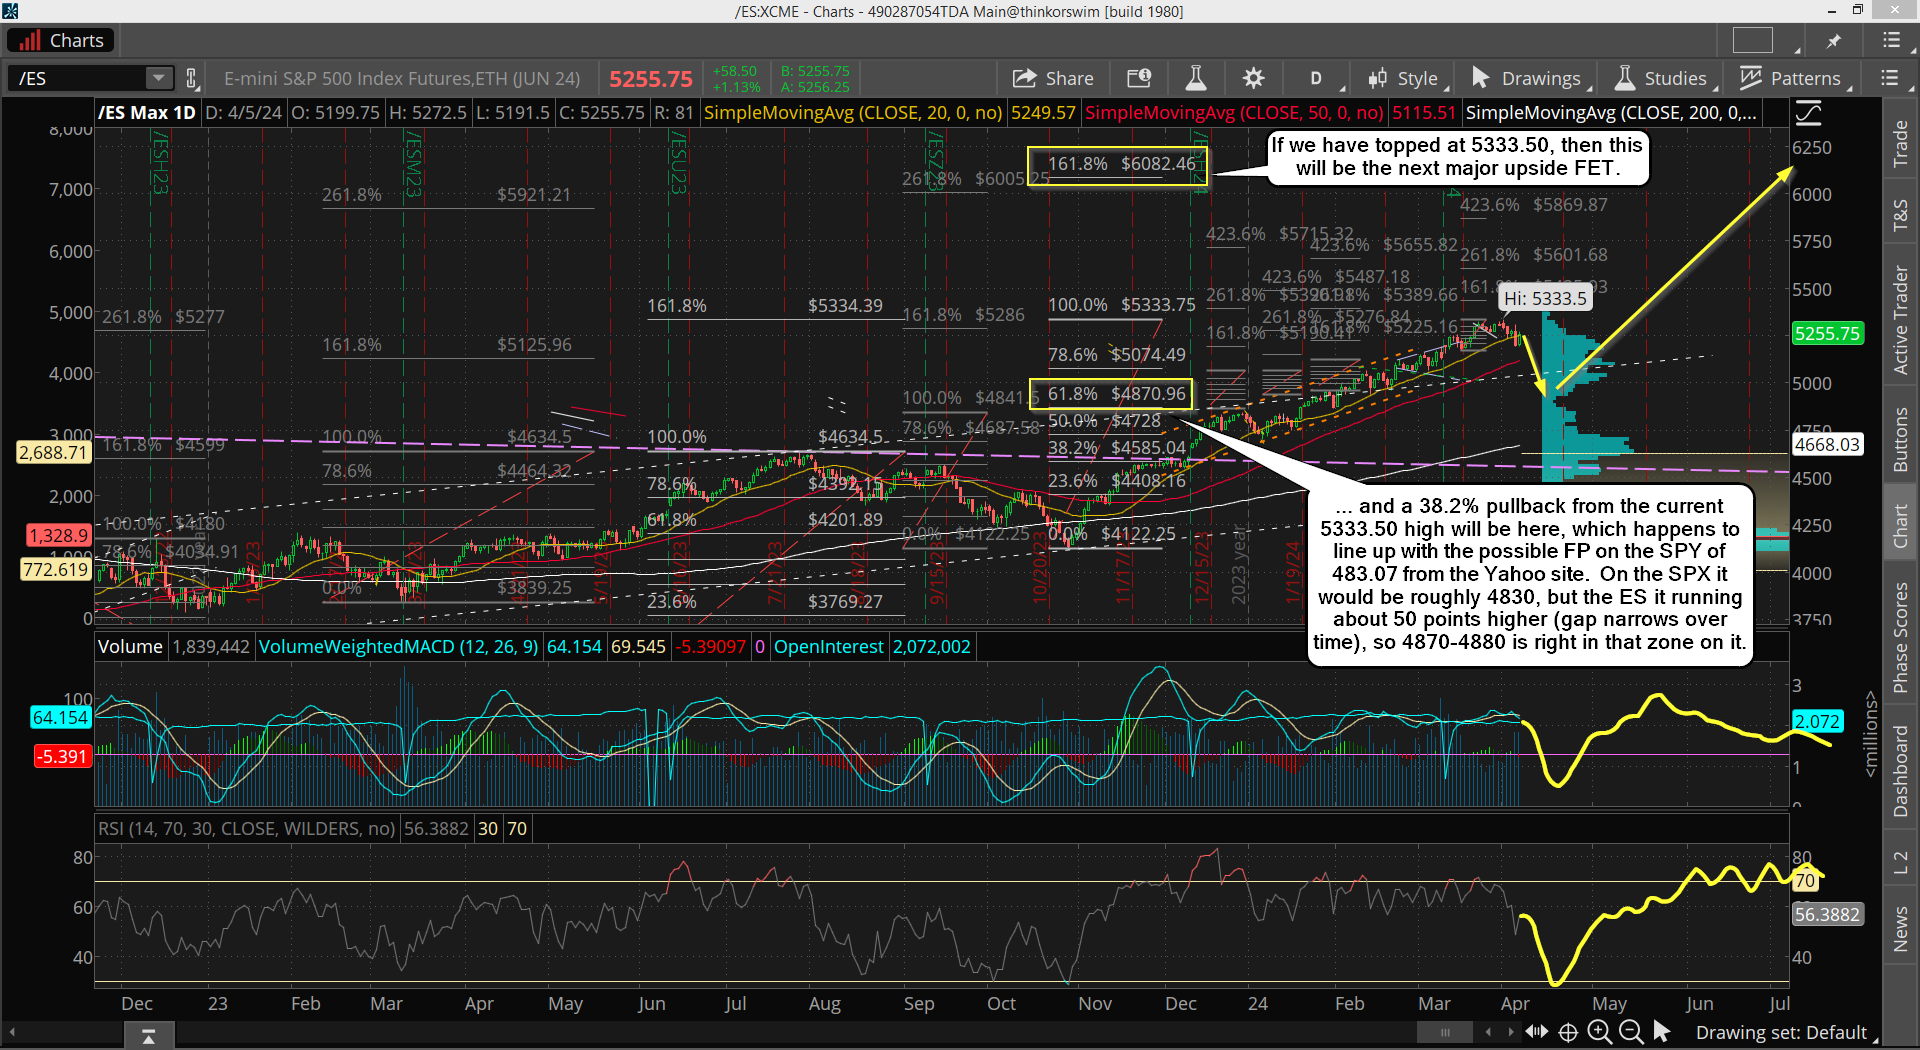
Now the daily...
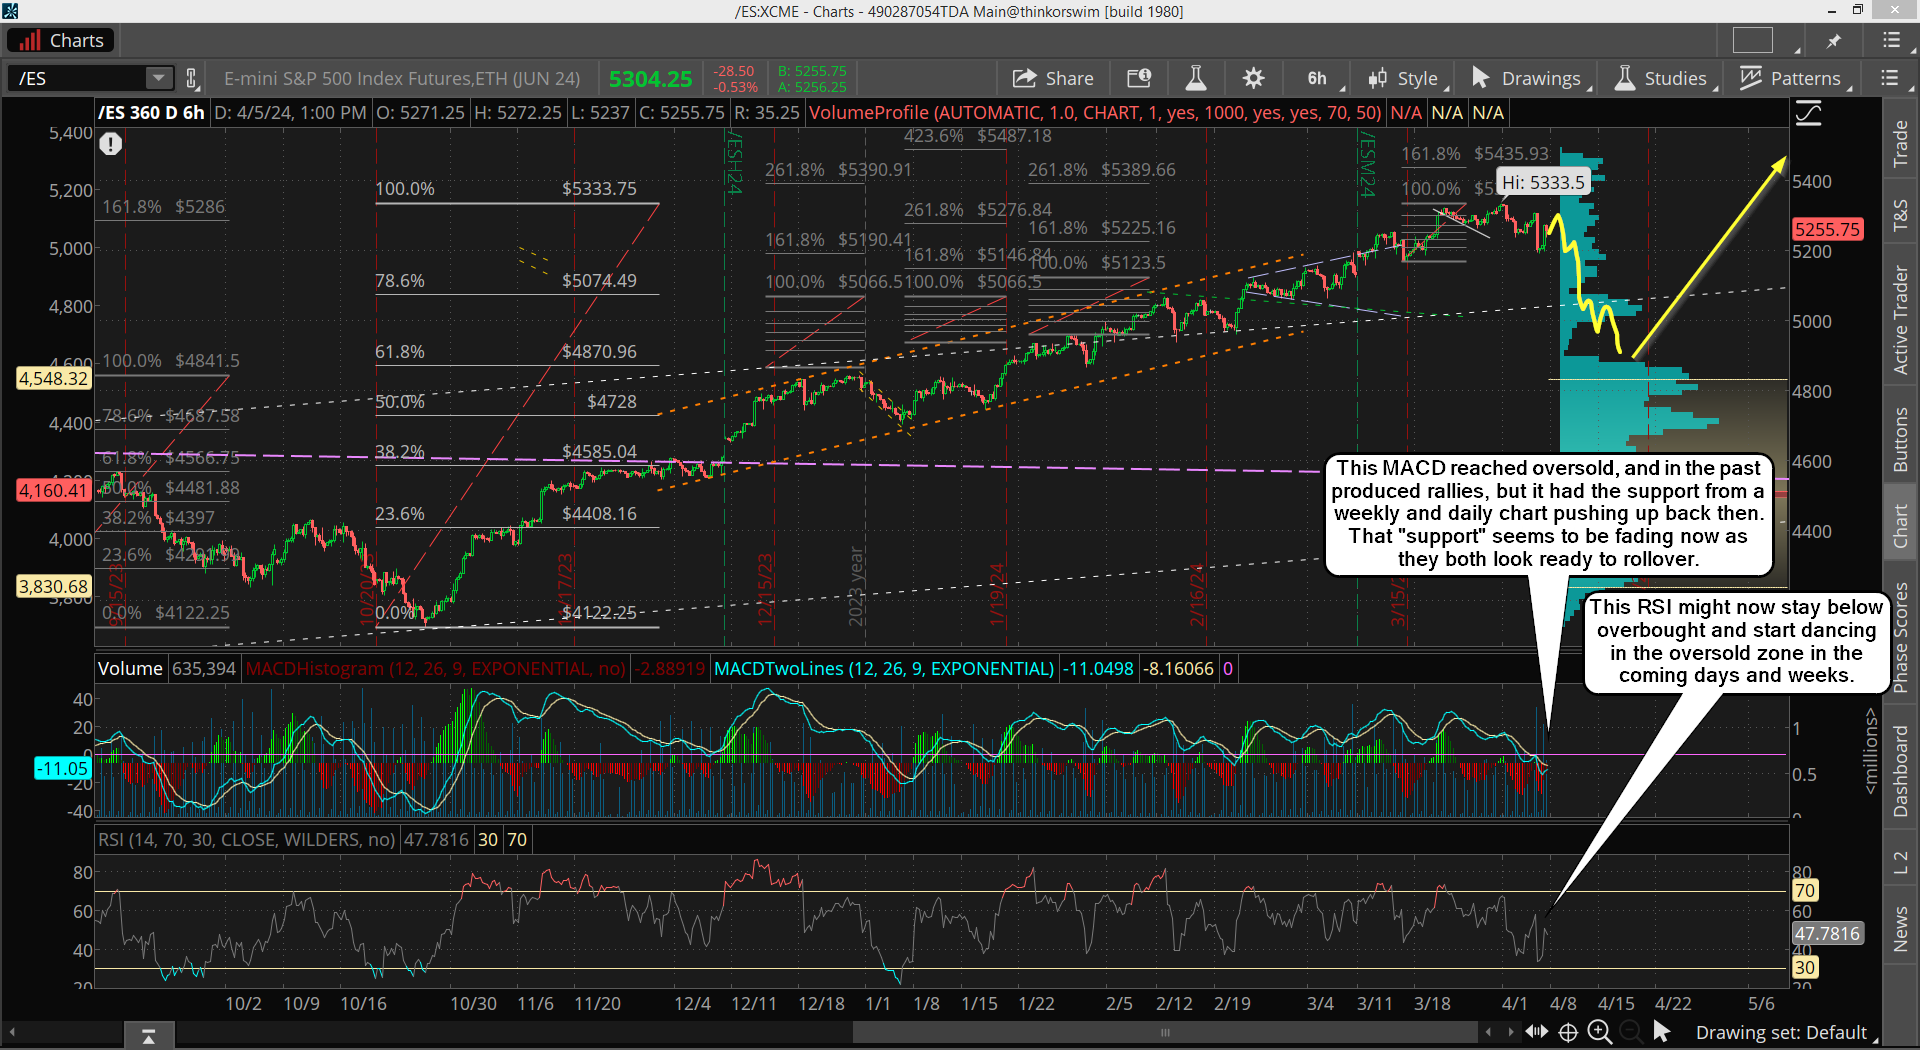
This coming correction should pullback about 38.2% of the rally up from the November 2023 low to the current high, which is roughly 4870 on the ES. I've drawn it on the chart as lasting about month but it could be faster or longer in time, I just don't know? There's a turn date on April 21st and then other on May 2nd, so maybe it's one of those dates that puts in the low?
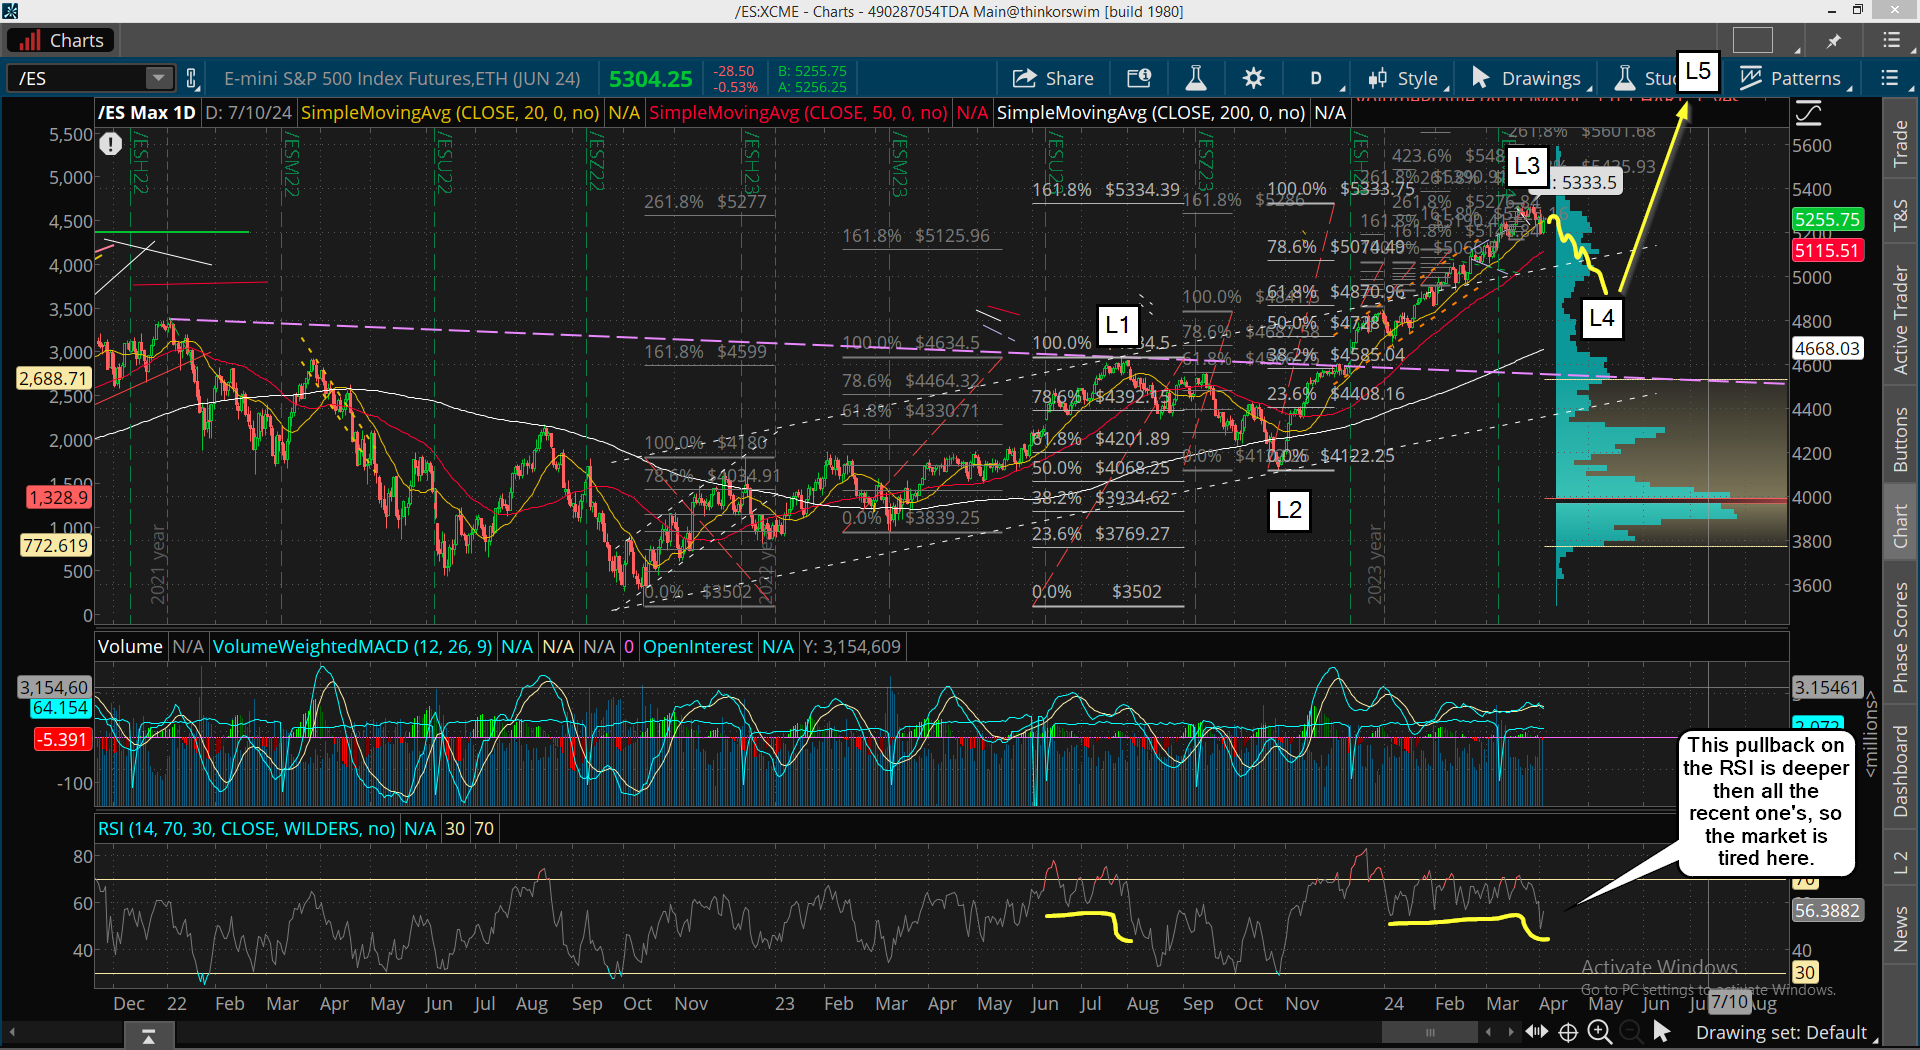
Next is the 6 hour chart...
Notice how oversold the RSI got on that drop, and how the MACD went below the midpoint level, which in the past has produced a nice rally back up for days to weeks. But with the weekly and daily getting tired and looking like they want to rollover here it suggests we could be ready now for a nice correction.
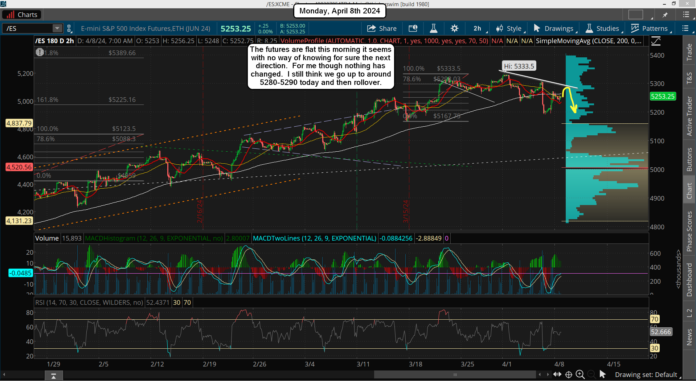
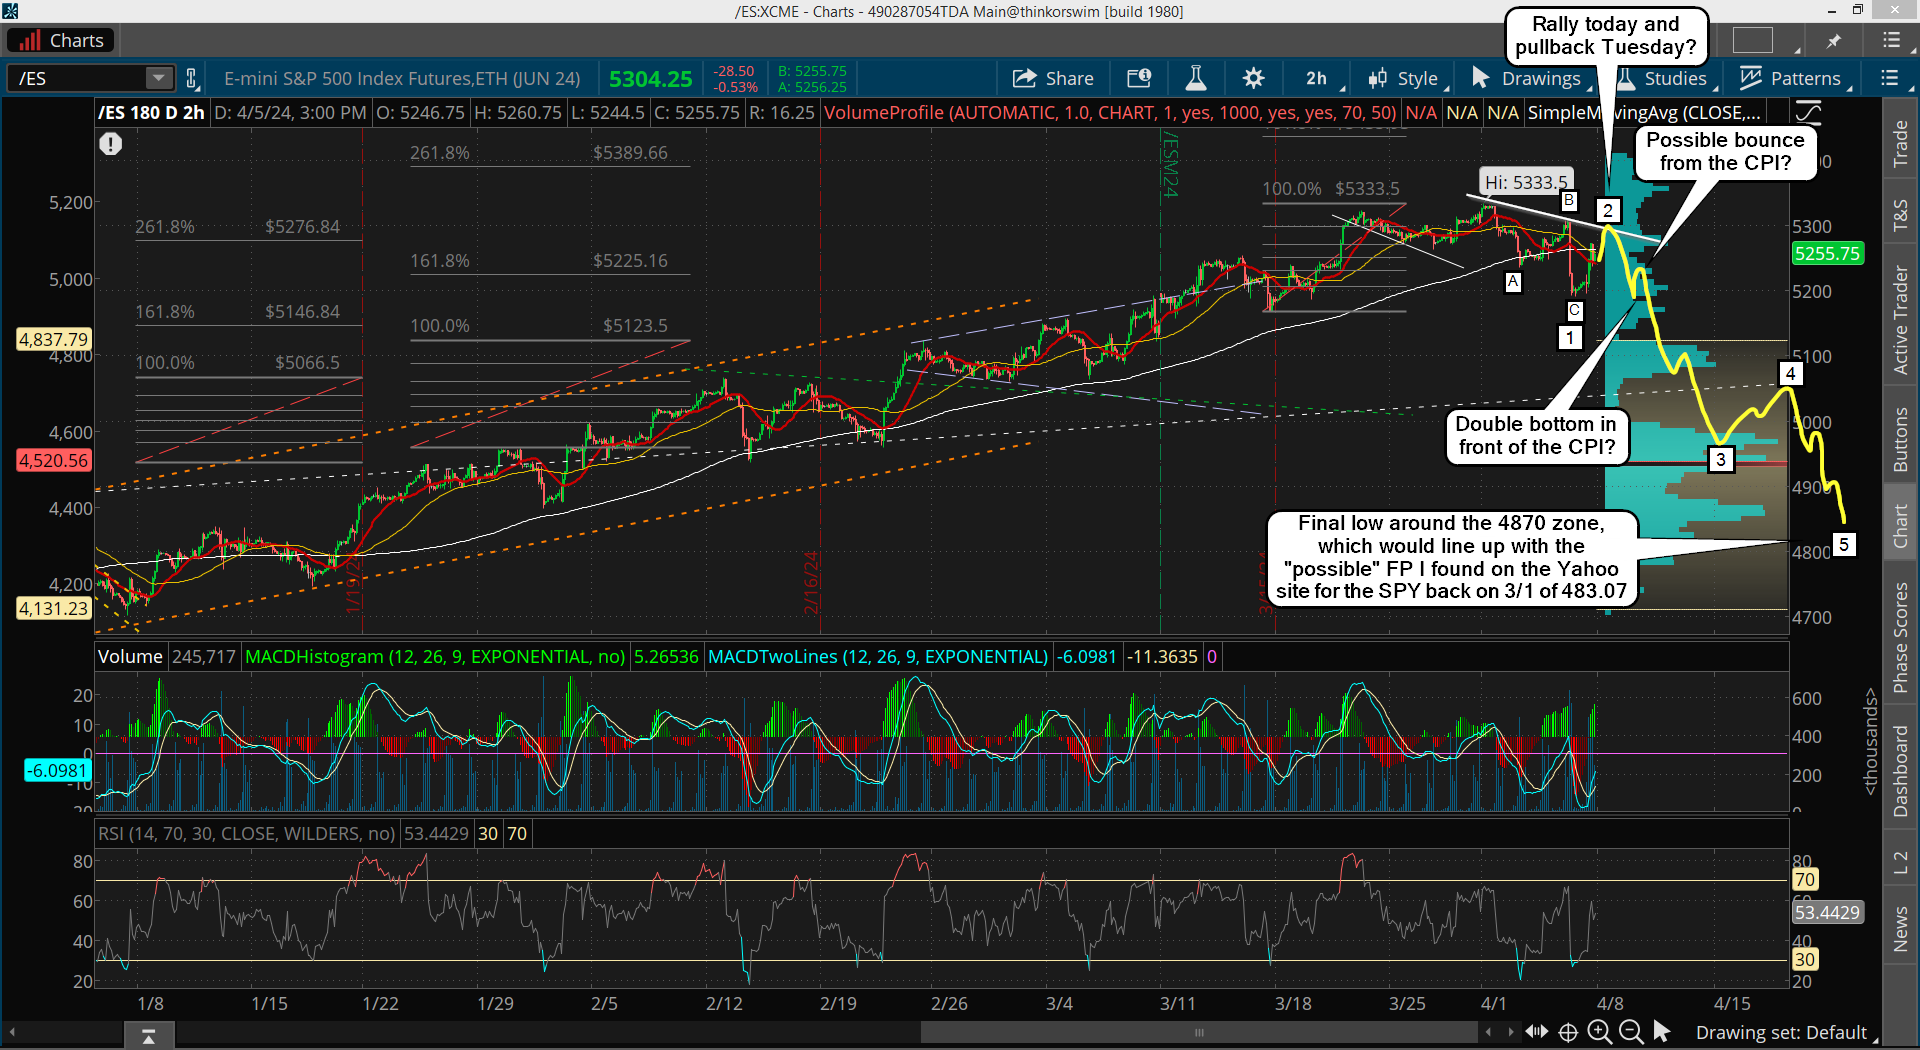
Lastly is the 2 hour chart...
On it you can see that we could rally up to the 5280-5290 area Monday from the oversold MACD's and RSI, but again... the weekly and daily charts are tired and won't likely support much more on the upside until we get a deeper correction. Any rally up to that zone will not likely get through it. It should fail and rollover again into Tuesday.
No one knows for certain when a nice correction is going to happen as bull market are known for killing the bears as they short all the way up. But currently all the technicals tell me there's a really good chance here that the high is in now, and that we are going to start the 5-10% correction this week.
Also...
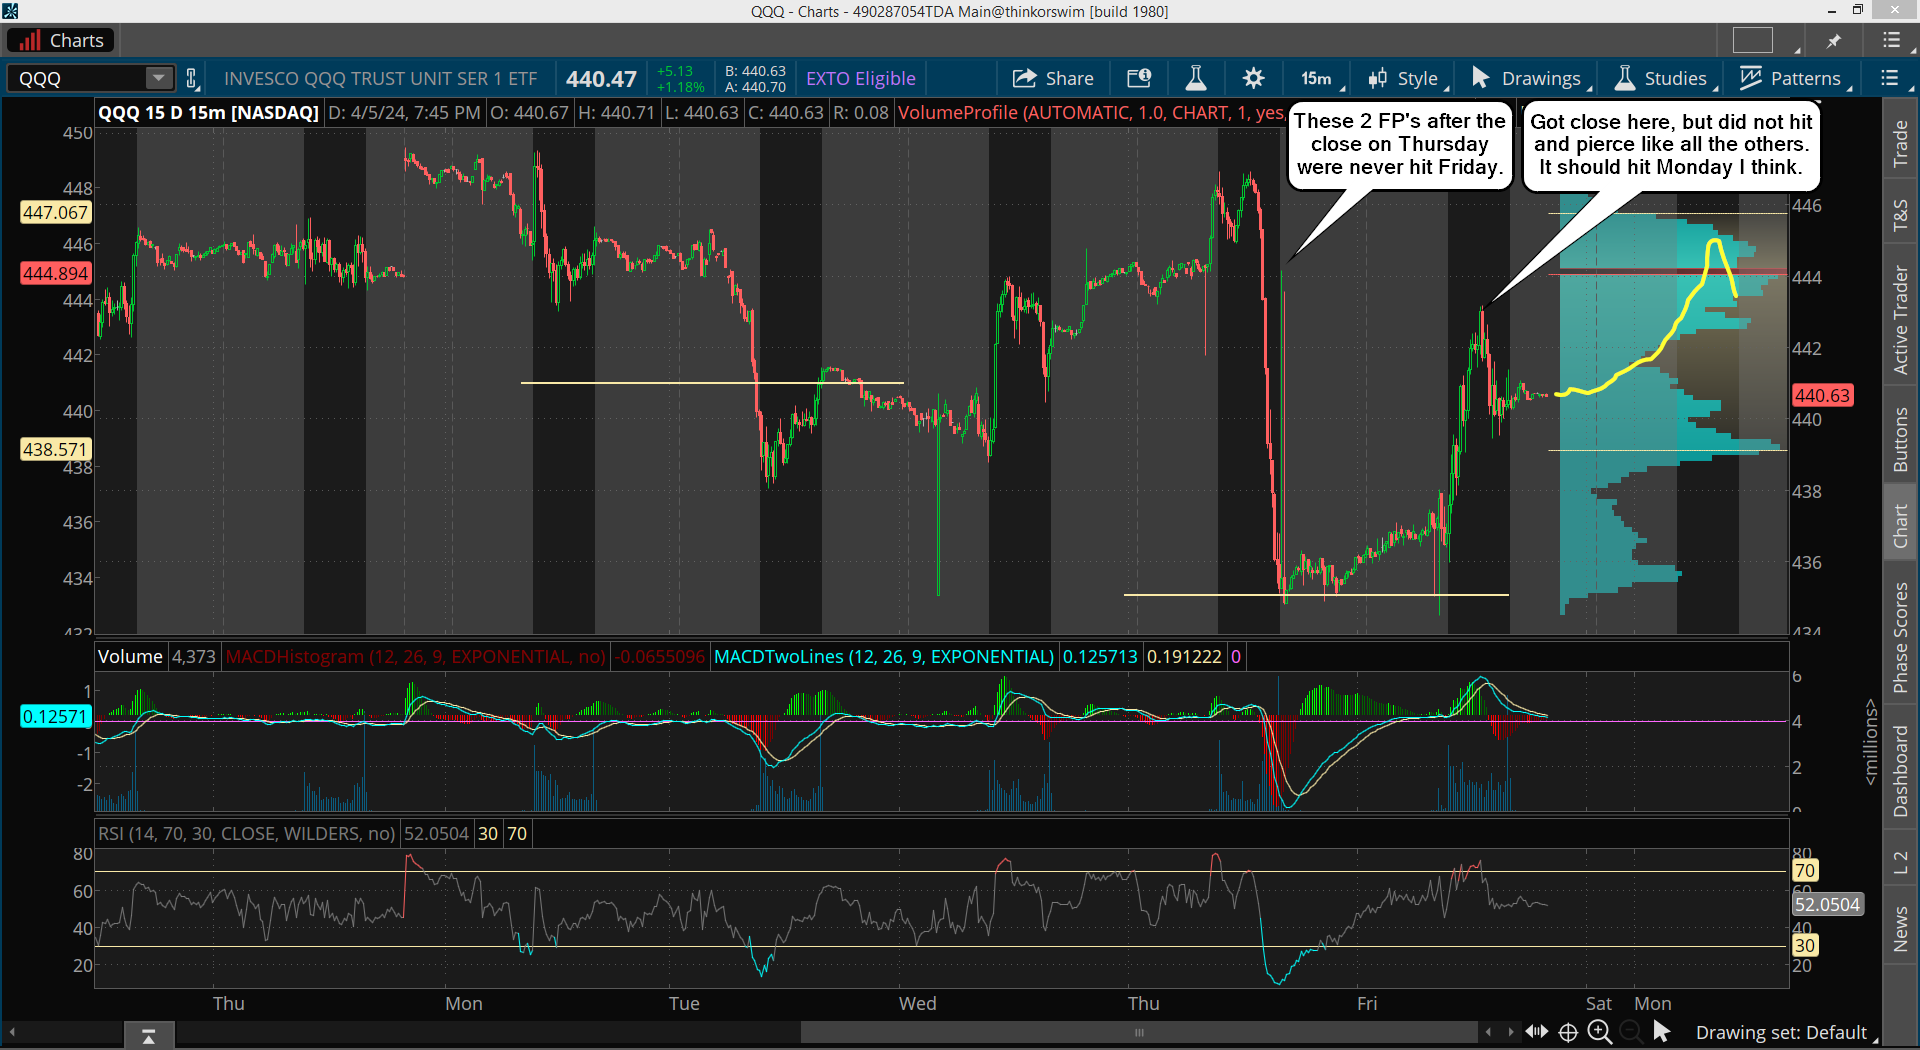
The FP on the QQQ never hit on Friday. It got close but missed by a little. That's another reason to think we'll go up on Monday to hit and pierce it.
Have a blessed day.

