

Blow off top? We got the rip after the CPI that I was looking for, but they skipped the dip. They just gaped up and squeezed the rest of the day to put in an early all time high on the SPX cash and late one into the close on the ES futures. From a technical point of view it looks like it can go higher as the MACD on the daily chart is still pointing up strongly with no sign of turning down. But that's not something you can use to forecast a "turn" as it won't show any weakness until after the move down has already started.
This morning we have the jobs number coming out before the open, which might be used to get that turn down? If not then there's not much left as far as "events" that can stop this bull it seems.
I've not had any new FP's on the QQQ since the 4/18 low, but we finally got a one yesterday before the open. Here's that chart...
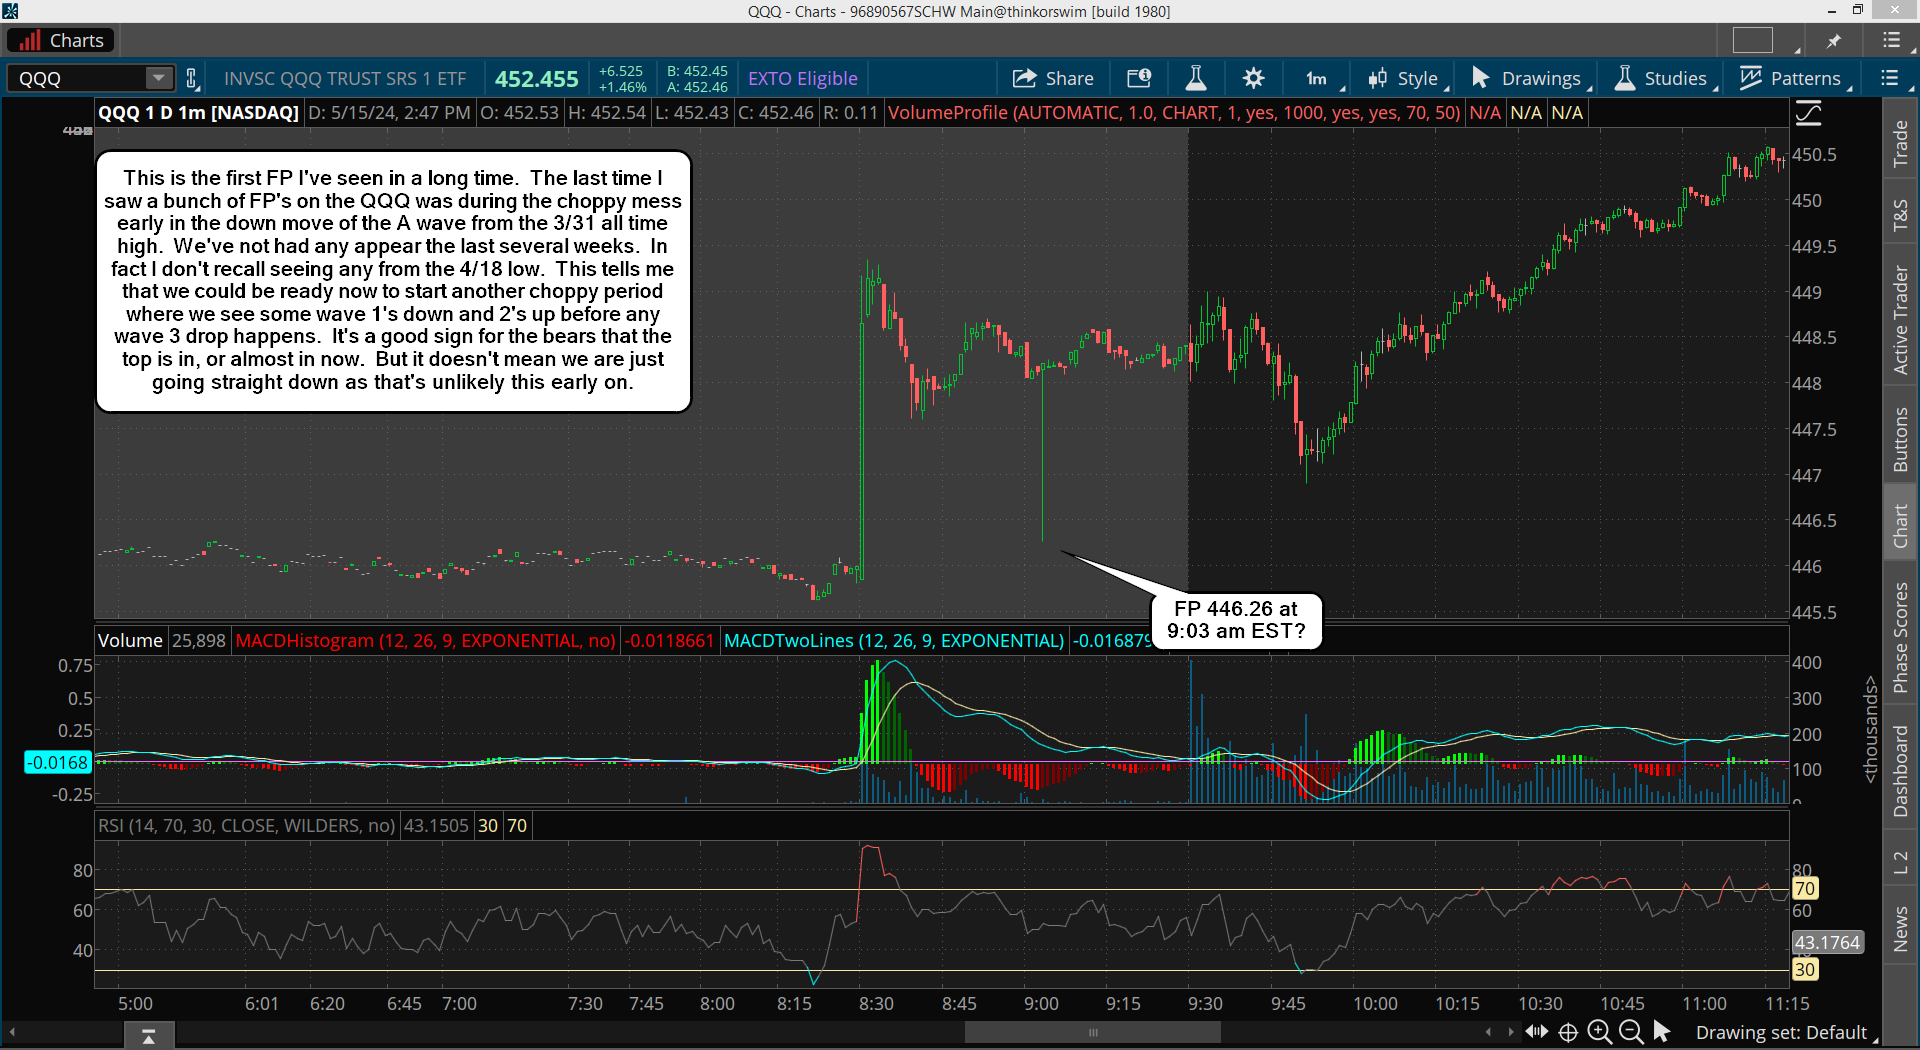
It's never a guarantee of course but during the early part of the A wave down from the 3/31 high there were many FP's that appeared, which caused a ton of "whipsaw" action until it got later in the move. Then the FP's stopped appearing and we just went down and bottomed at 4965, where there was still no more new FP's during the entire rally up to the current level.
What does this mean? It's hard to say for sure but it might mean that the lack of any FP's means we will be in a steady trend move and when the FP's appear again we'll go back to the wild up and down swings as the market makes a turn to start a new trend, which would be down this time around.
However, the technicals are currently still bullishly aligned on the daily chart, and with the new all time high happening we could just continue much higher and the 2 FP's I have on the SPY might not get hit until some future time that's weeks or months away. That's the downside to the FP's you never know when they are going to get hit.
As for today, I really don't have any clue. I'd say simply that we will continue going up until we don't. Every time I think we have topped it keeps going higher, so I'm just going to let the market top and turn whenever it wants to. I can't force it, but double tops usually produce a pullback of some degree, so I'd have to think that's coming soon.
Have a blessed day.


We’ve got a top like the 1987 top. Whether it’s the first one or the secondary one, I’m not too sure but we’ve got some astro igniters coming up one of which was seen just after the Covid crash high in 2020 and we’re in that cycle right now. It might be part of a 222 week cycle (1/3 of ###). I need to research that. I’ve known it as a monthly cycle. It’s a little off right now unless it’s going to be a high.
It’s also like the March 2000 top and the Feb 2020 high but the latter had poor breadth going into it. I’ll have more later if I stick around.
I got a topping signal from my exhaustion indicator today for the SP 500.
One of it’s components is extended on a derivative index and will soon catch up to the index soon unless it falls to it first. When they cross ,that should be good sell signal with this double top formation so far above the 200 day average for the SP.
The weekly SP 500 candlestick chart looks like the Nasdaq 100 daily chart in late March 2000. I want to see a monster spinning top candle for this week’s bar. I guess it’s already a spinning top but it’s a fat one.