

So far, so good...
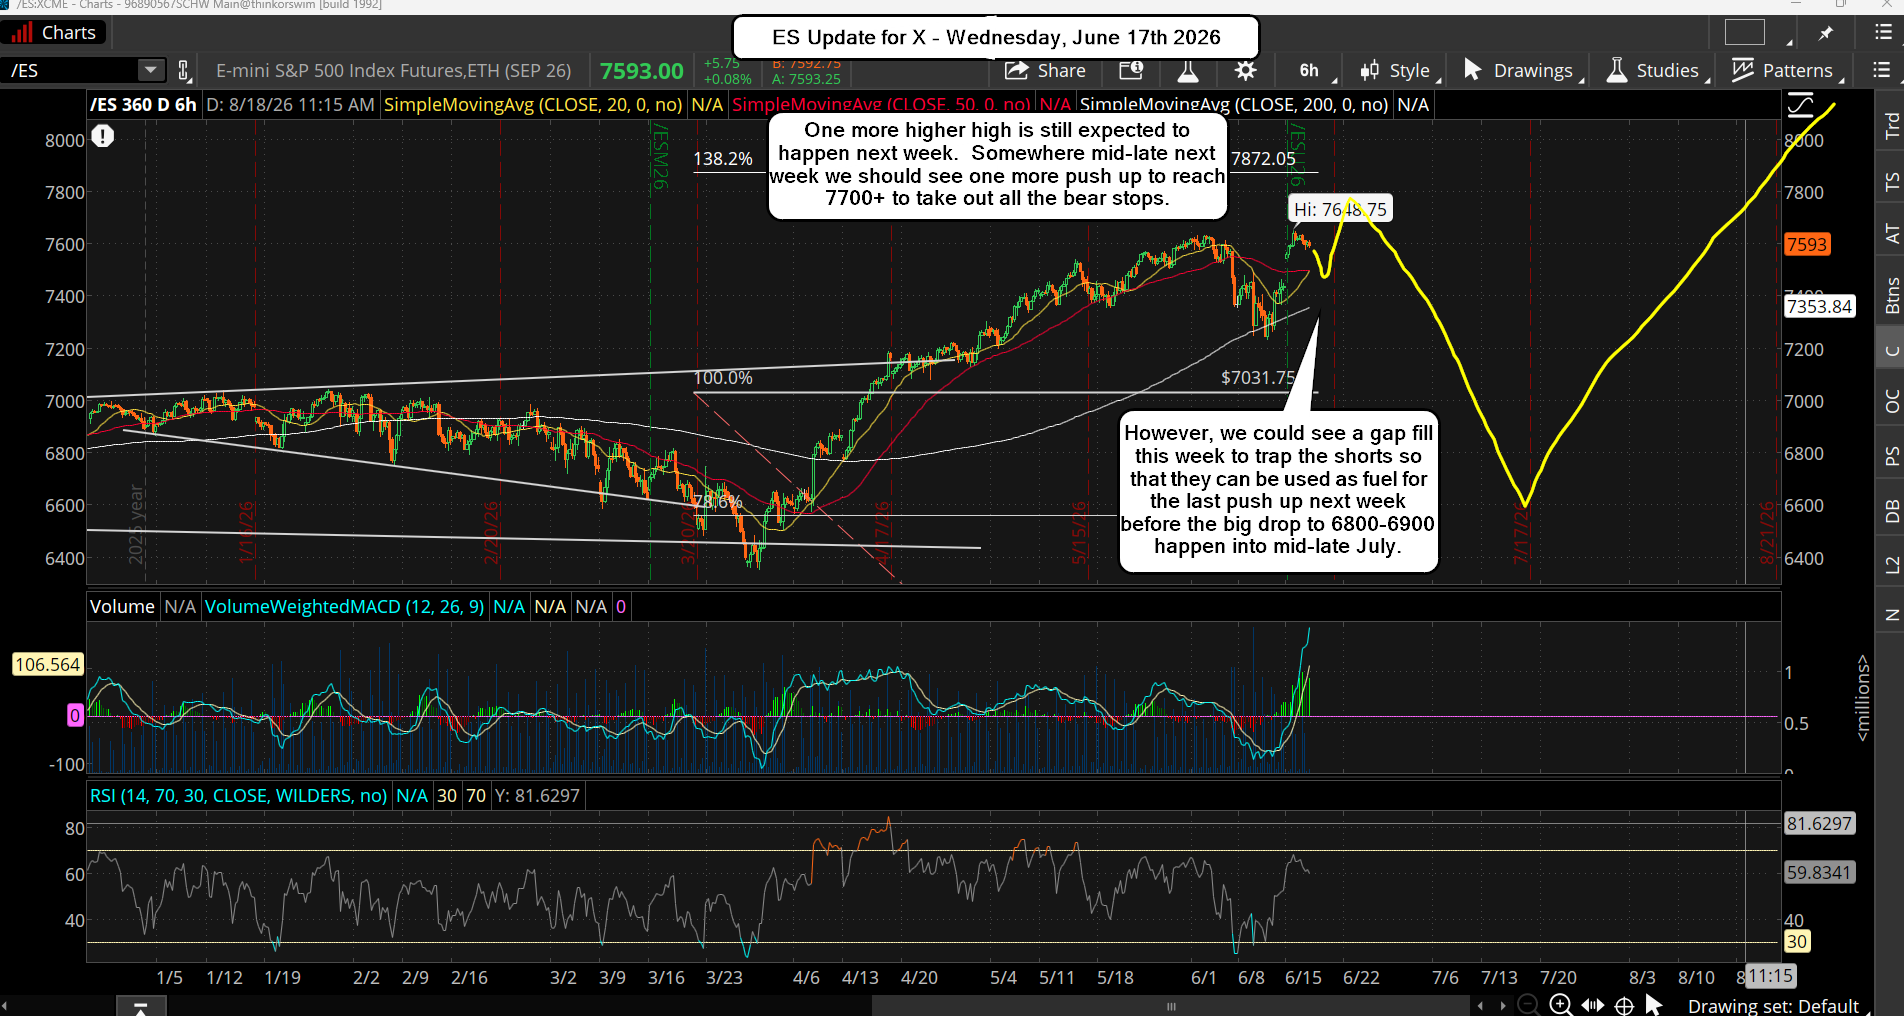
The market had a top on the June 5th, pulled back for the first drop, and then rallied up into the next turn window on the 15th, where it pulled back again. I've been saying for a month or more those dates and while I leaned toward the 5th being the start of the drop the 6800-6900 zone I adjusted it and pushed it out into the 15th. Now I'm pushing it out one more time to the 24th-26th window, and that top should be the highest high (7700+ ES) before a large 2-3 week drop to the 6800-6900 area.
However, even though the 24th-26th is the window I actually lean toward the 23rd as reaching 7700+ is only about a 150 more points higher and the market can do it in a day if it wants too. So I just don't think it will drag out too much longer, and with the peace deal getting signed tomorrow I think that event will be used to get that last squeeze higher next Monday and Tuesday. We all know how the news is used to cause surprise drops or gap ups, and yesterday we had a surprise drop to fill the gap on the ES (almost) after the FOMC... which is usually a bullish event. Now those bears are going to get squeezed out into early next week I think. Here's a chart I posted on X yesterday...
Nothing has really changed from it, but I'll add in the most likely wave counts in the chart below. Elliottwave is always a backwards looking system as while you can try to predict the future with it you commonly get it wrong and have to adjusted. However, if you use cycle work too, and make your waves line up with the cycles then you have a much higher odds of getting the bigger waves correct. But the smaller ones are tough as the market tends to subdivide and subdivide.
The really big picture waves are hard too when are talking about going back to 1929 or something, which I do think we have another one of those tops and crashes coming, but I don't see it until 2028 at least. Anyway, I'm not going to try to forecast those waves as it's too hard. I'm just going to stick with Large, Medium, Small, and Tiny waves as this is about making money, and not trying to predict the next 1929 depression.
So don't get too hung up on the wave count as it's not important to be 100% right. The most important thing is to get the big moves timed correctly so that one can profit from the move. The coming top next week will likely end what I'm labeling as Small Wave 5 inside Medium Wave 1, inside Large Wave 3, inside Extra Large Wave 3, inside Extra Extra Large Wave 3. Below is the big picture wave count...
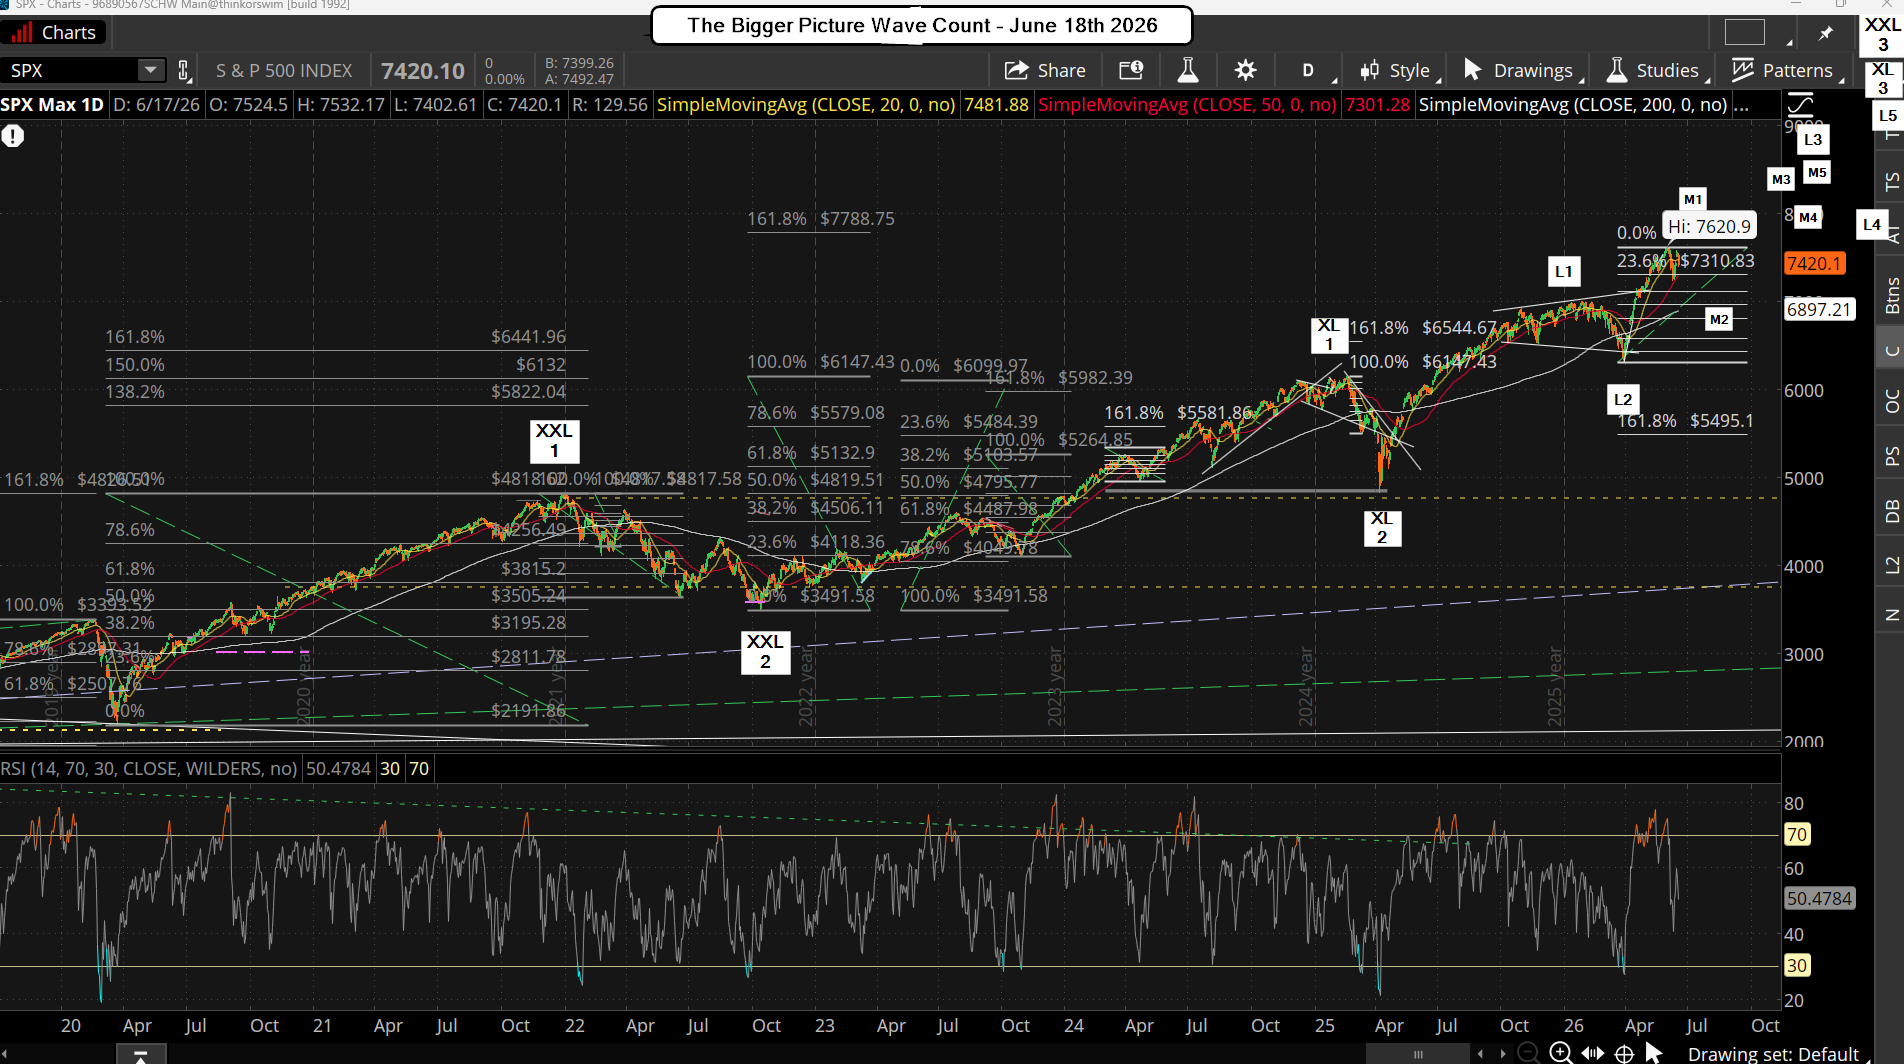
As you can see in the chart above I'm projecting that L3 will top out this September sometime, and it should be above 8000. Then L4 will be a choppy pullback into the November election, and L5 will go up into early 2027. That's where the craziness starts XL3 ends the XL4 and XL5 will be full of wild swings up and down all of 2027 most likely, just to complete XXL3.
Once its' done XXL4 and XXL5 will be even wilder as we go into some massive blow off top in late 2028 I suspect. That's one time period where we could see a 1929 style crash, but lets not worry about it right now as that doesn't make us any money and only causes worry. It could be delayed and push out into 2032 as well. Now, for the shorter term we have the chart below...
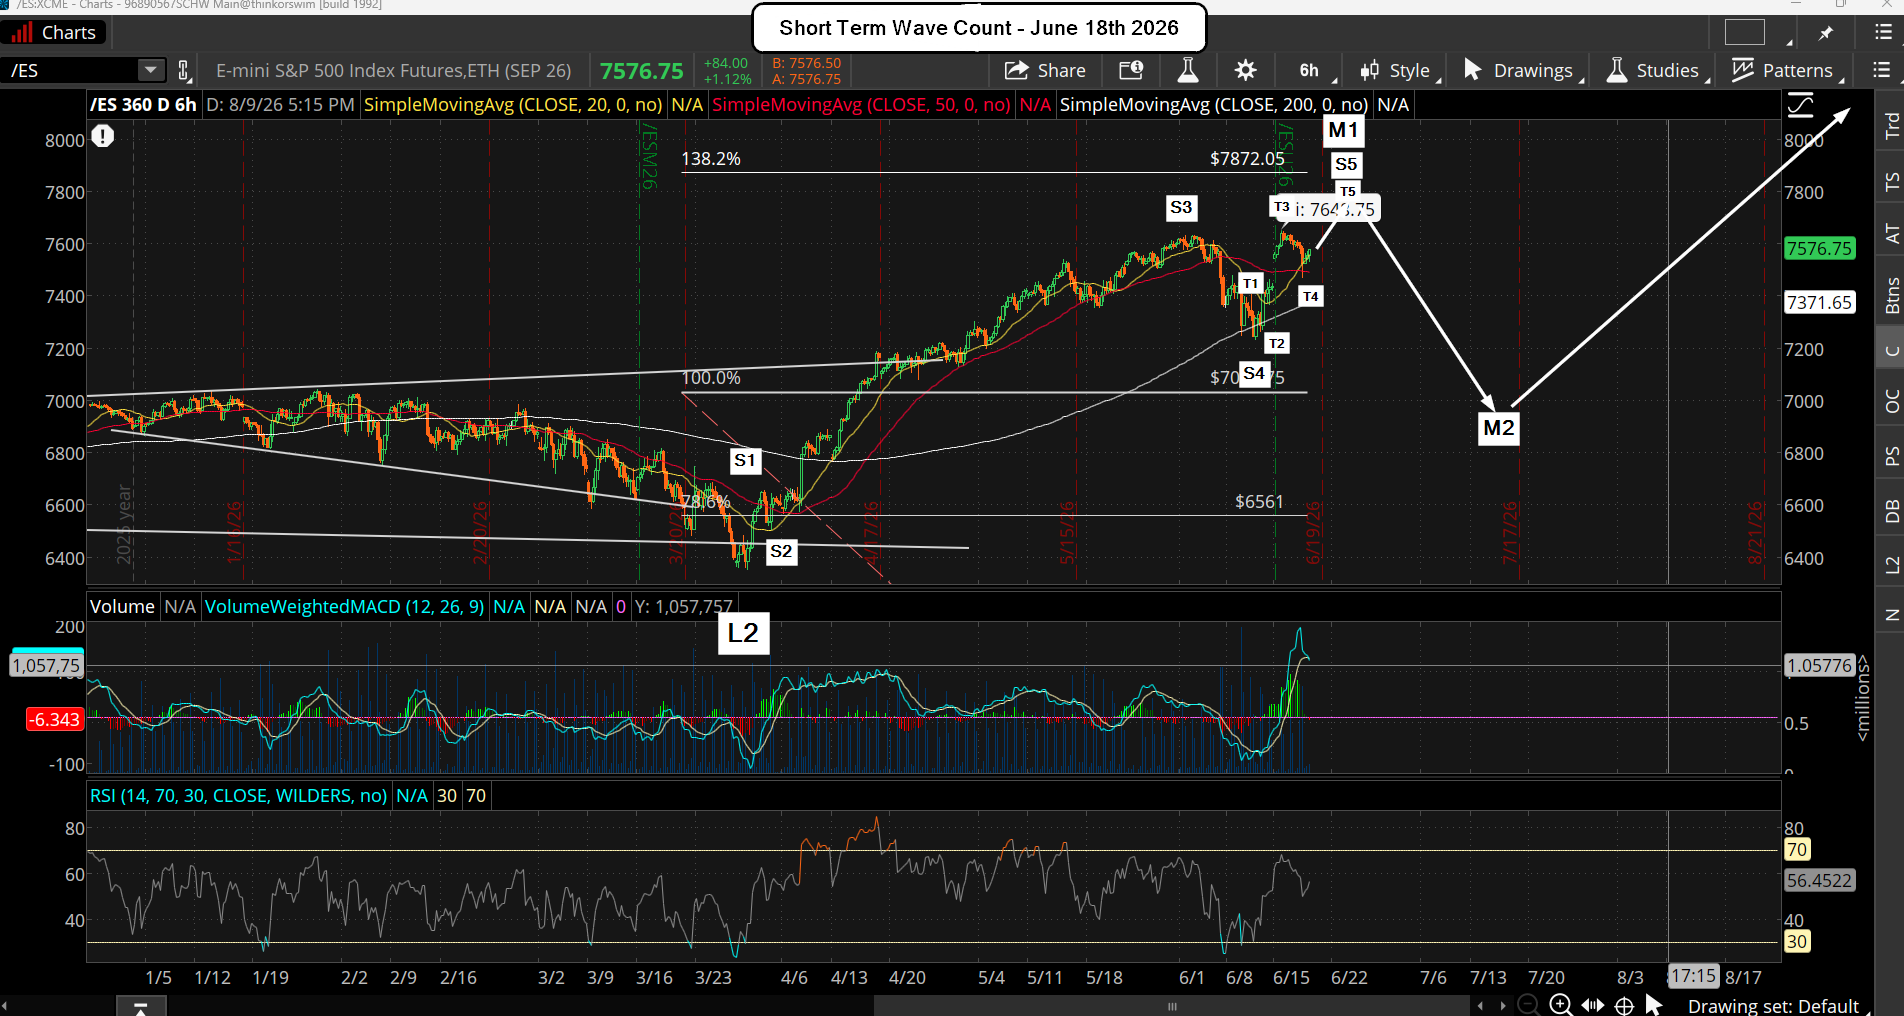
For it I think we are in T5 up with yesterdays pullback after the FOMC being T4 down, which should end next week, and it will complete S5 inside M1. That's where we should see a 2-3 week drop for M2 into early to mid-July. It could extend into late July but currently that's not looking likely. The top should be next week, and the drop should last 8-10 trading days. That puts the time line out into mid-July at the latest I think. It could change but that's what I'm forecasting right now.
Have a great weekend.

